
 15
presentation
Indie Magazine Startup Pitch Deck
Shape your publishing concept with an indie magazine startup pitch deck featuring pastel gradients, bold collage layouts, and editable planning slides.
Google SlidesPowerPoint
presentation · English
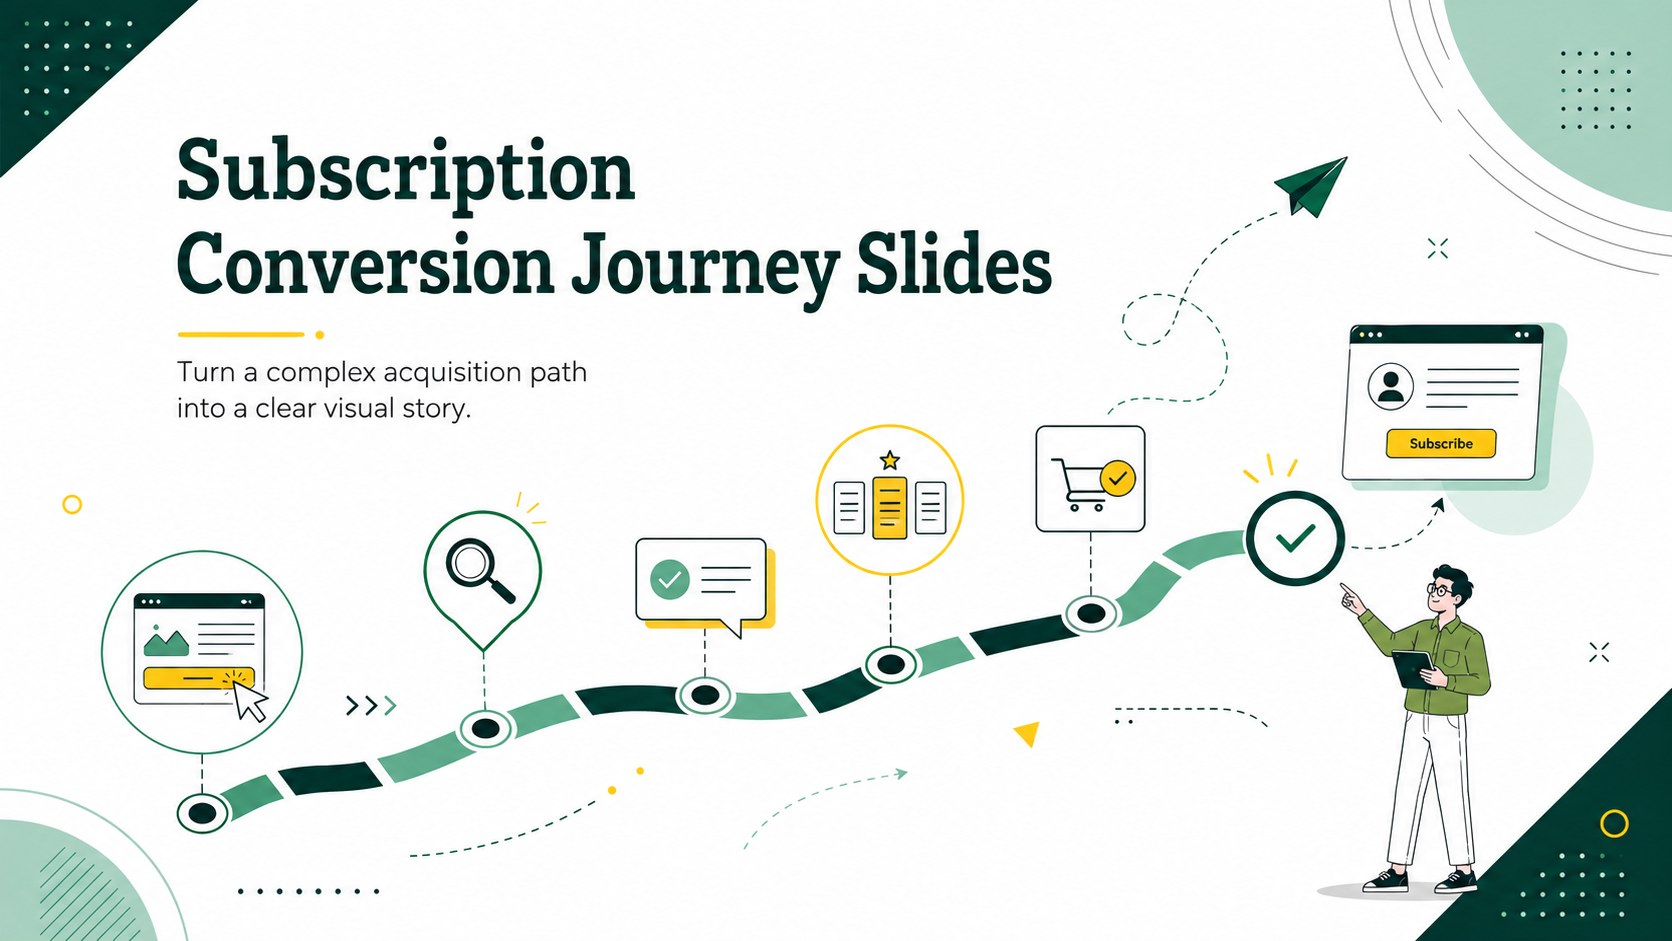
Map every stage from lead to renewal with subscription conversion journey slides, featuring green, white, and yellow visuals for PowerPoint and Google Slides.
Design notes
Subscription conversion journey slides give SaaS teams a clear way to explain how prospects move from first contact to paid adoption and renewal. The lively green, white, and yellow illustrated design keeps complex pipeline information approachable while preserving a polished business tone. Use the deck to align sales and marketing teams, summarize acquisition plans, or make a customer conversion story easier for stakeholders to follow.
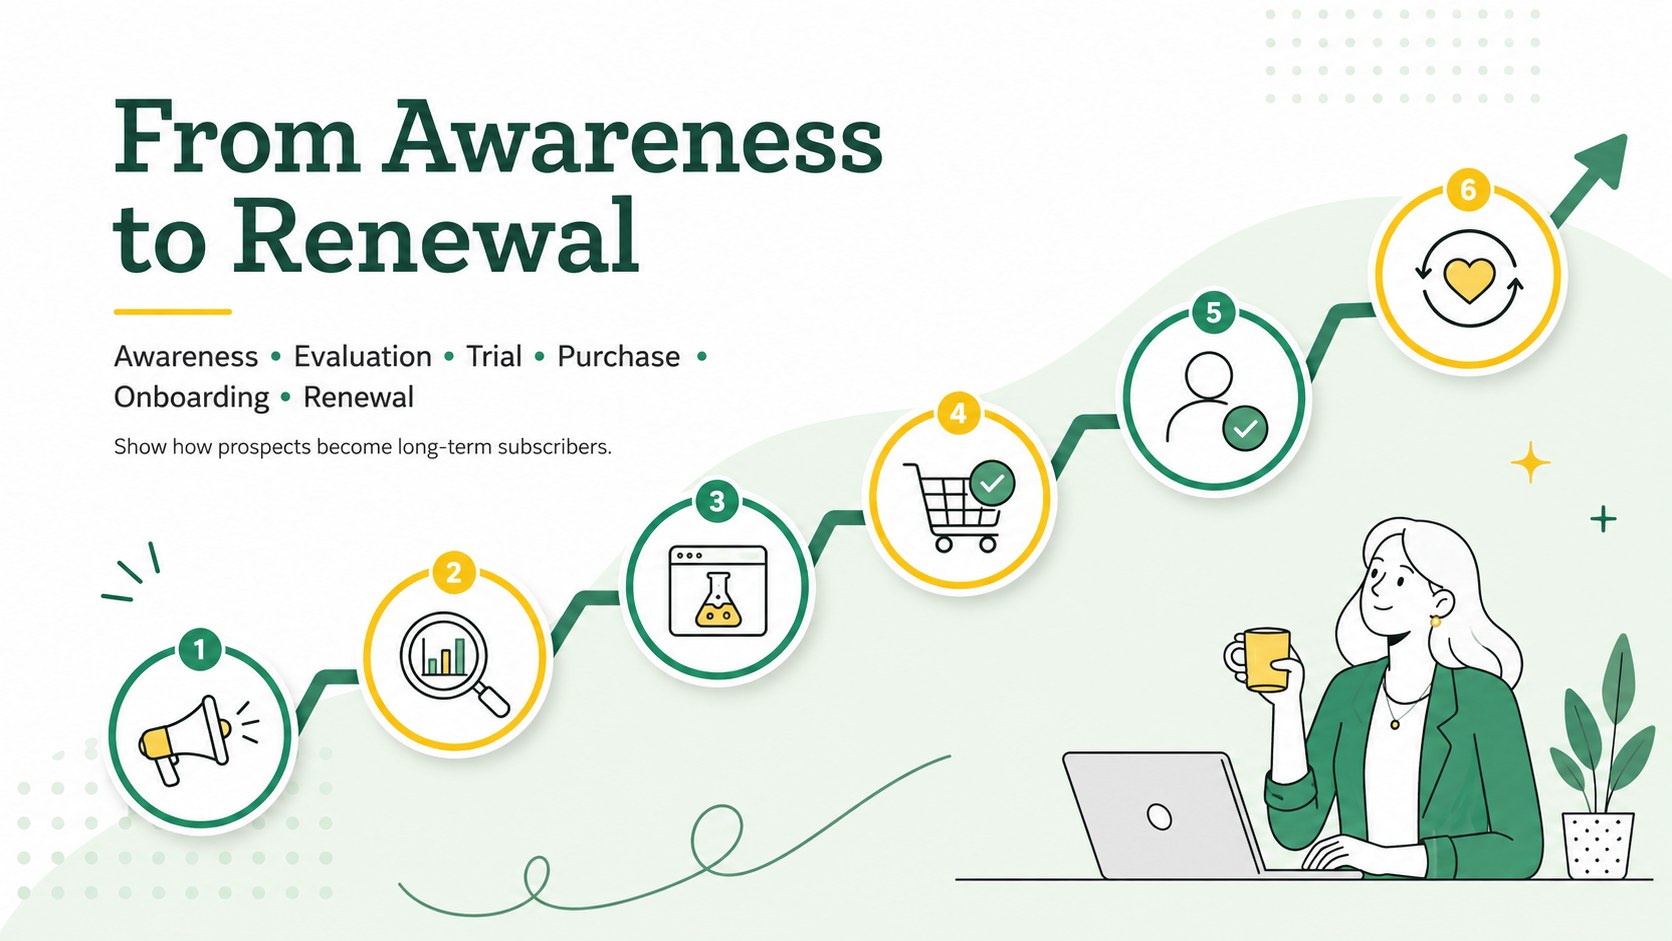
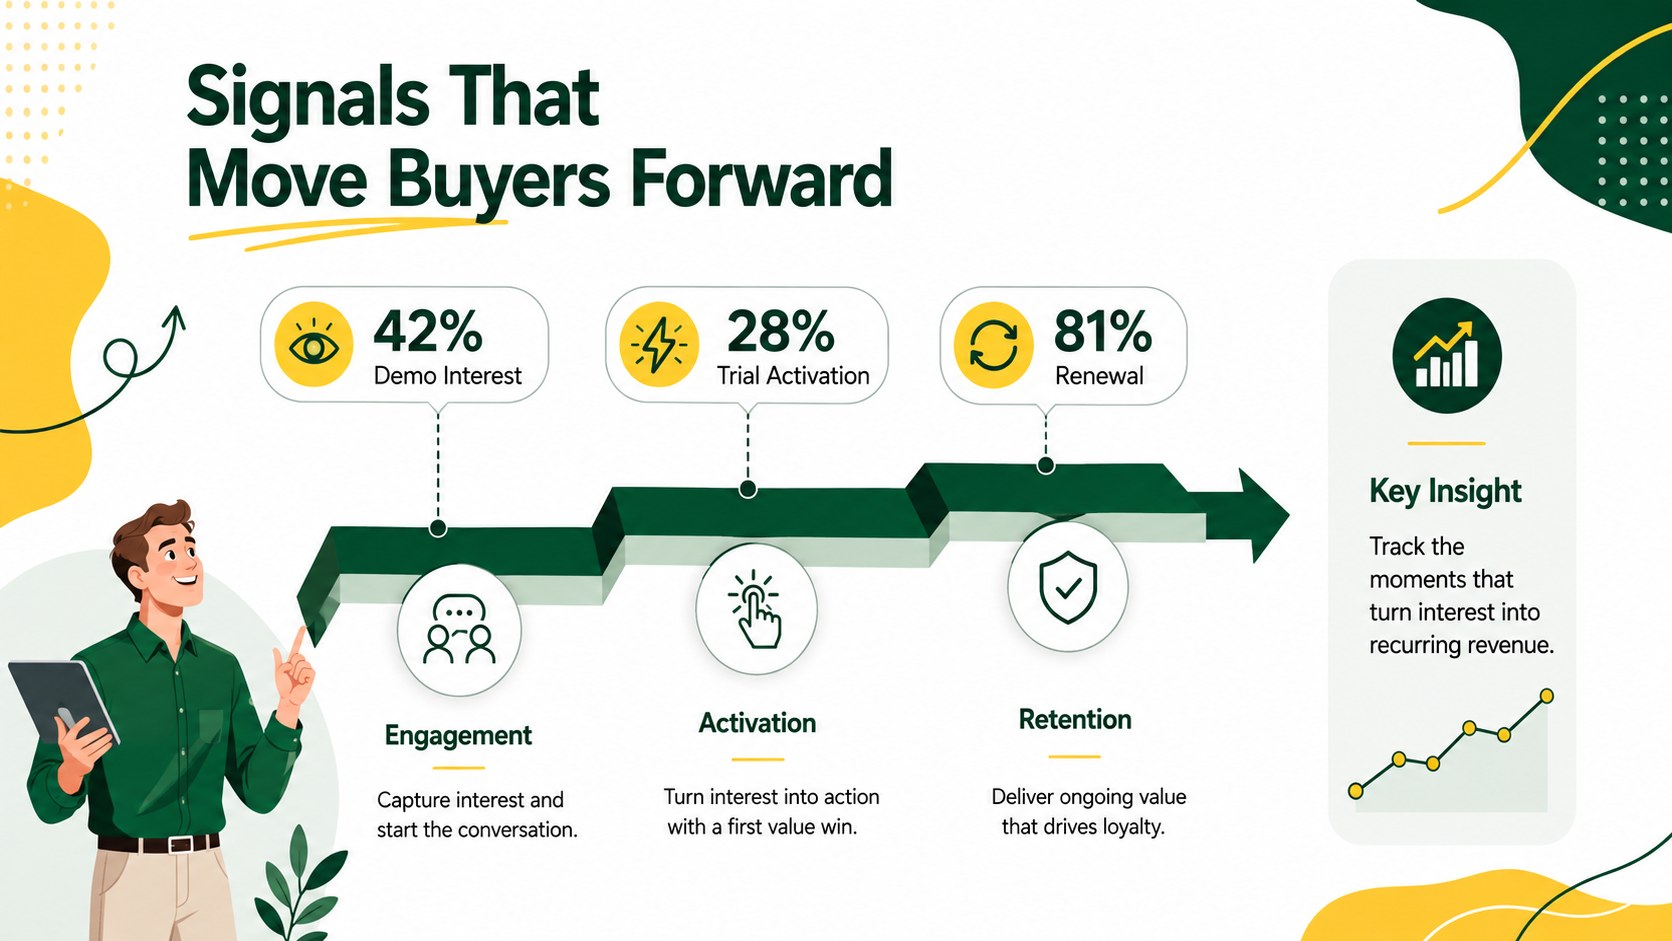
Inside, you will find a structured journey overview, a lead to trial conversion diagram, and a visual breakdown of the signals that move buyers forward. Editable stage labels, concise text areas, arrows, icons, and data callouts make it simple to adapt the flow to your own product-led or sales-led process. The layouts also work as a SaaS funnel metrics presentation when you add conversion rates, recurring revenue figures, stage velocity, or churn indicators.
This B2B SaaS pipeline infographic deck is built for founders, revenue leaders, sales teams, growth marketers, product managers, and consultants. Customize every element in PowerPoint or Google Slides, including colors, fonts, shapes, and wording. Present it during an investor update, quarterly planning session, go-to-market workshop, or customer acquisition review. Whether you are mapping awareness, evaluation, trial, purchase, onboarding, or retention, the deck helps audiences see the full subscription journey at a glance.
Perfect for: startup investor update; sales pipeline review; go-to-market workshop; customer acquisition planning; product-led growth briefing.
Frequently asked questions
Can I edit each stage of the conversion journey? Yes. Stage names, descriptions, arrows, icons, shapes, and metric callouts can be edited to match your acquisition and retention process.
Practical details
Yes. Stage names, descriptions, arrows, icons, shapes, and metric callouts can be edited to match your acquisition and retention process.
The template is designed for PowerPoint and Google Slides. Both platforms let you adjust the content, colors, typography, and layout.
Yes. Replace the sample figures with metrics such as visitor-to-trial conversion, activation rate, paid conversion, recurring revenue, or renewal rate.
Yes. You can rename, remove, or reorder stages to represent a sales-assisted pipeline, a self-service product journey, or a hybrid model.
Keep exploring
15Shape your publishing concept with an indie magazine startup pitch deck featuring pastel gradients, bold collage layouts, and editable planning slides.
 16
Build clear project stories with the Icon Grid Teamwork Theme, a flexible blue illustrated deck for proposals, strategy updates, and team meetings.
 3
Turn priorities into an actionable plan with an annual goals roadmap infographic, featuring editable orange and teal layouts for PowerPoint and Google Slides.
 15
Create an Annual Achievement Report Presentation with colorful geometric layouts for milestones, results, lessons, and priorities in PowerPoint or Google Slides.
 15
Turn results into a focused annual performance evaluation report with dark 3D slides for KPIs, achievements, feedback, and next-step goals for teams.
 15
Guide a focused annual recap with Business Results Retrospective Slides, a muted brown-and-blue template for PowerPoint and Google Slides.
 6
Turn complex plans into clear visual stories with Color-Coded Workflow Path Slides, an editable set for project updates, roadmaps, and team briefings.
 6
Compare regional performance at a glance with Global Data Heatmap Slides, a clean multicolor deck designed for editable PowerPoint and Google Slides.