
 15
15presentation
Indie Magazine Startup Pitch Deck
Shape your publishing concept with an indie magazine startup pitch deck featuring pastel gradients, bold collage layouts, and editable planning slides.
Google SlidesPowerPoint
presentation · English
Build strategic roadmap metrics slides for quarterly reviews, leadership updates, and client briefings with clean blue visuals, editable charts, and…

Design notes
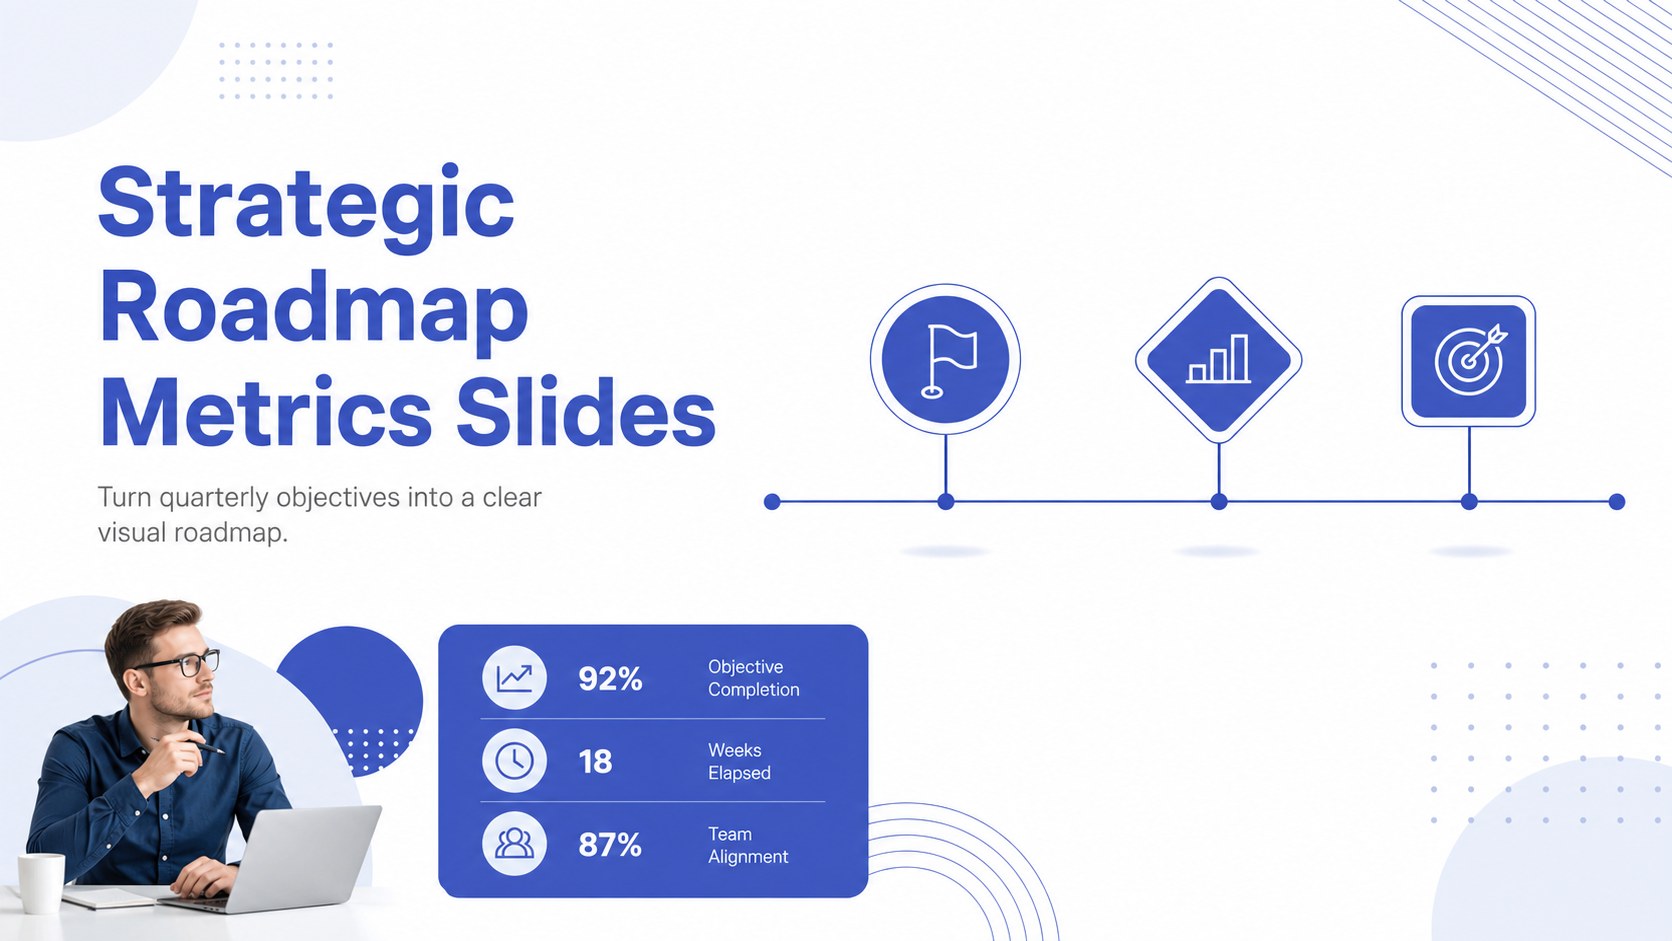
Turn quarterly objectives into a clear visual roadmap with strategic roadmap metrics slides built for concise business storytelling. The clean blue design uses generous spacing, simple shapes, and structured infographic layouts to help audiences understand priorities, progress, and upcoming milestones without visual clutter. Use the deck to connect high-level direction with measurable action.
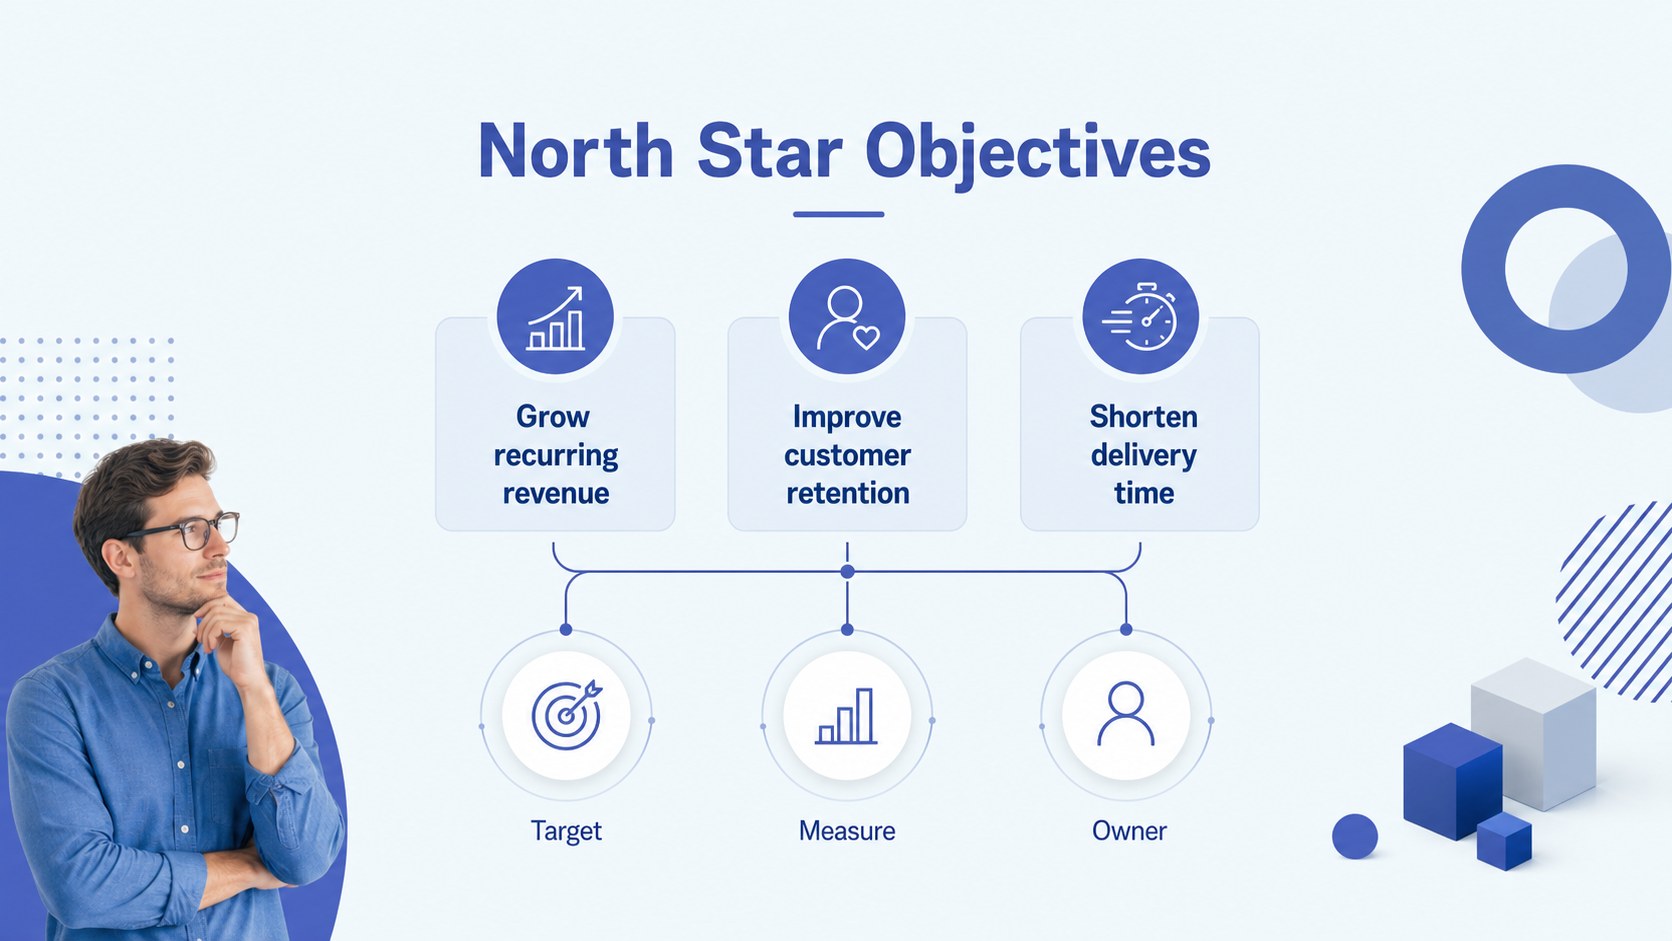
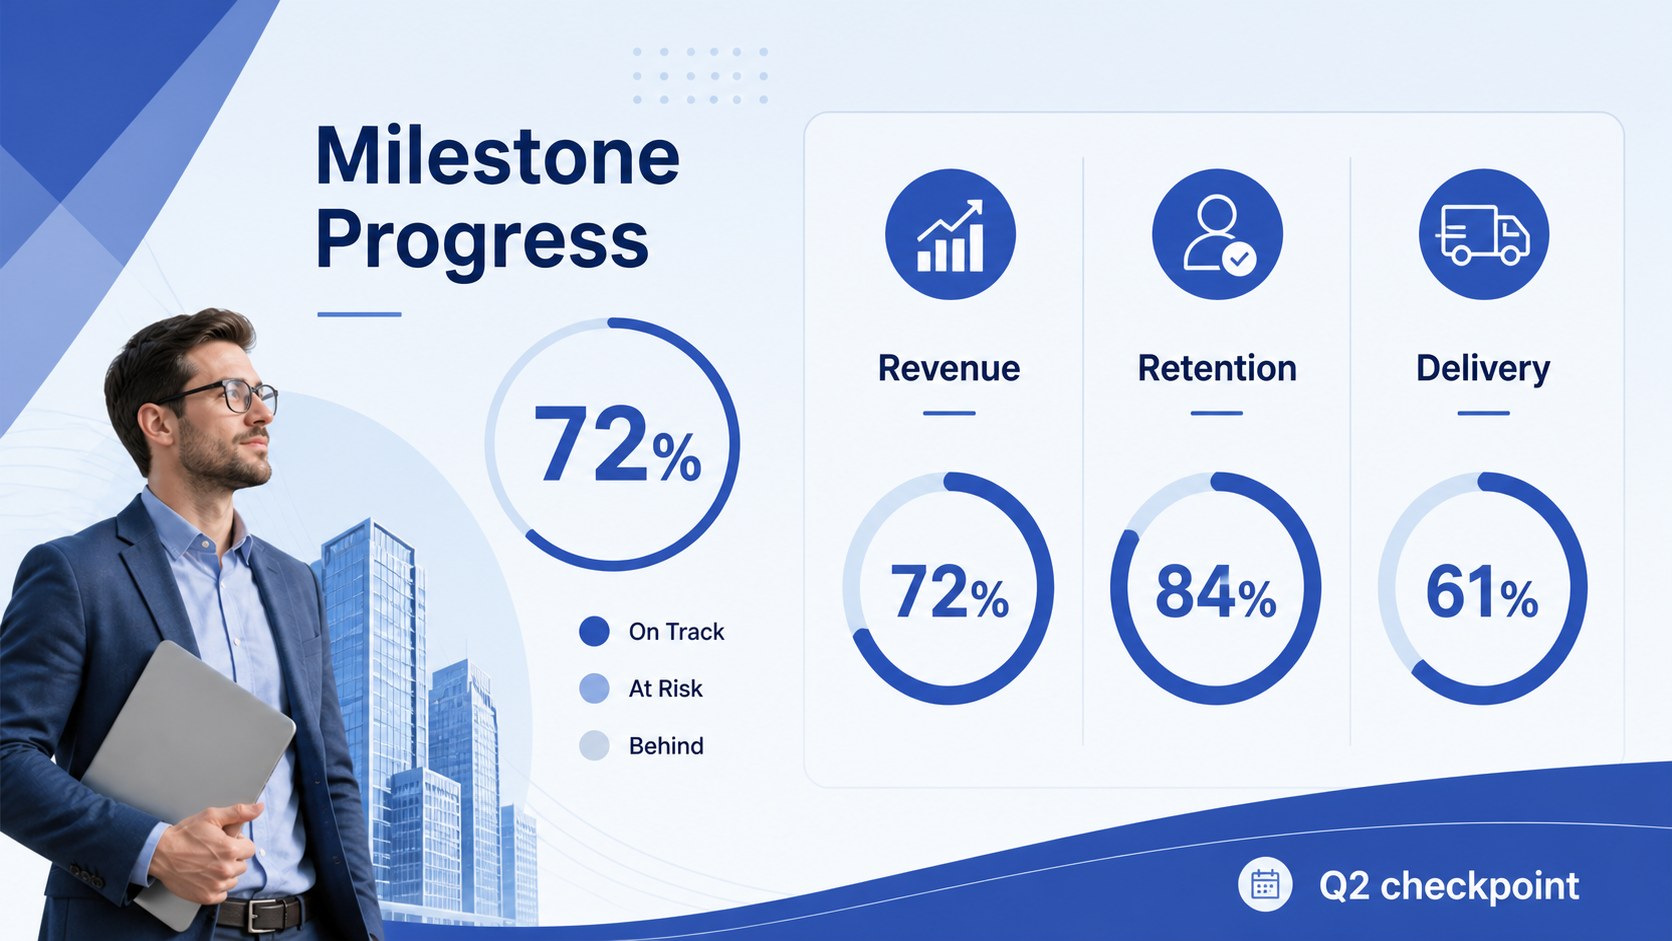
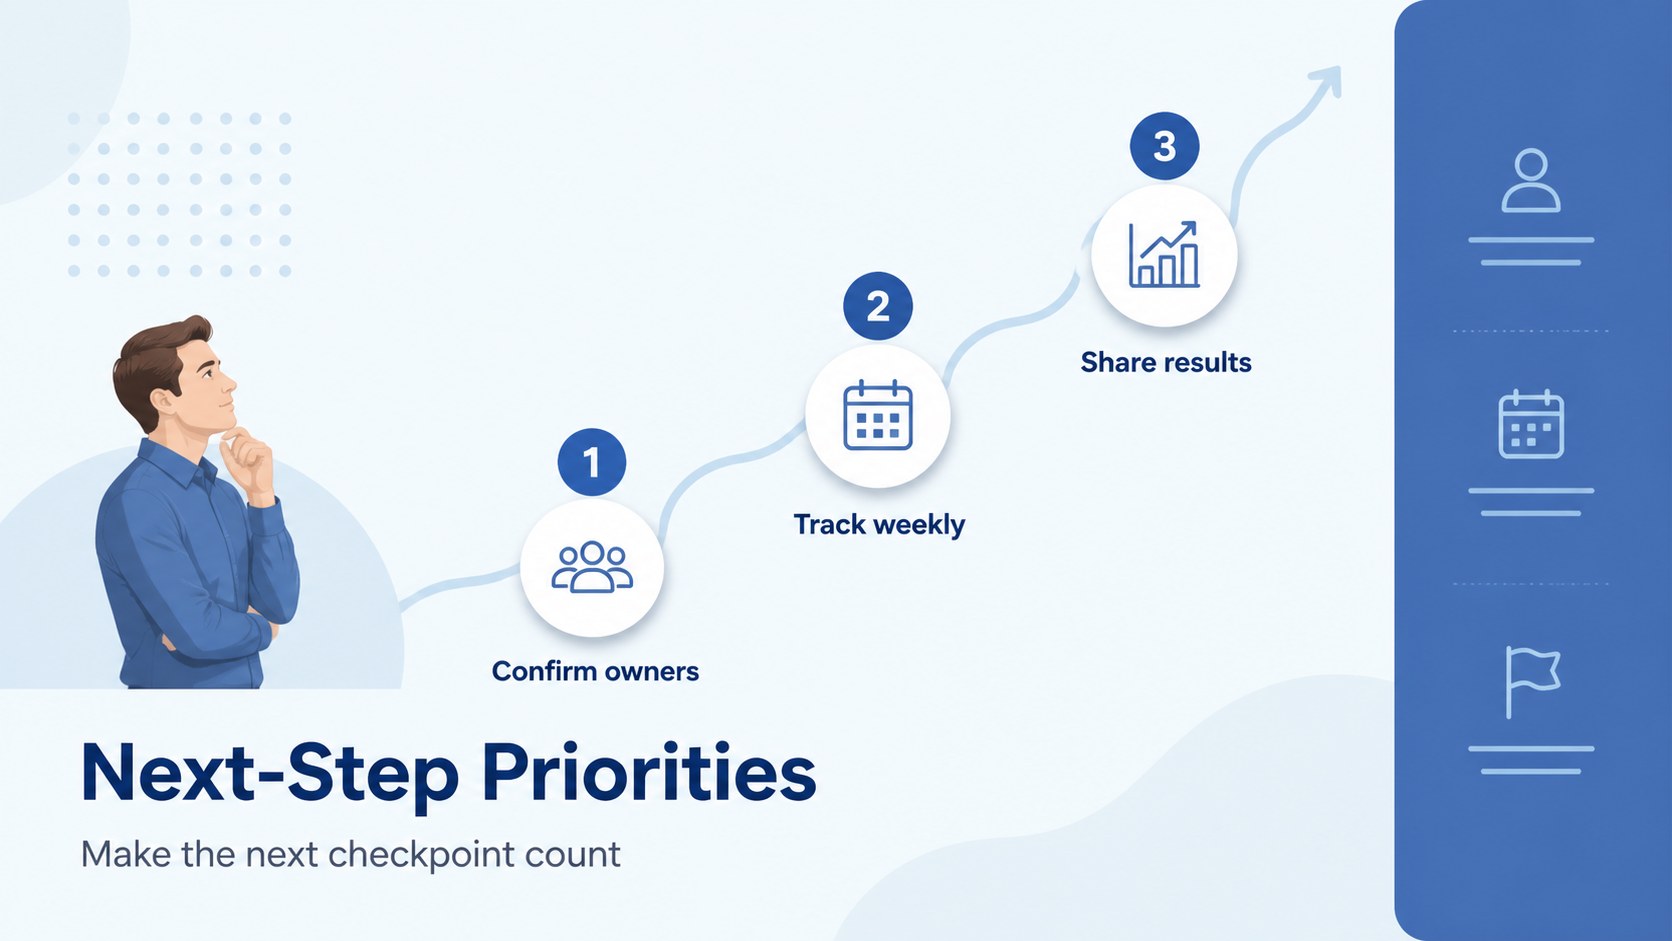
Inside, you’ll find five editable 16:9 slides for presenting north star objectives, milestone status, performance indicators, timeline checkpoints, and next-step priorities. Charts, labels, icons, lines, and text blocks can be adjusted to match your data, reporting cycle, or brand guidelines. The layouts work well for executive updates, department planning, client briefings, and startup strategy sessions.
This presentation theme is designed for business professionals, project leads, operations teams, consultants, and founders who need an efficient way to explain company direction. Edit the files in PowerPoint or Google Slides, change the figures and labels, and adapt the visual hierarchy for monthly, quarterly, or annual planning. The restrained blue palette keeps the deck polished while leaving room for your own metrics and messaging.
Perfect for: quarterly leadership review; startup strategy meeting; department planning session; client progress briefing; project milestone update.
Frequently asked questions
Can I edit the presentation in PowerPoint? Yes. The template is designed for PowerPoint editing, including text, colors, charts, shapes, and metric labels. Replace the sample figures with your own business data before presenting.
Practical details
Yes. The template is designed for PowerPoint editing, including text, colors, charts, shapes, and metric labels. Replace the sample figures with your own business data before presenting.
Yes, you can open and edit the presentation in Google Slides. Check imported fonts, spacing, and chart alignment after uploading, then make any small layout adjustments needed.
Yes. Update the main blue tones to match your organization’s visual identity while keeping the hierarchy of headings, metrics, and milestone markers intact. You can also change backgrounds and accent colors for different reporting periods.
The layouts suit objectives, KPIs, project checkpoints, timeline updates, and next-quarter priorities. They can support executive summaries, team planning, client reporting, or a concise strategy presentation.
Keep exploring
15Shape your publishing concept with an indie magazine startup pitch deck featuring pastel gradients, bold collage layouts, and editable planning slides.
 16
16Build clear project stories with the Icon Grid Teamwork Theme, a flexible blue illustrated deck for proposals, strategy updates, and team meetings.
 3
3Turn priorities into an actionable plan with an annual goals roadmap infographic, featuring editable orange and teal layouts for PowerPoint and Google Slides.
 15
15Create an Annual Achievement Report Presentation with colorful geometric layouts for milestones, results, lessons, and priorities in PowerPoint or Google Slides.
 15
15Turn results into a focused annual performance evaluation report with dark 3D slides for KPIs, achievements, feedback, and next-step goals for teams.
 15
15Guide a focused annual recap with Business Results Retrospective Slides, a muted brown-and-blue template for PowerPoint and Google Slides.
 6
6Turn complex plans into clear visual stories with Color-Coded Workflow Path Slides, an editable set for project updates, roadmaps, and team briefings.
 6
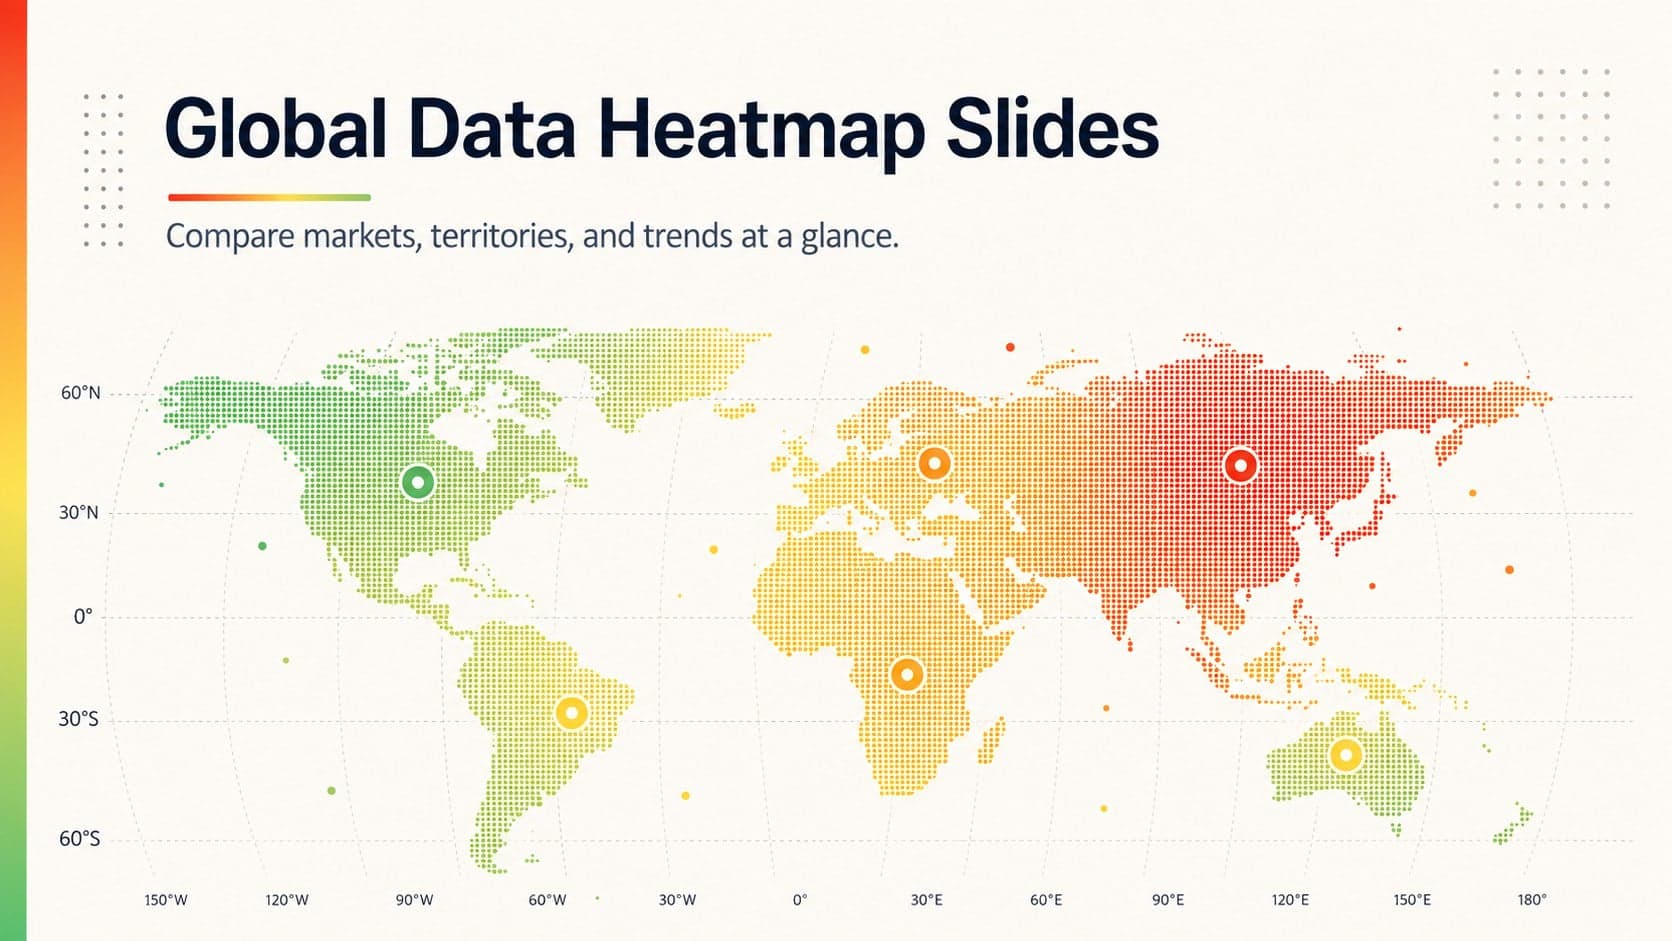
6Compare regional performance at a glance with Global Data Heatmap Slides, a clean multicolor deck designed for editable PowerPoint and Google Slides.