
 15
15presentation
Indie Magazine Startup Pitch Deck
Shape your publishing concept with an indie magazine startup pitch deck featuring pastel gradients, bold collage layouts, and editable planning slides.
Google SlidesPowerPoint
presentation · English
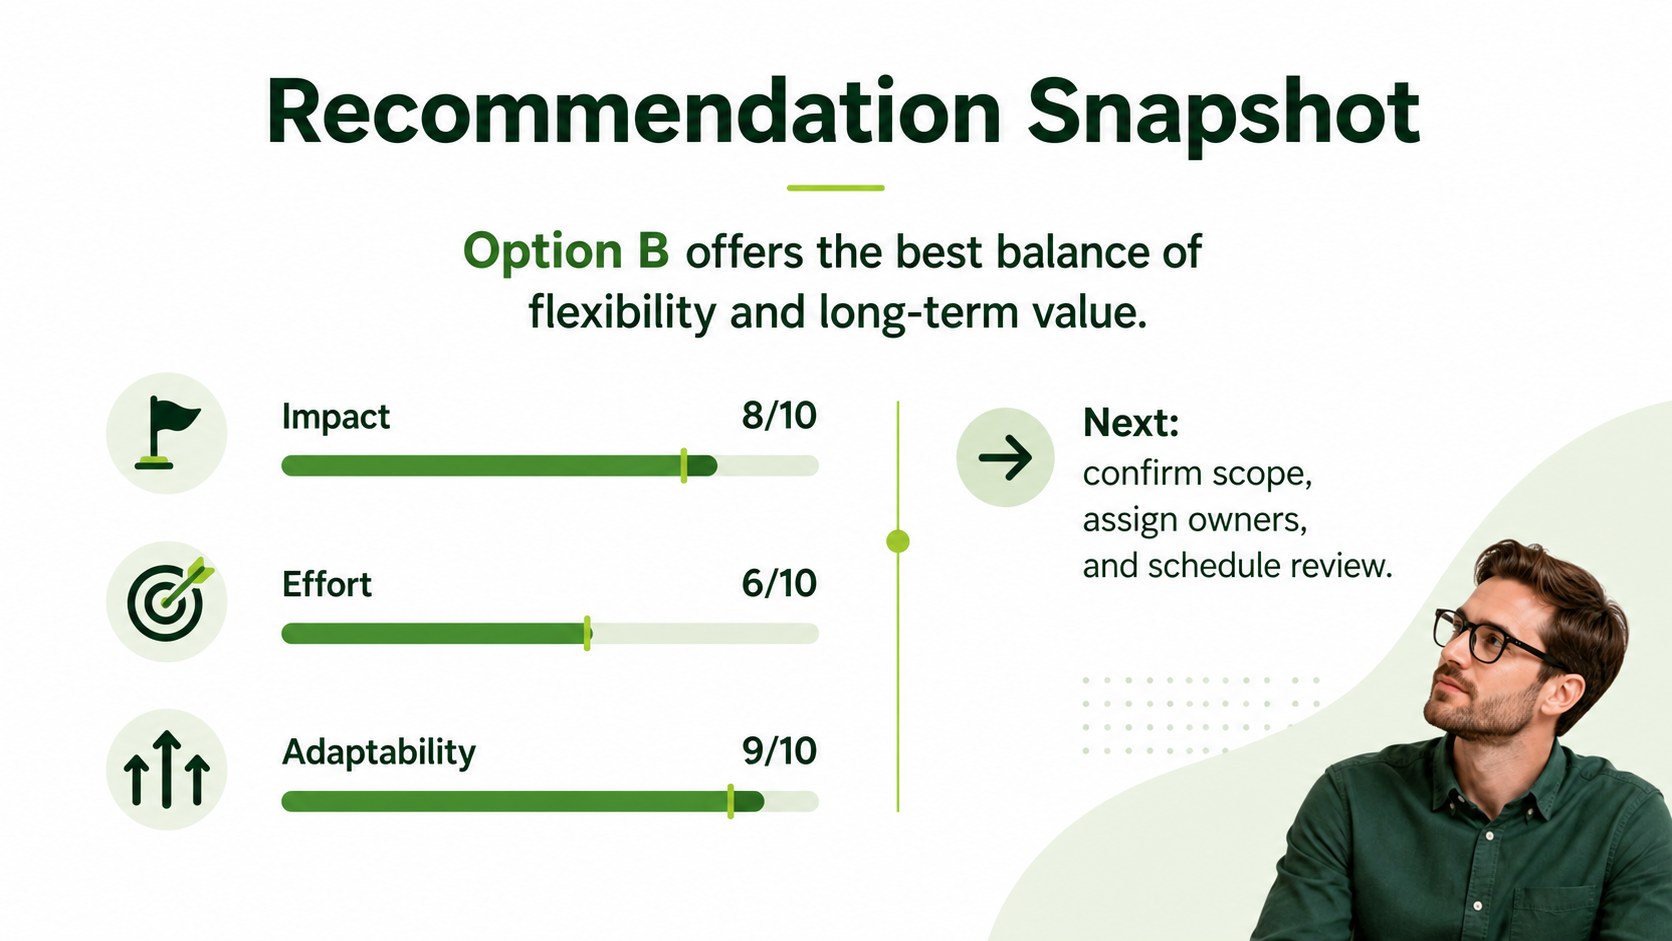
Build clear choices with a side-by-side infographic deck in a clean green style, editable for business and teaching in PowerPoint or Google Slides.
Design notes
Make differences easier to recognize with a side-by-side infographic deck designed for concise, structured communication. The fresh green palette, generous spacing, and simple geometric accents create a calm professional look without distracting from your message. Use it to compare products, strategies, processes, proposals, or learning concepts in a format audiences can scan quickly.
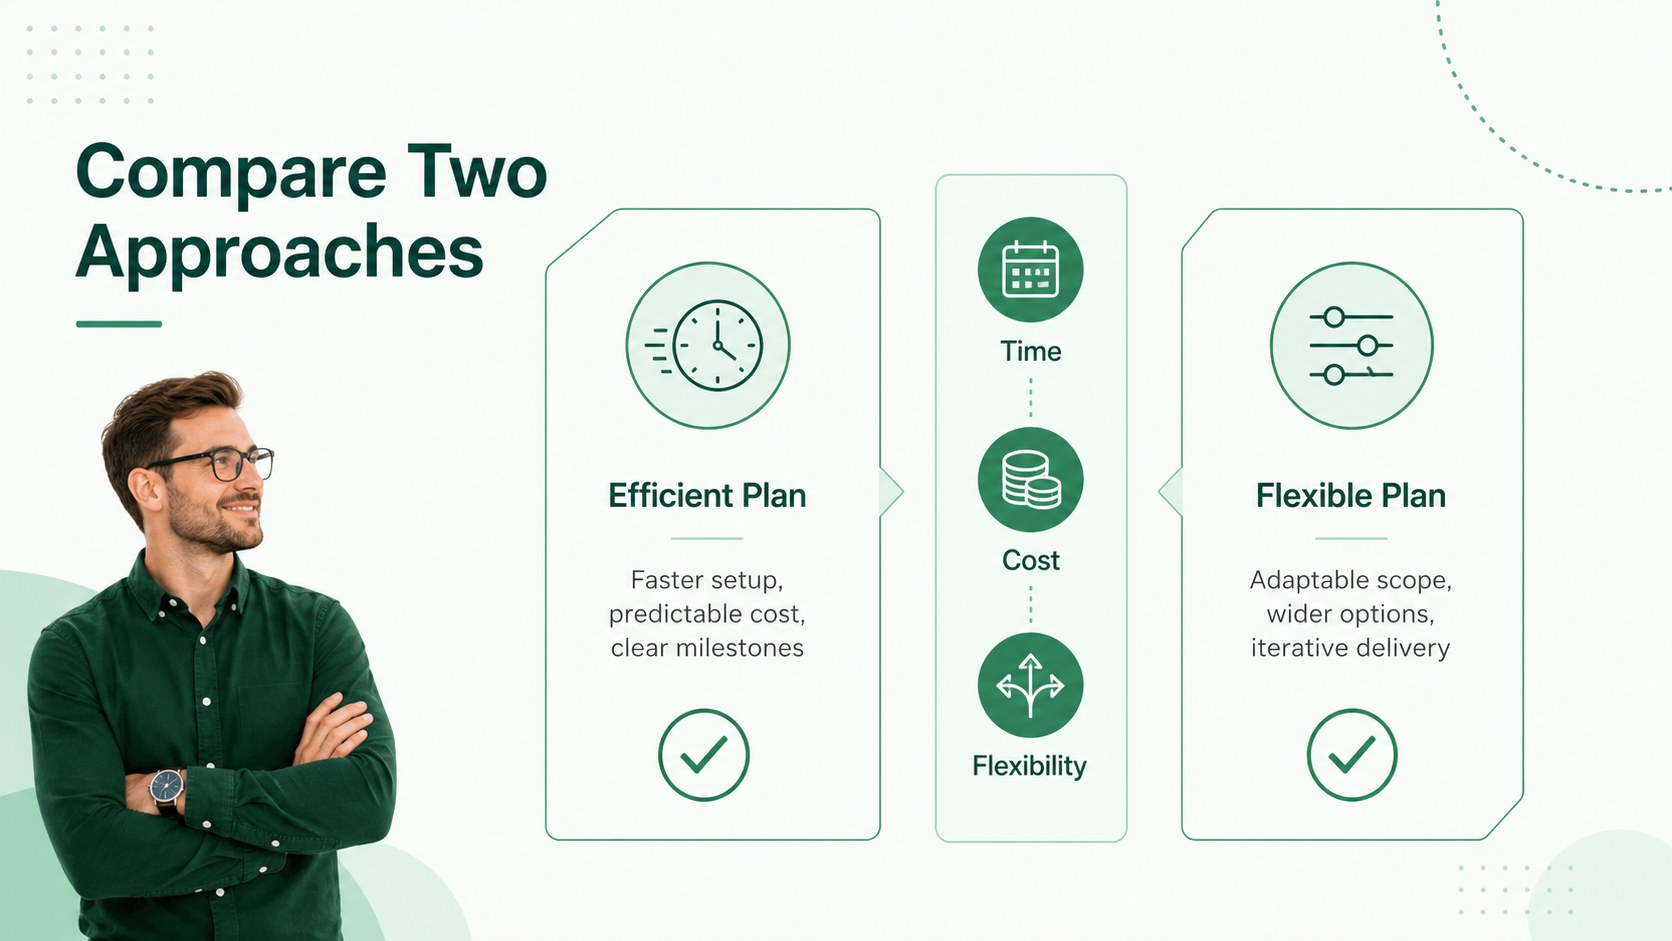
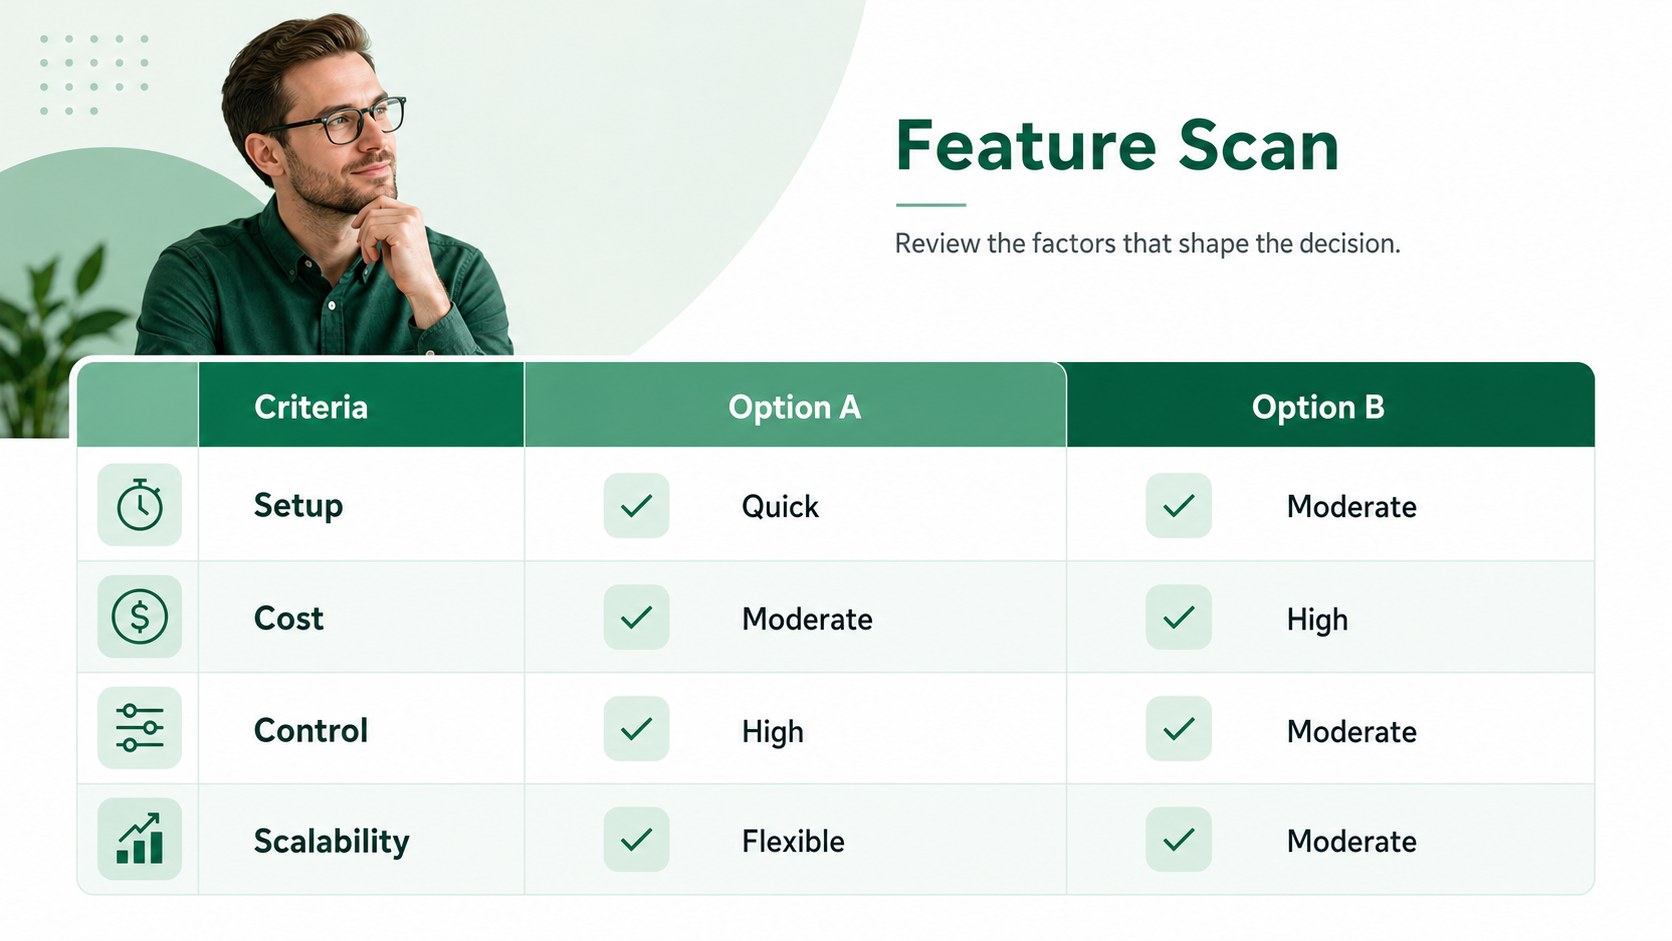
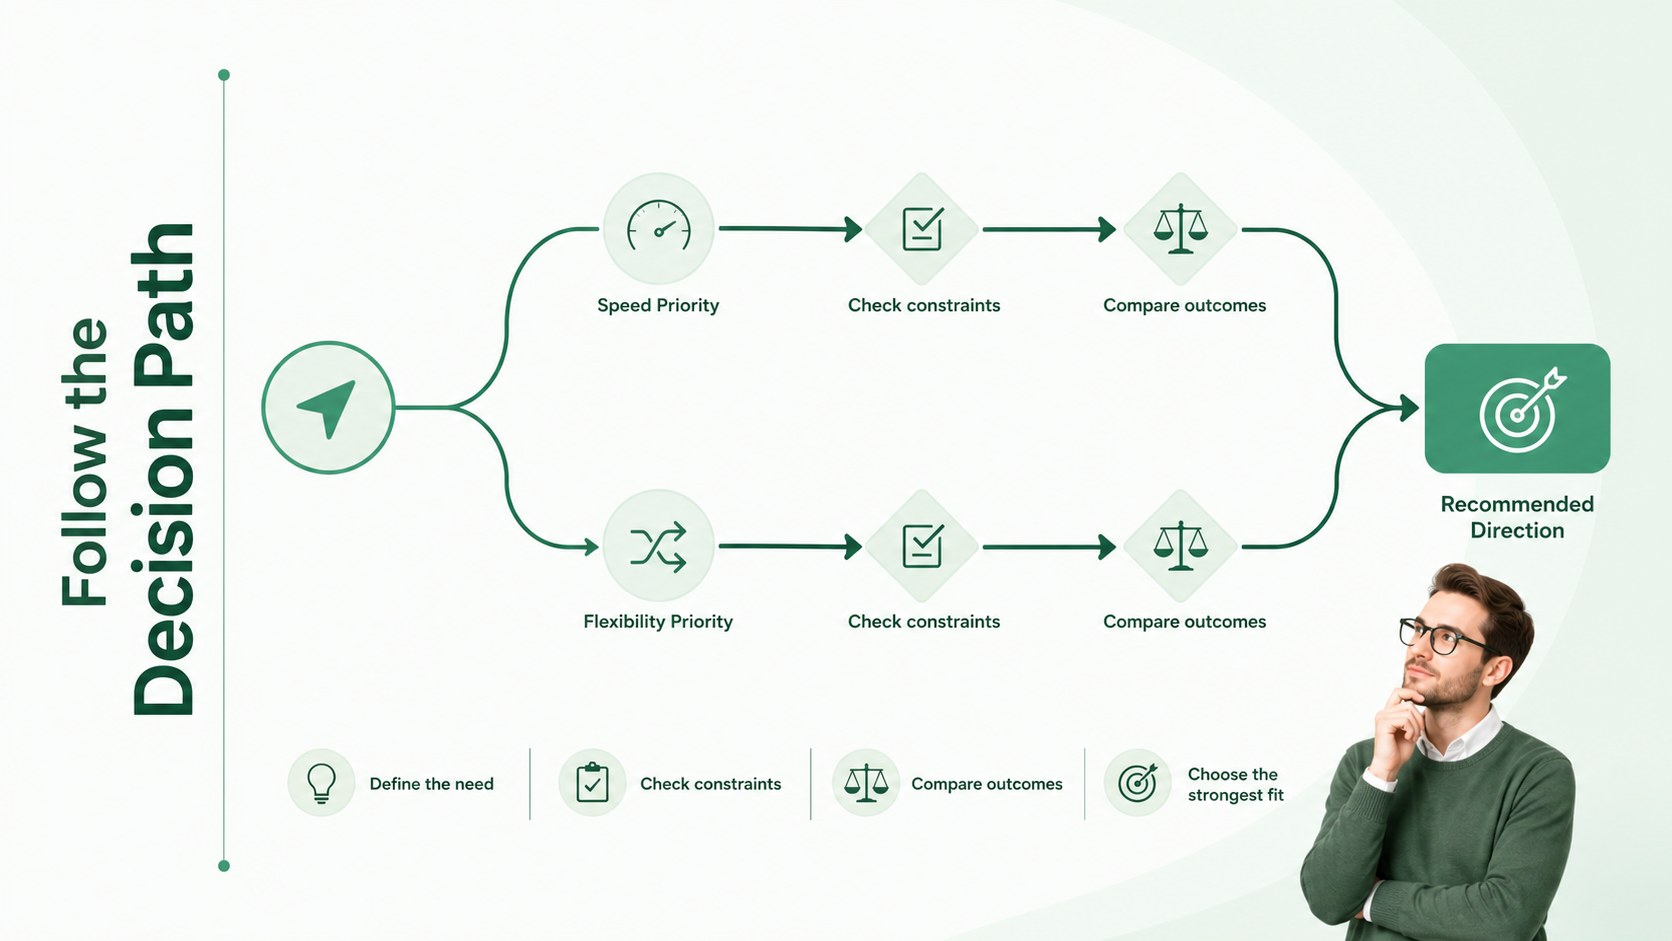
The five-slide set includes a distinctive title page, a two-option overview, a feature comparison matrix, a branching decision path, and a recommendation summary. Together, these layouts work as a minimal green comparison presentation for both short briefings and detailed reviews. Add your own criteria, icons, labels, scores, and conclusions to build a two option decision layout that reflects the needs of your project. Every element can be adjusted in PowerPoint and Google Slides, including colors, typography, shapes, and data points.
This template is useful for project managers evaluating solutions, sales teams presenting packages, educators contrasting topics, and consultants explaining tradeoffs. It also functions as a business choice evaluation template for stakeholder meetings, planning workshops, and client recommendations. Whether you are comparing two approaches or summarizing a final decision, the consistent visual system keeps complex information clear and presentation-ready.
Perfect for: product feature comparison; vendor selection meeting; classroom concept review; strategy option evaluation; before and after analysis.
Frequently asked questions
Can I edit every part of the infographic? Yes. You can change the text, colors, icons, shapes, labels, and comparison criteria to match your subject and visual identity.
Practical details
Yes. You can change the text, colors, icons, shapes, labels, and comparison criteria to match your subject and visual identity.
The deck is designed for PowerPoint and Google Slides. Layouts remain in a standard 16:9 format on both platforms.
Yes. Duplicate existing rows, columns, or content groups and replace their labels with your own criteria. Keep spacing consistent so the comparison remains easy to scan.
Yes. Educators, students, nonprofit teams, and researchers can adapt the layouts for concept comparisons, historical contrasts, program reviews, and study summaries.
Keep exploring
15Shape your publishing concept with an indie magazine startup pitch deck featuring pastel gradients, bold collage layouts, and editable planning slides.
 16
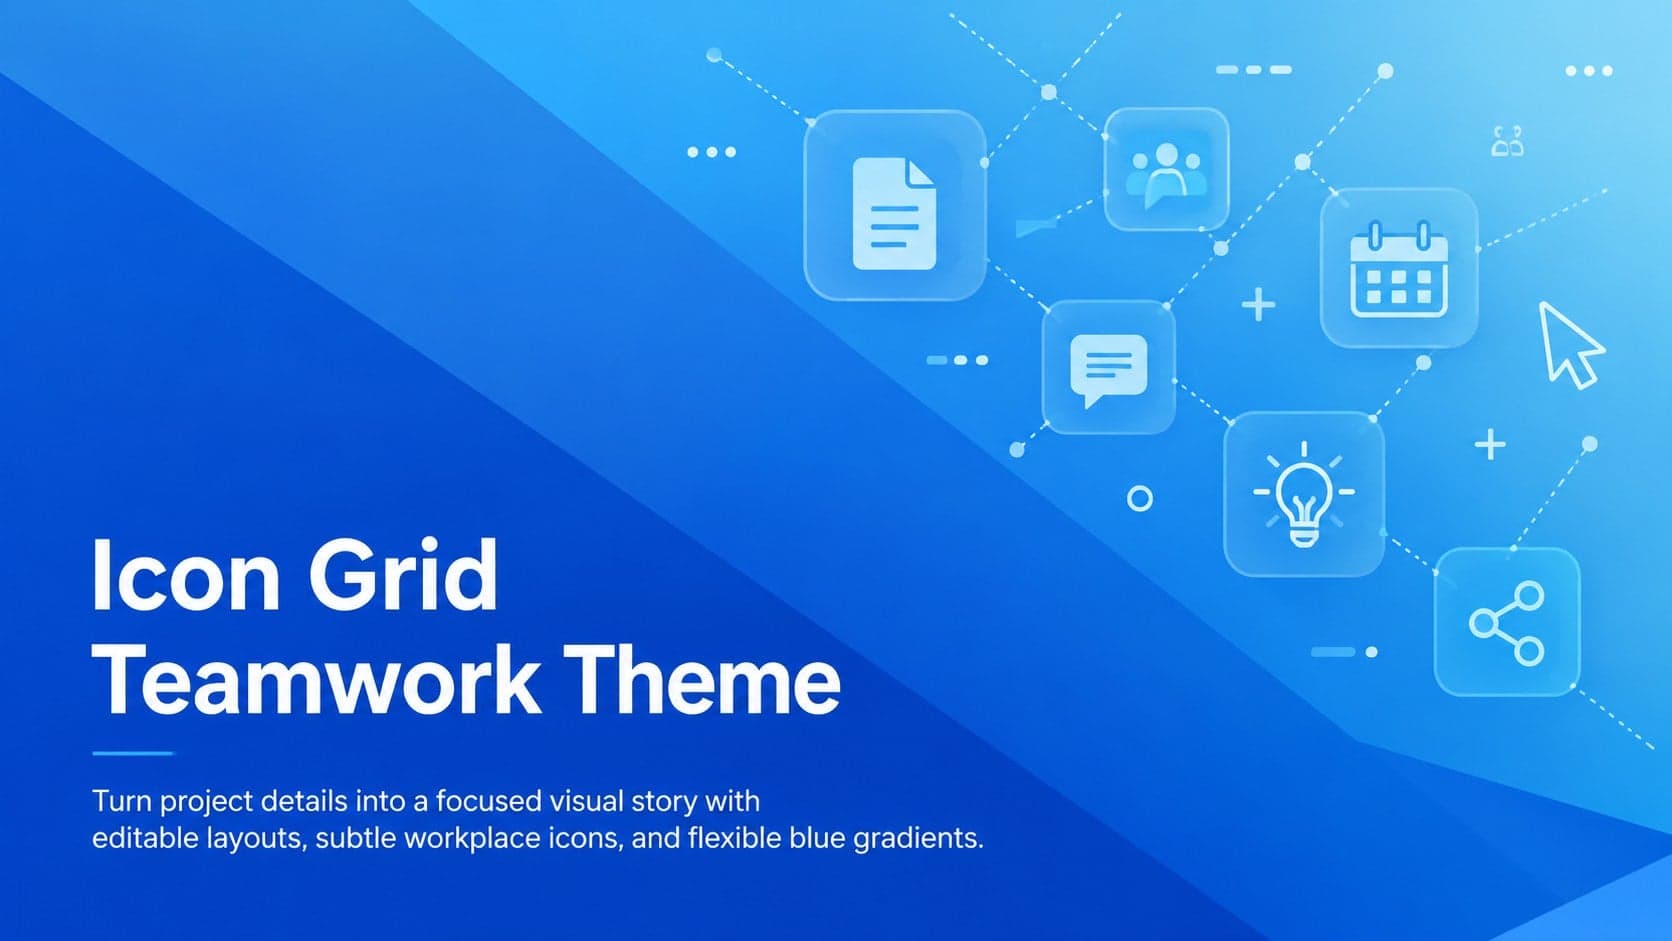
16Build clear project stories with the Icon Grid Teamwork Theme, a flexible blue illustrated deck for proposals, strategy updates, and team meetings.
 3
3Turn priorities into an actionable plan with an annual goals roadmap infographic, featuring editable orange and teal layouts for PowerPoint and Google Slides.
 15
15Create an Annual Achievement Report Presentation with colorful geometric layouts for milestones, results, lessons, and priorities in PowerPoint or Google Slides.
 15
15Turn results into a focused annual performance evaluation report with dark 3D slides for KPIs, achievements, feedback, and next-step goals for teams.
 15
15Guide a focused annual recap with Business Results Retrospective Slides, a muted brown-and-blue template for PowerPoint and Google Slides.
 6
6Turn complex plans into clear visual stories with Color-Coded Workflow Path Slides, an editable set for project updates, roadmaps, and team briefings.
 6
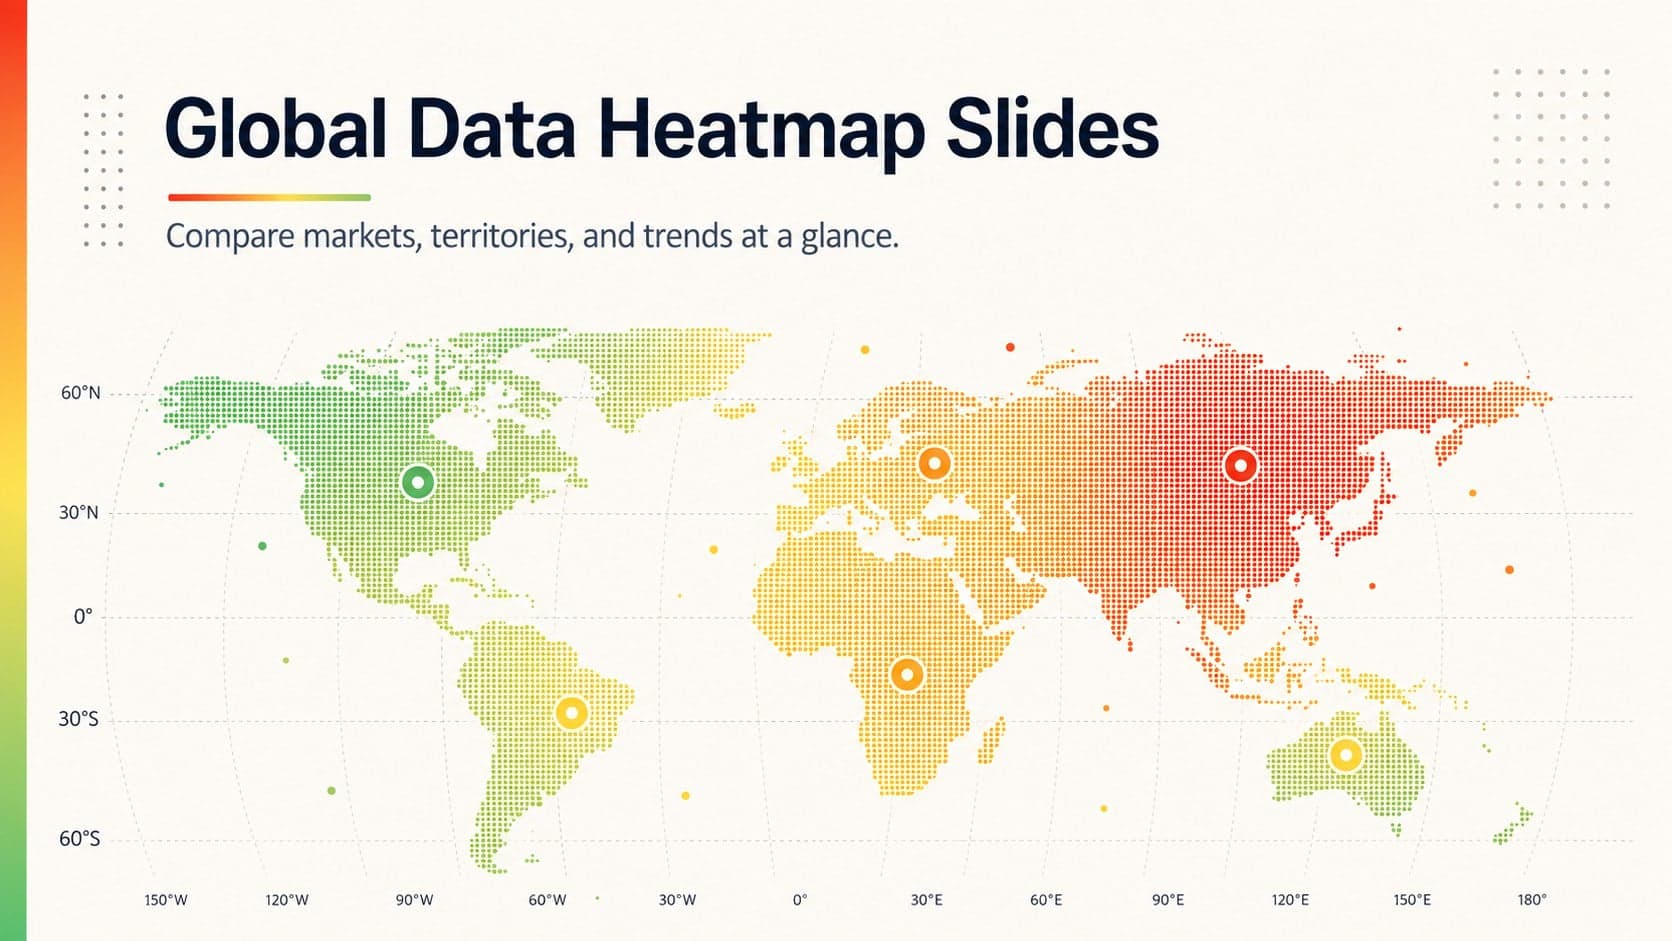
6Compare regional performance at a glance with Global Data Heatmap Slides, a clean multicolor deck designed for editable PowerPoint and Google Slides.