
 15
presentation
Indie Magazine Startup Pitch Deck
Shape your publishing concept with an indie magazine startup pitch deck featuring pastel gradients, bold collage layouts, and editable planning slides.
Google SlidesPowerPoint
presentation · English
Turn complex problems into clear discussions with Root Cause Mapping Fishbone Slides, an editable blue deck for PowerPoint and Google Slides teams.
Design notes
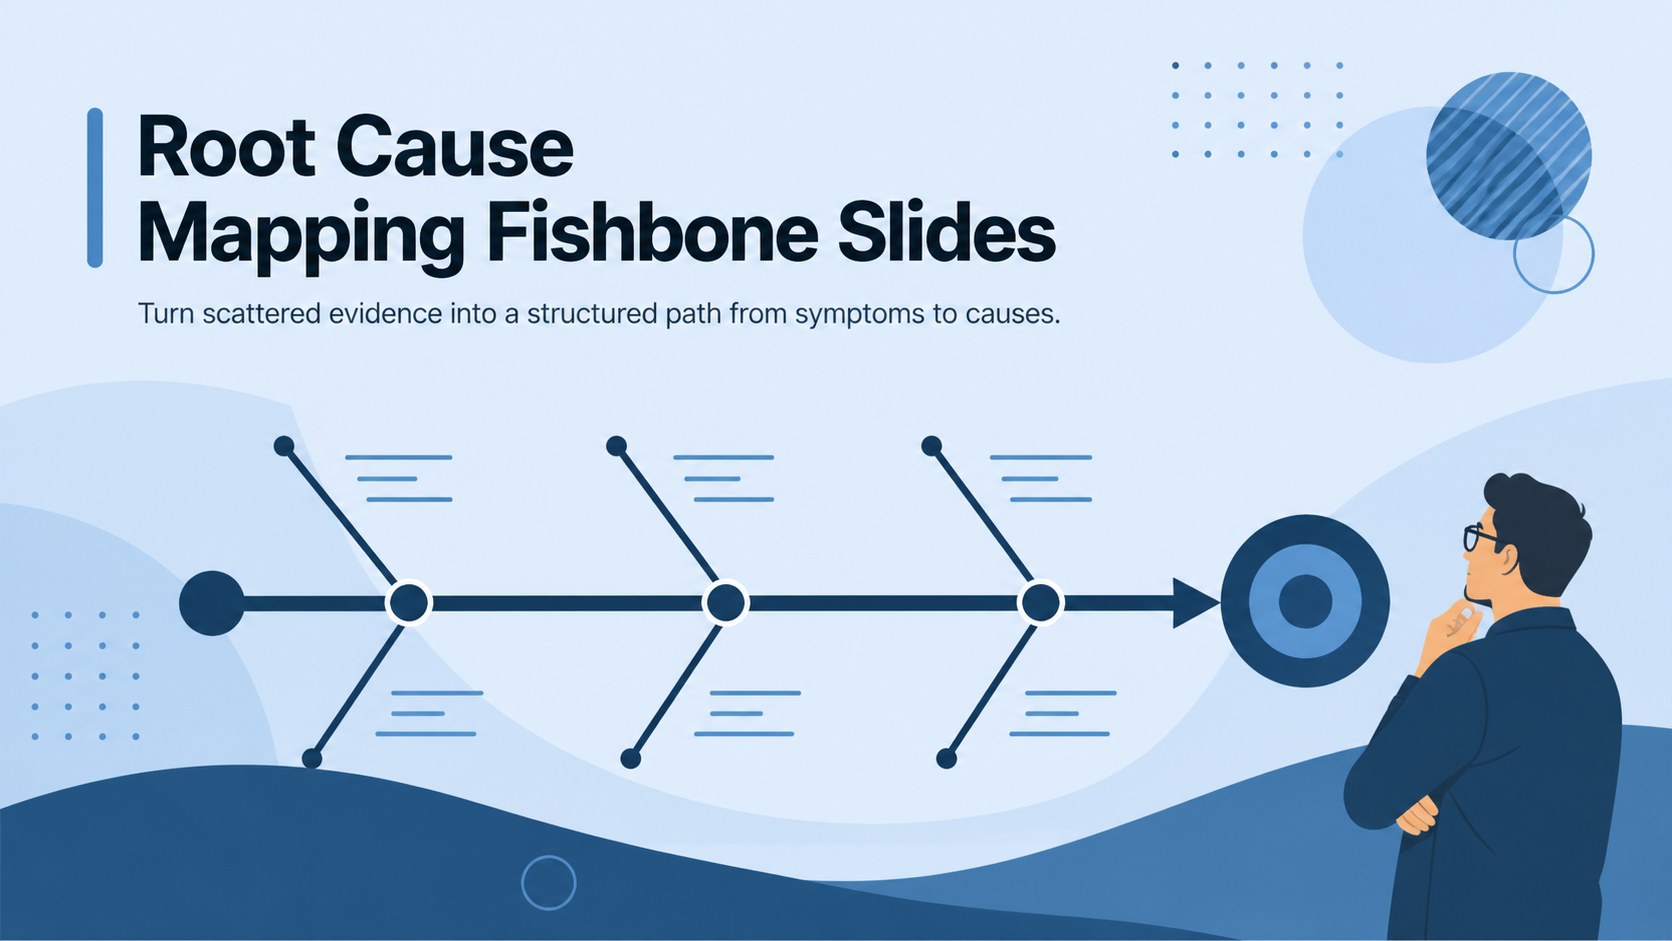
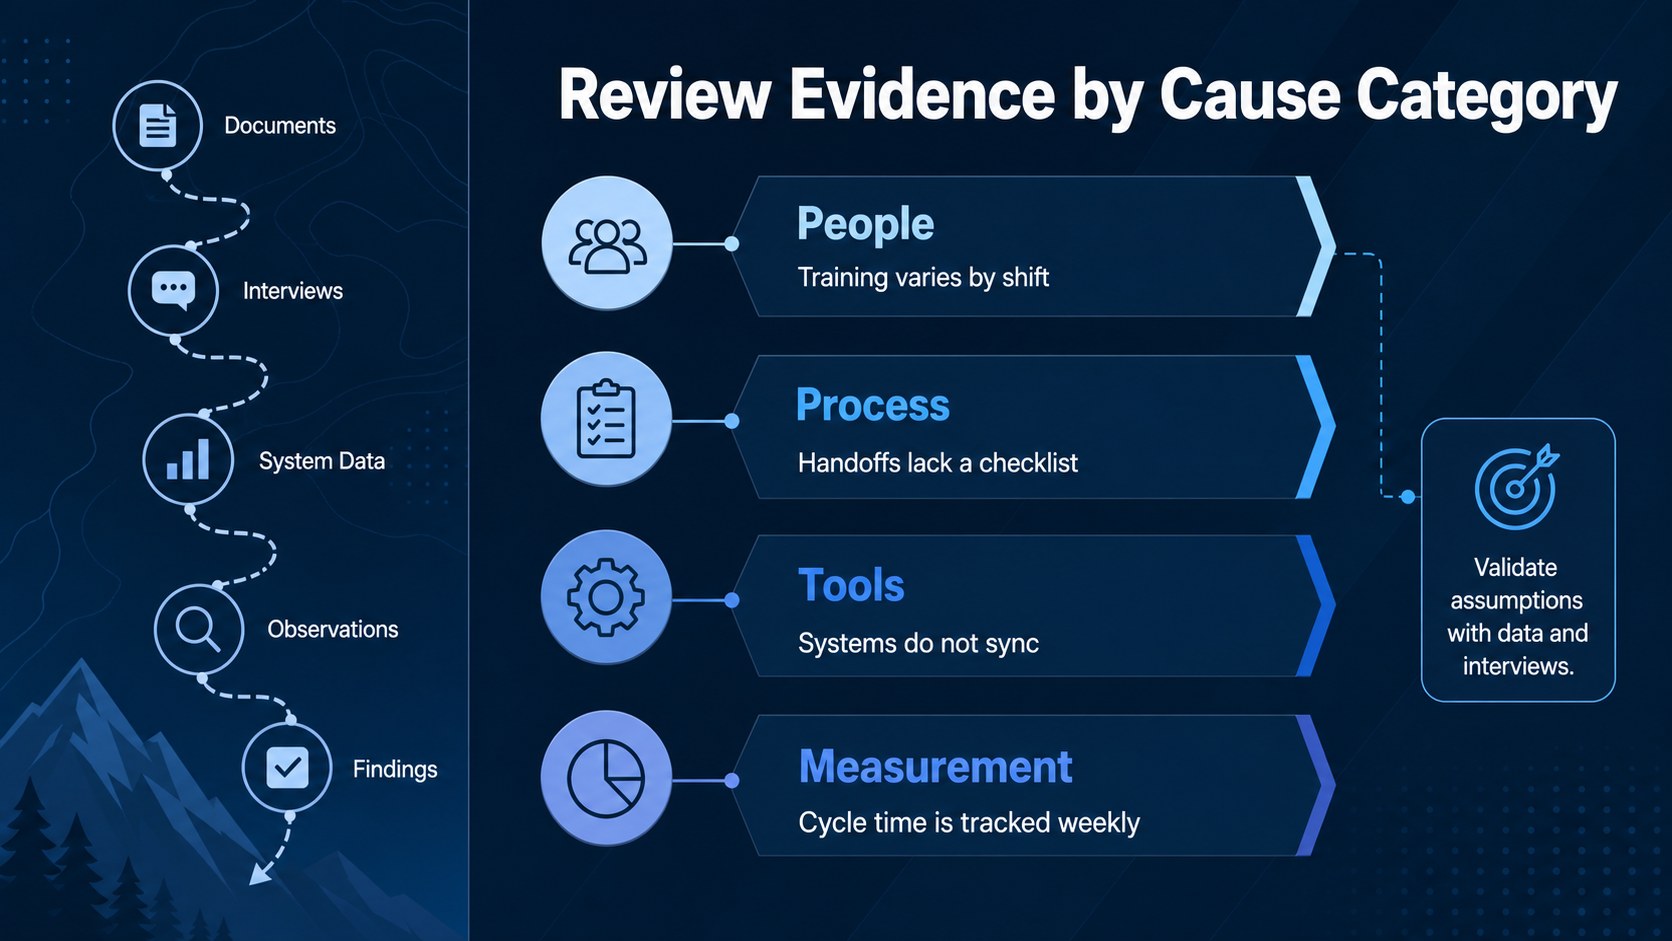
Root Cause Mapping Fishbone Slides give teams a clear visual framework for moving from a visible problem to the factors behind it. The fresh blue palette, restrained gradients, and simple illustrations create a professional setting for discussion without making detailed information feel overwhelming. Use the layouts to organize evidence, compare contributing conditions, and guide stakeholders toward informed action.
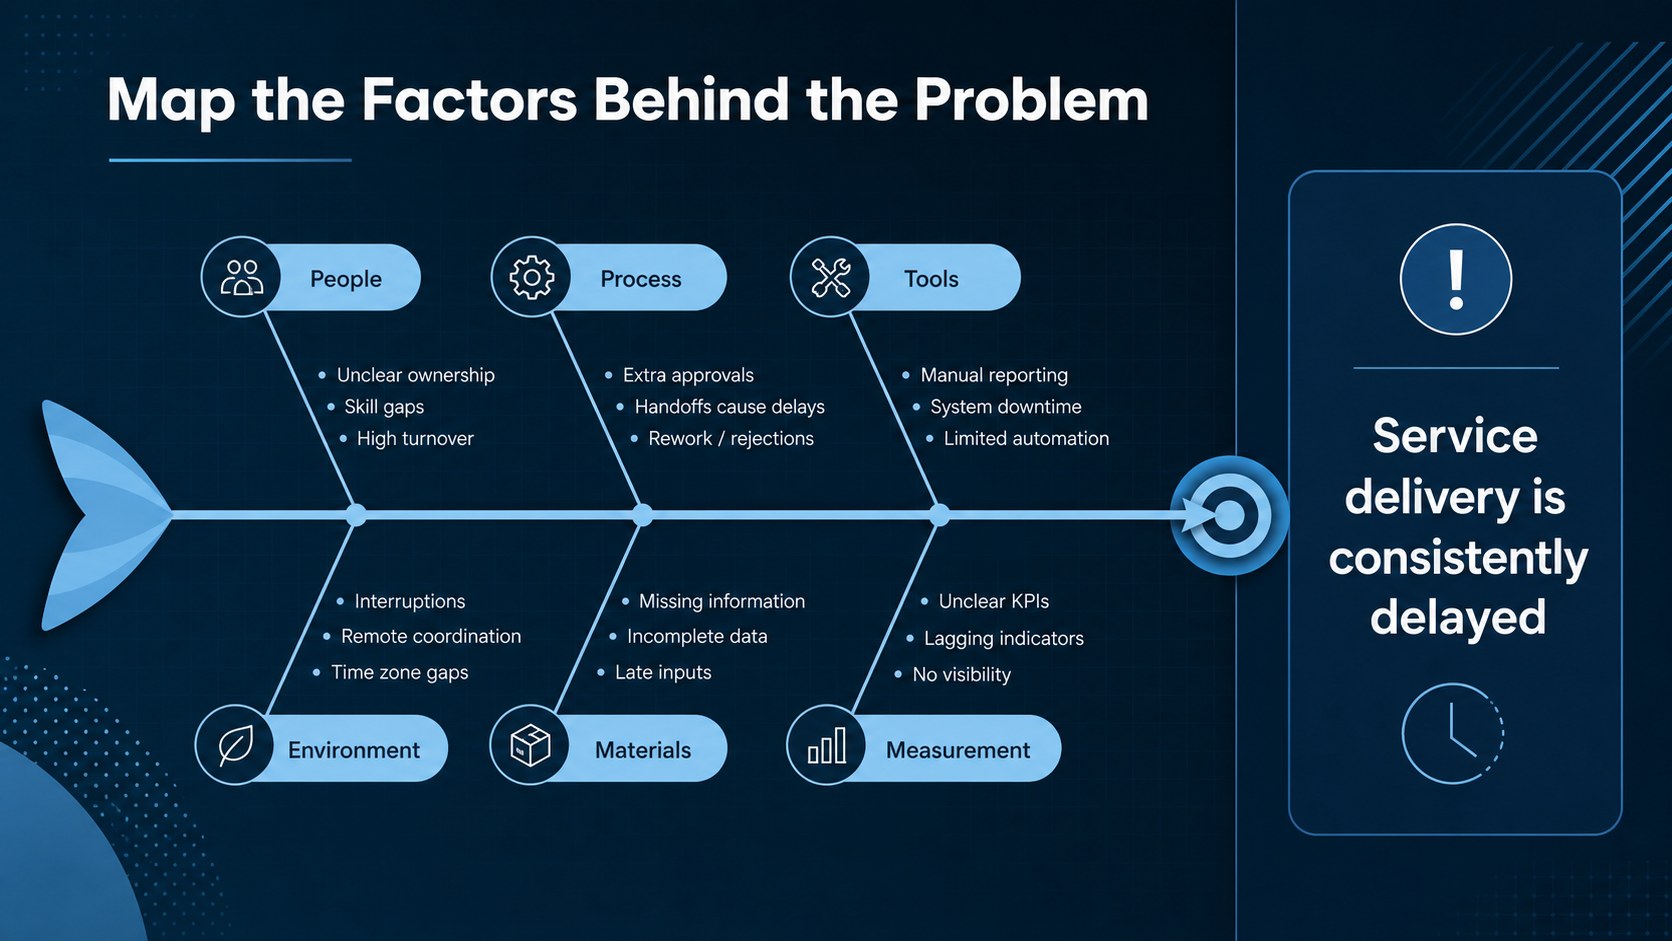
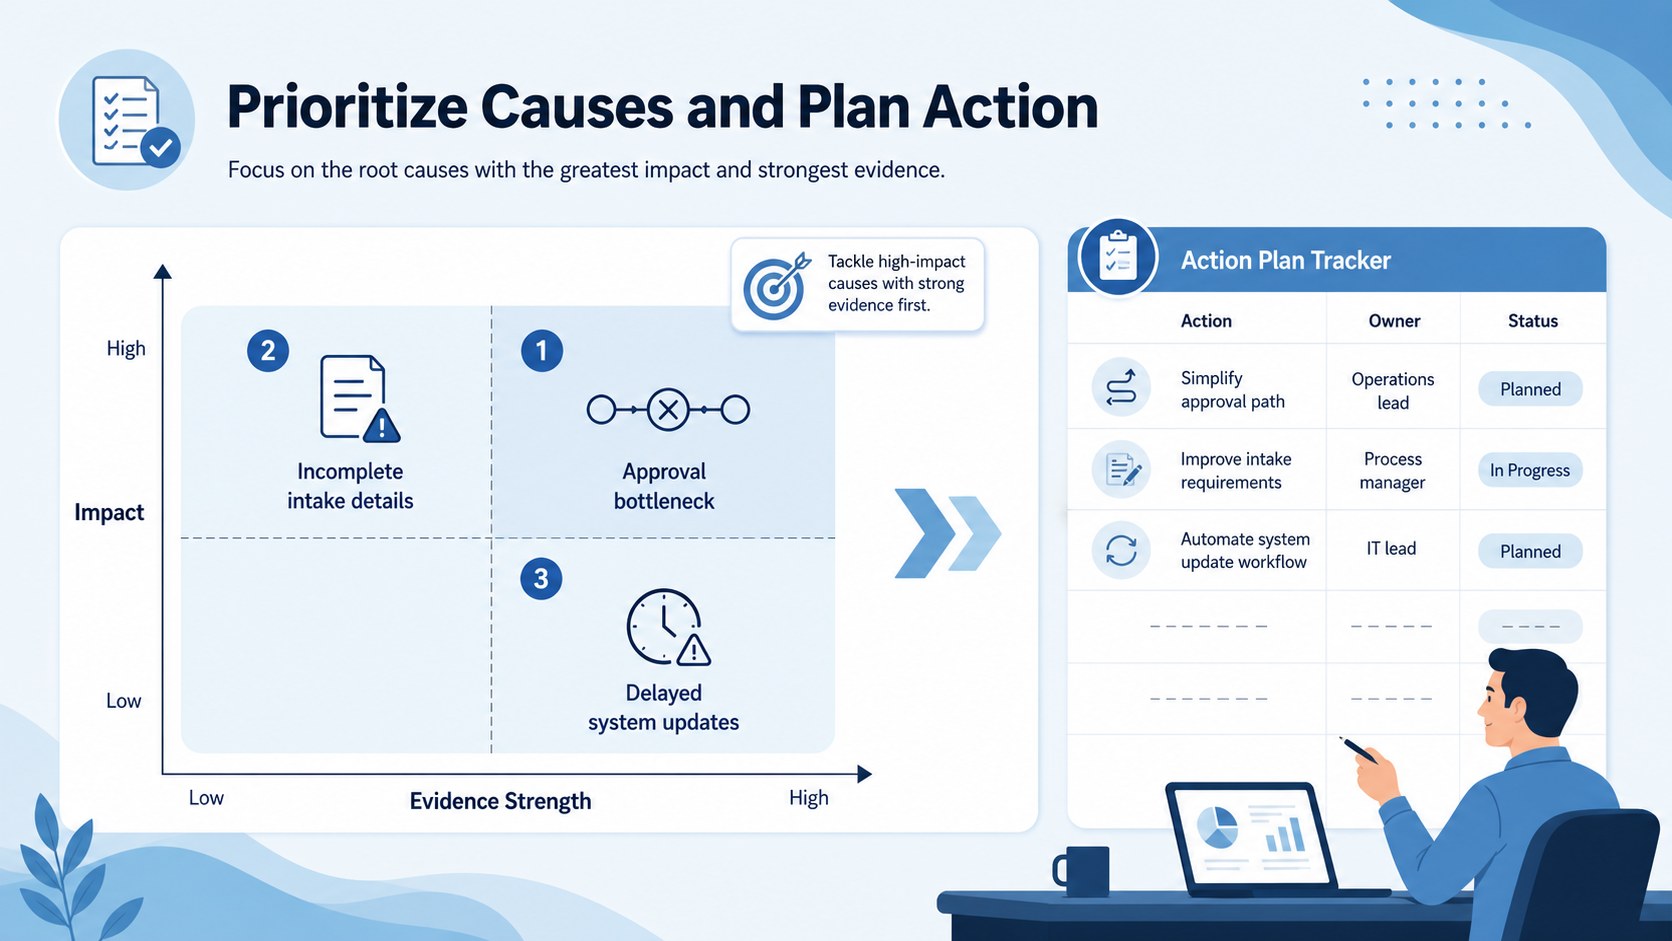
Inside are four coordinated 16:9 layouts: a polished cover, an editable fishbone diagram, a cause-category analysis page, and an action-planning summary. The deck works as a fishbone diagram presentation for teams that need to sort findings across people, process, tools, environment, materials, or measurement. Text boxes, labels, colors, and diagram elements can be adjusted in PowerPoint or Google Slides to match the scope of any investigation.
This cause and effect analysis slide deck is suited to project managers, operations leaders, quality teams, consultants, educators, and business analysts. Apply it to production delays, service complaints, workflow bottlenecks, safety reviews, or classroom problem-solving exercises. It also supports an Ishikawa diagram for business meetings where participants need to capture possible causes before prioritizing solutions. The illustrated visual language keeps workshops approachable, while the structured layouts make conclusions easy to scan, discuss, and share.
Perfect for: production delay investigation; service complaint analysis; workflow bottleneck workshop; quality improvement meeting; project risk review; classroom problem-solving exercise.
Frequently asked questions
Can I edit the fishbone diagram categories? Yes. Rename, remove, or duplicate the category branches to fit your investigation, then replace the sample causes with your own findings. You can also change the colors, type styles, and hierarchy of the labels.
Practical details
Yes. Rename, remove, or duplicate the category branches to fit your investigation, then replace the sample causes with your own findings. You can also change the colors, type styles, and hierarchy of the labels.
Yes. The presentation is designed for editing in both PowerPoint and Google Slides. Minor font or spacing adjustments may be helpful if your device substitutes a typeface.
Yes. Replace the blue accents with your approved palette, apply your preferred fonts, and add internal presentation elements where needed. Diagram shapes and text remain editable for consistent customization.
It can organize possible causes behind operational, service, project, quality, safety, or learning challenges. The category labels are flexible, so the same structure can support both business meetings and classroom activities.
Keep exploring
15Shape your publishing concept with an indie magazine startup pitch deck featuring pastel gradients, bold collage layouts, and editable planning slides.
 16
Build clear project stories with the Icon Grid Teamwork Theme, a flexible blue illustrated deck for proposals, strategy updates, and team meetings.
 3
Turn priorities into an actionable plan with an annual goals roadmap infographic, featuring editable orange and teal layouts for PowerPoint and Google Slides.
 15
Create an Annual Achievement Report Presentation with colorful geometric layouts for milestones, results, lessons, and priorities in PowerPoint or Google Slides.
 15
Turn results into a focused annual performance evaluation report with dark 3D slides for KPIs, achievements, feedback, and next-step goals for teams.
 15
Guide a focused annual recap with Business Results Retrospective Slides, a muted brown-and-blue template for PowerPoint and Google Slides.
 6
Turn complex plans into clear visual stories with Color-Coded Workflow Path Slides, an editable set for project updates, roadmaps, and team briefings.
 6
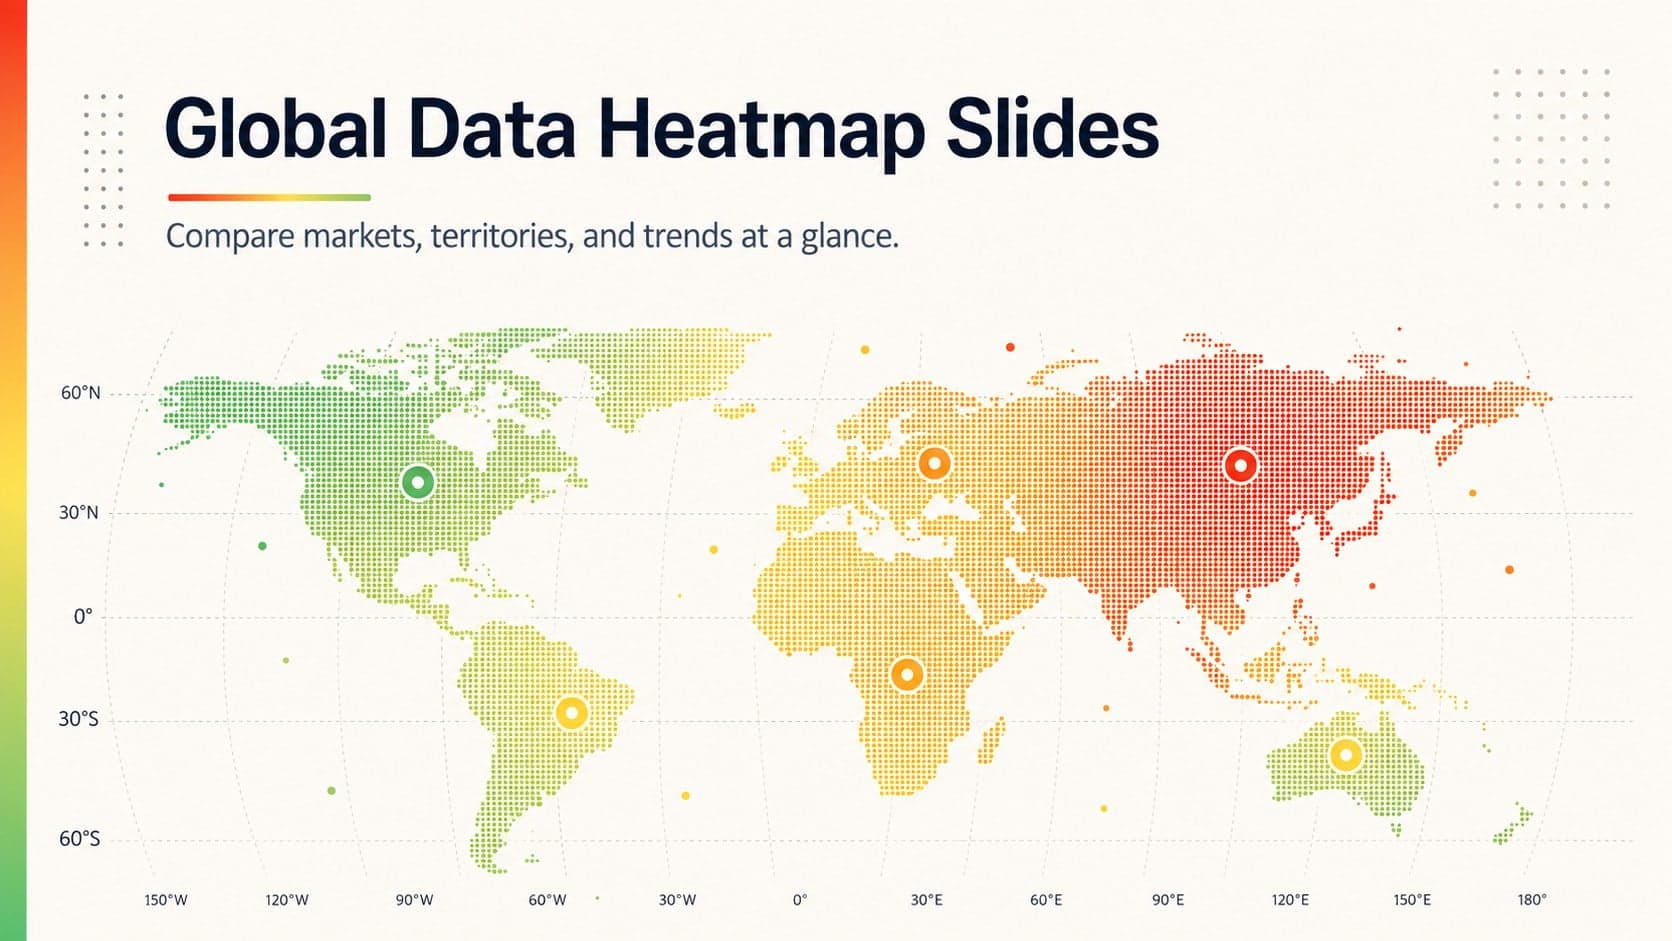
Compare regional performance at a glance with Global Data Heatmap Slides, a clean multicolor deck designed for editable PowerPoint and Google Slides.