
 15
presentation
Indie Magazine Startup Pitch Deck
Shape your publishing concept with an indie magazine startup pitch deck featuring pastel gradients, bold collage layouts, and editable planning slides.
Google SlidesPowerPoint
presentation · English
Turn weekly sales results into clear action with Revenue KPI Dashboard Slides, a red-and-grey collage template for PowerPoint and Google Slides.

Design notes
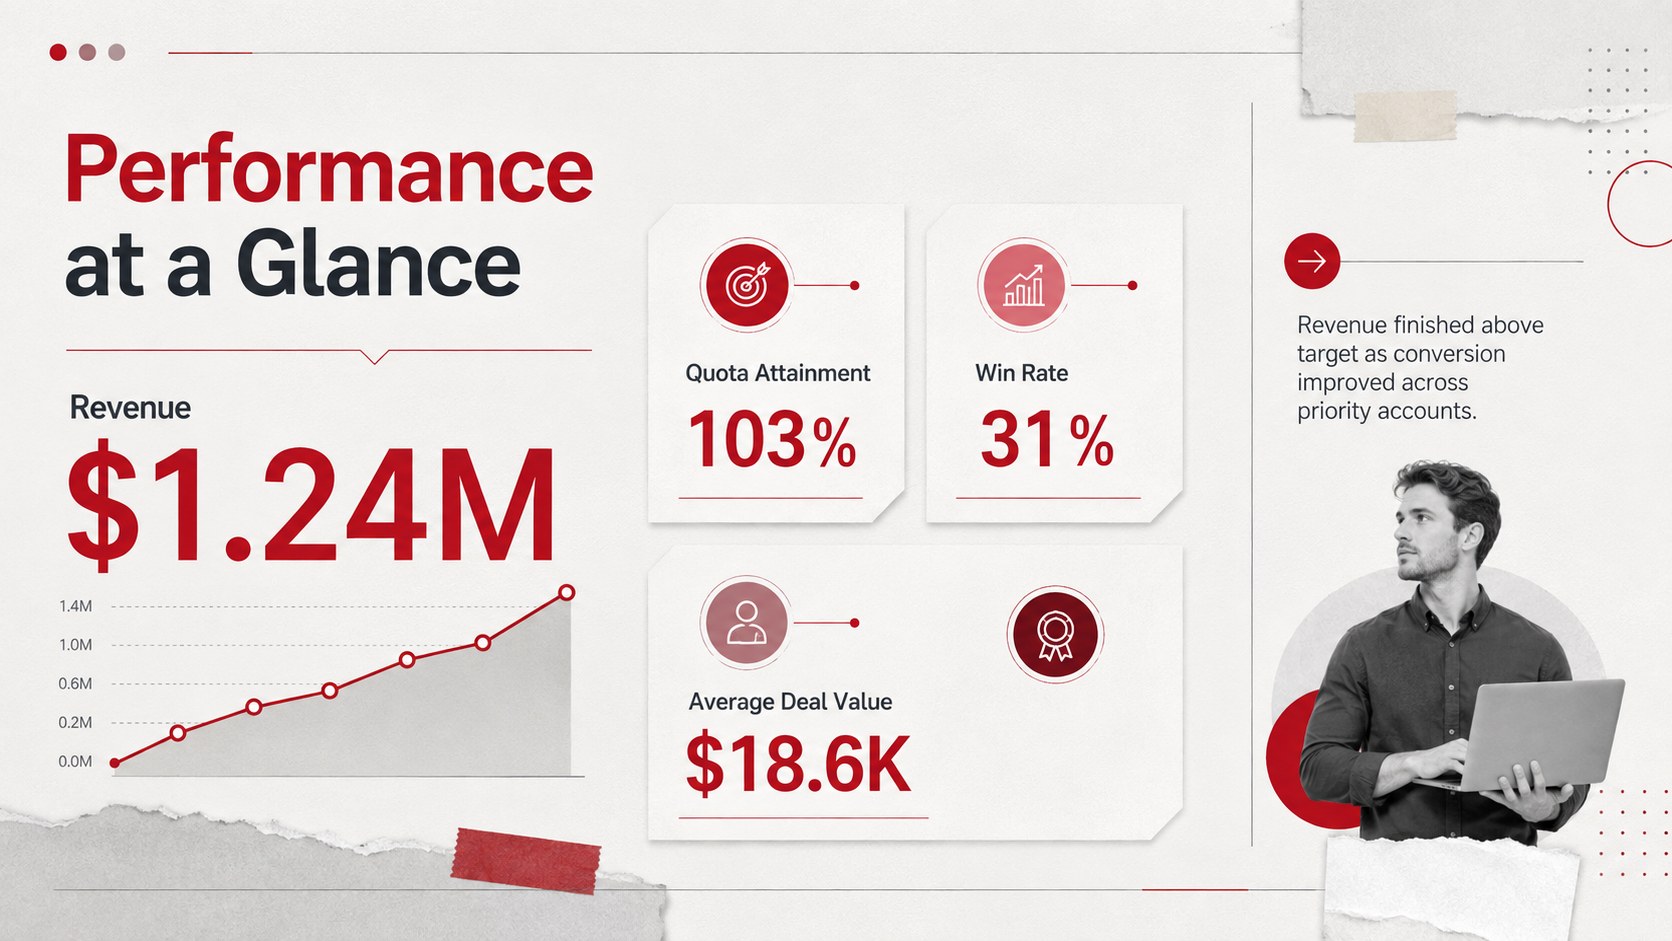
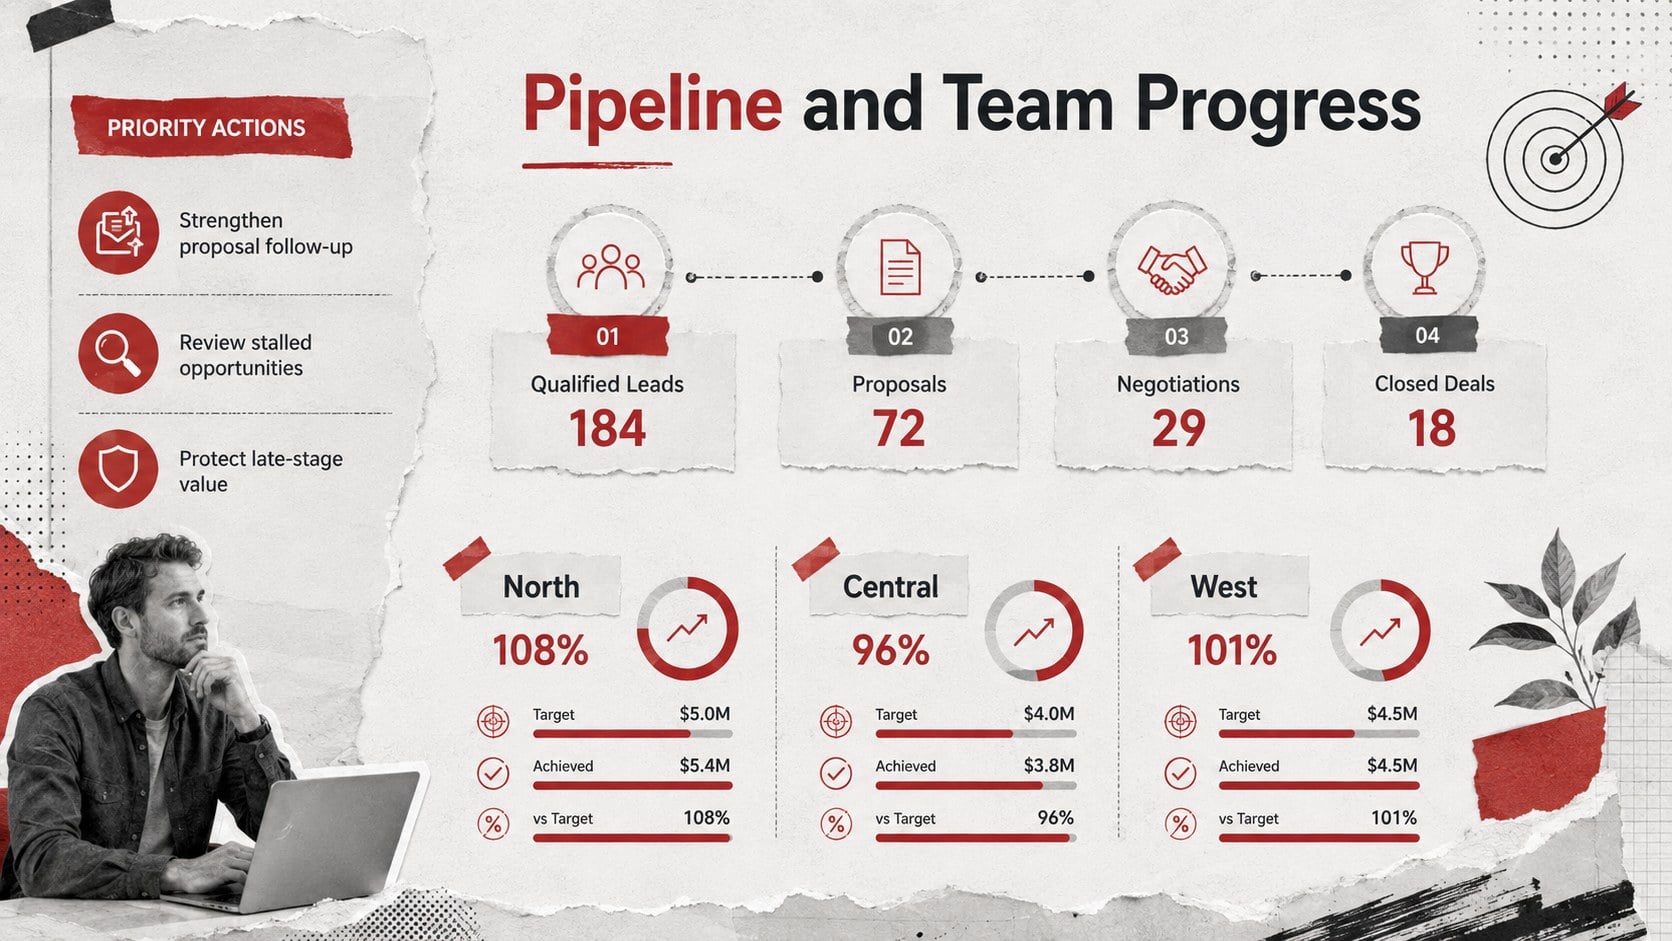
Revenue KPI Dashboard Slides give sales leaders a concise way to connect performance data with practical next steps. The grey-and-red collage design combines crisp typography, paper-inspired textures, and bold metric callouts, helping important numbers stand out without making reports feel crowded. Use the layouts as a weekly sales KPI presentation or adapt them for monthly and quarterly reviews.
The deck includes three coordinated slides for an executive summary, target-versus-actual comparisons, and pipeline or team performance reporting. Editable chart areas, percentage indicators, progress bars, score blocks, and short commentary sections help you explain what changed and why. The modular design also works as a sales performance dashboard template when you need to compare revenue, conversion rates, average deal value, quota attainment, or forecast status in one consistent format.
Built for sales managers, revenue operations teams, account executives, and business analysts, this revenue metrics review deck supports leadership meetings, coaching sessions, forecast calls, and stakeholder updates. Every element can be customized in PowerPoint or Google Slides, including colors, fonts, labels, charts, and decorative collage details. Replace the sample figures with current results, apply your preferred reporting cadence, and create a polished visual scorecard that keeps attention on priorities, progress, and decisions.
Perfect for: weekly sales performance review; monthly revenue reporting; executive KPI briefing; sales coaching session; quarterly target assessment.
Frequently asked questions
Can I edit the metrics and charts? Yes. Replace the sample values, labels, chart data, and commentary with your own sales figures, then adjust the visual indicators to match the results.
Practical details
Yes. Replace the sample values, labels, chart data, and commentary with your own sales figures, then adjust the visual indicators to match the results.
The template is designed for PowerPoint and Google Slides. Core layouts, text boxes, shapes, and visual hierarchy remain editable in both platforms.
Yes. Update the fills, accents, typography, and chart colors to align the slides with your company branding while retaining the dashboard structure.
The layouts suit revenue, quota attainment, conversion rate, pipeline value, win rate, average deal size, and forecast accuracy. You can also rename sections for regional, product, or representative-level reporting.
Keep exploring
15Shape your publishing concept with an indie magazine startup pitch deck featuring pastel gradients, bold collage layouts, and editable planning slides.
 16
Build clear project stories with the Icon Grid Teamwork Theme, a flexible blue illustrated deck for proposals, strategy updates, and team meetings.
 3
Turn priorities into an actionable plan with an annual goals roadmap infographic, featuring editable orange and teal layouts for PowerPoint and Google Slides.
 15
Create an Annual Achievement Report Presentation with colorful geometric layouts for milestones, results, lessons, and priorities in PowerPoint or Google Slides.
 15
Turn results into a focused annual performance evaluation report with dark 3D slides for KPIs, achievements, feedback, and next-step goals for teams.
 15
Guide a focused annual recap with Business Results Retrospective Slides, a muted brown-and-blue template for PowerPoint and Google Slides.
 6
Turn complex plans into clear visual stories with Color-Coded Workflow Path Slides, an editable set for project updates, roadmaps, and team briefings.
 6
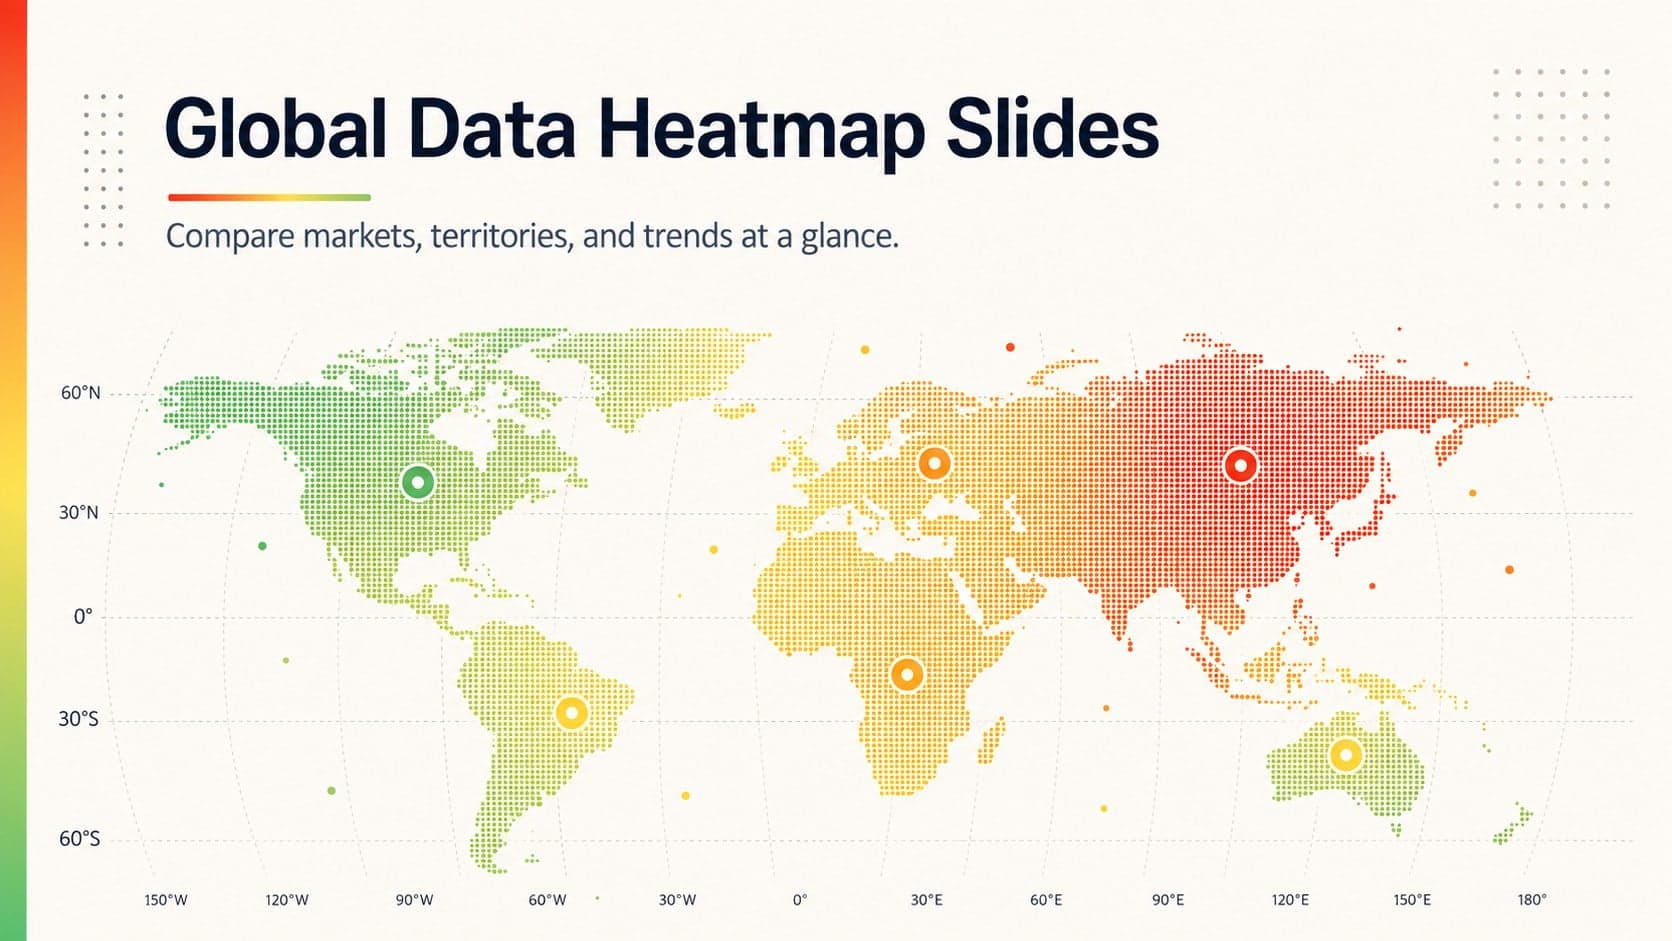
Compare regional performance at a glance with Global Data Heatmap Slides, a clean multicolor deck designed for editable PowerPoint and Google Slides.