
 15
presentation
Indie Magazine Startup Pitch Deck
Shape your publishing concept with an indie magazine startup pitch deck featuring pastel gradients, bold collage layouts, and editable planning slides.
Google SlidesPowerPoint
presentation · English
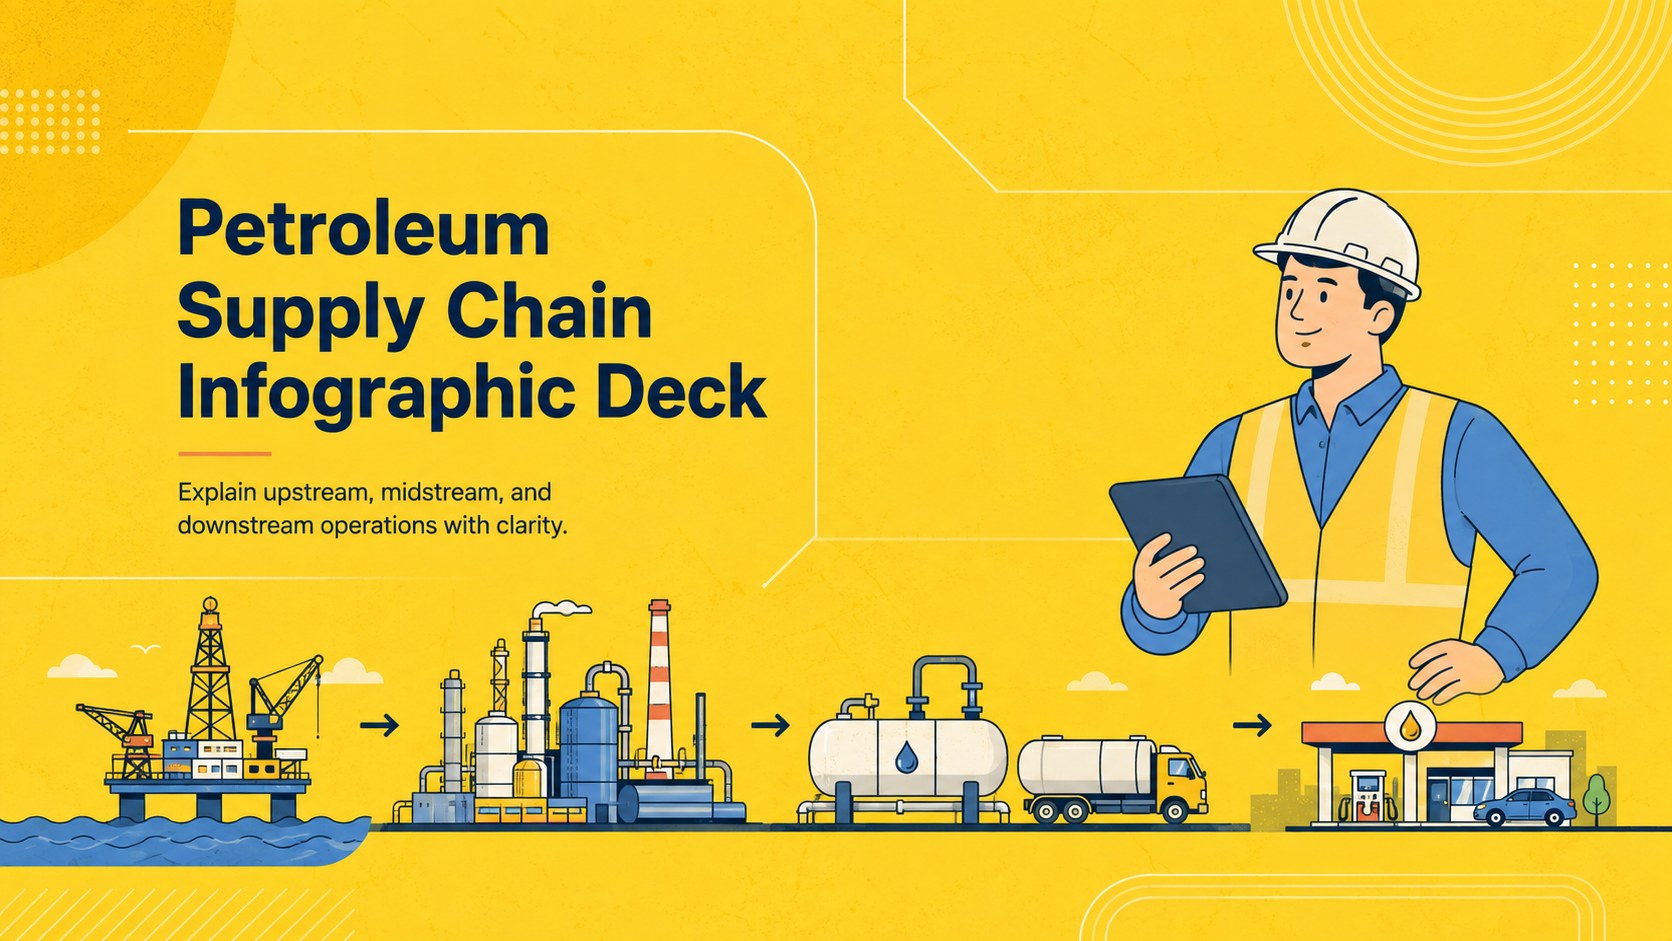
Explain upstream, midstream, and downstream operations with a petroleum supply chain infographic deck for PowerPoint and Google Slides.
Design notes
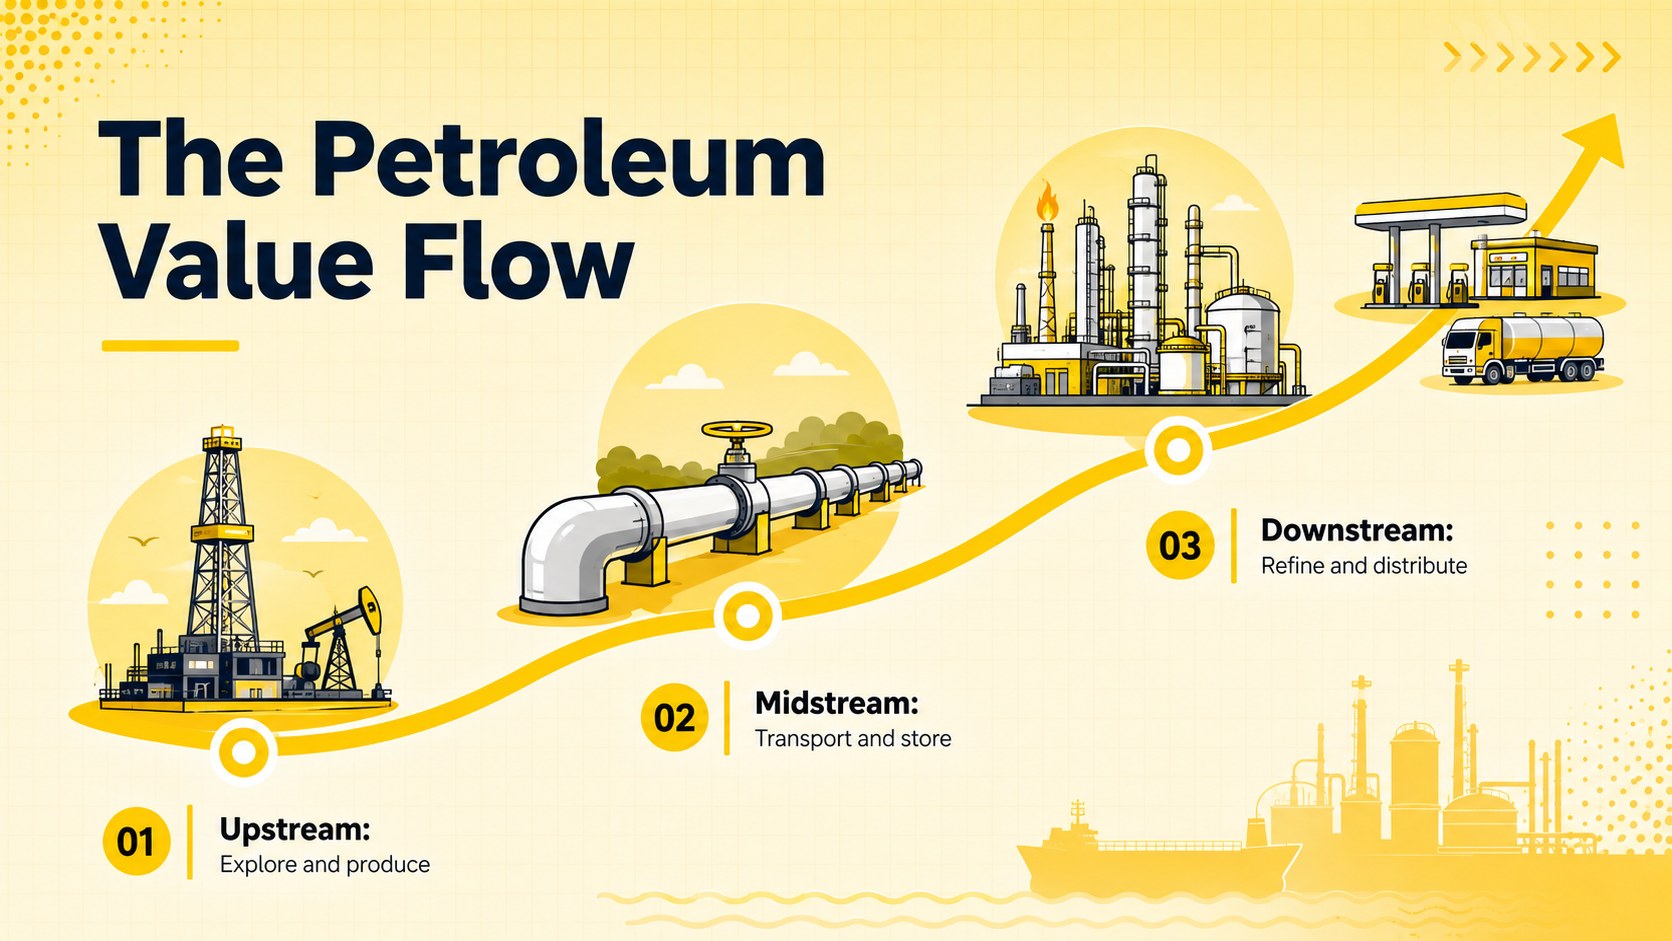
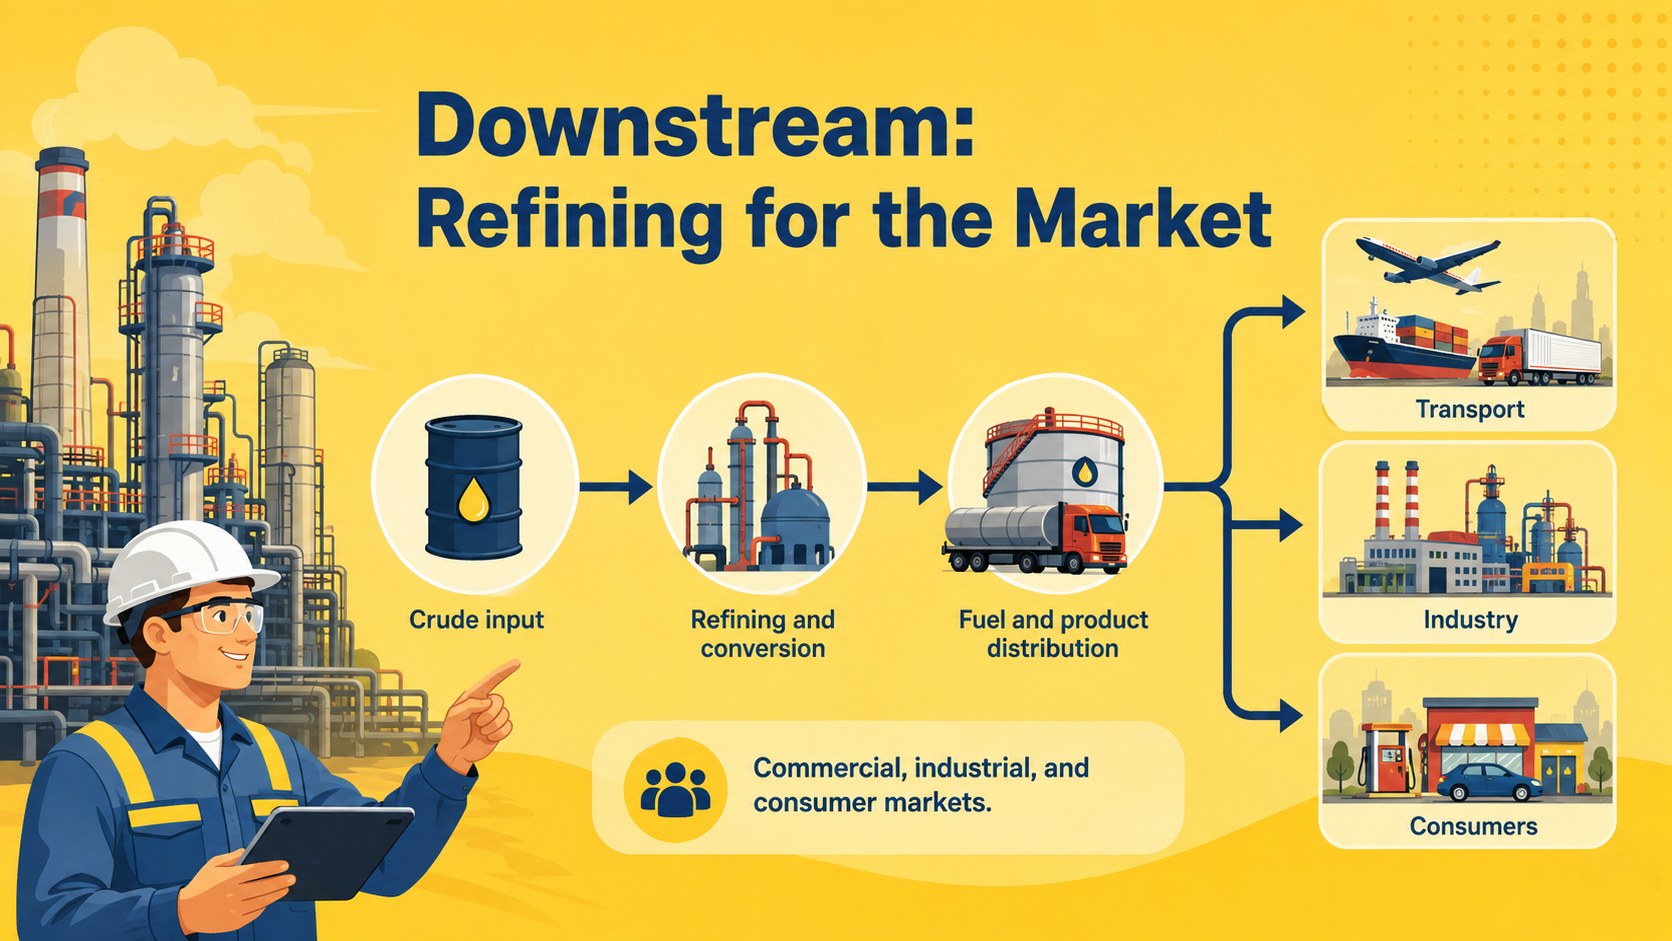
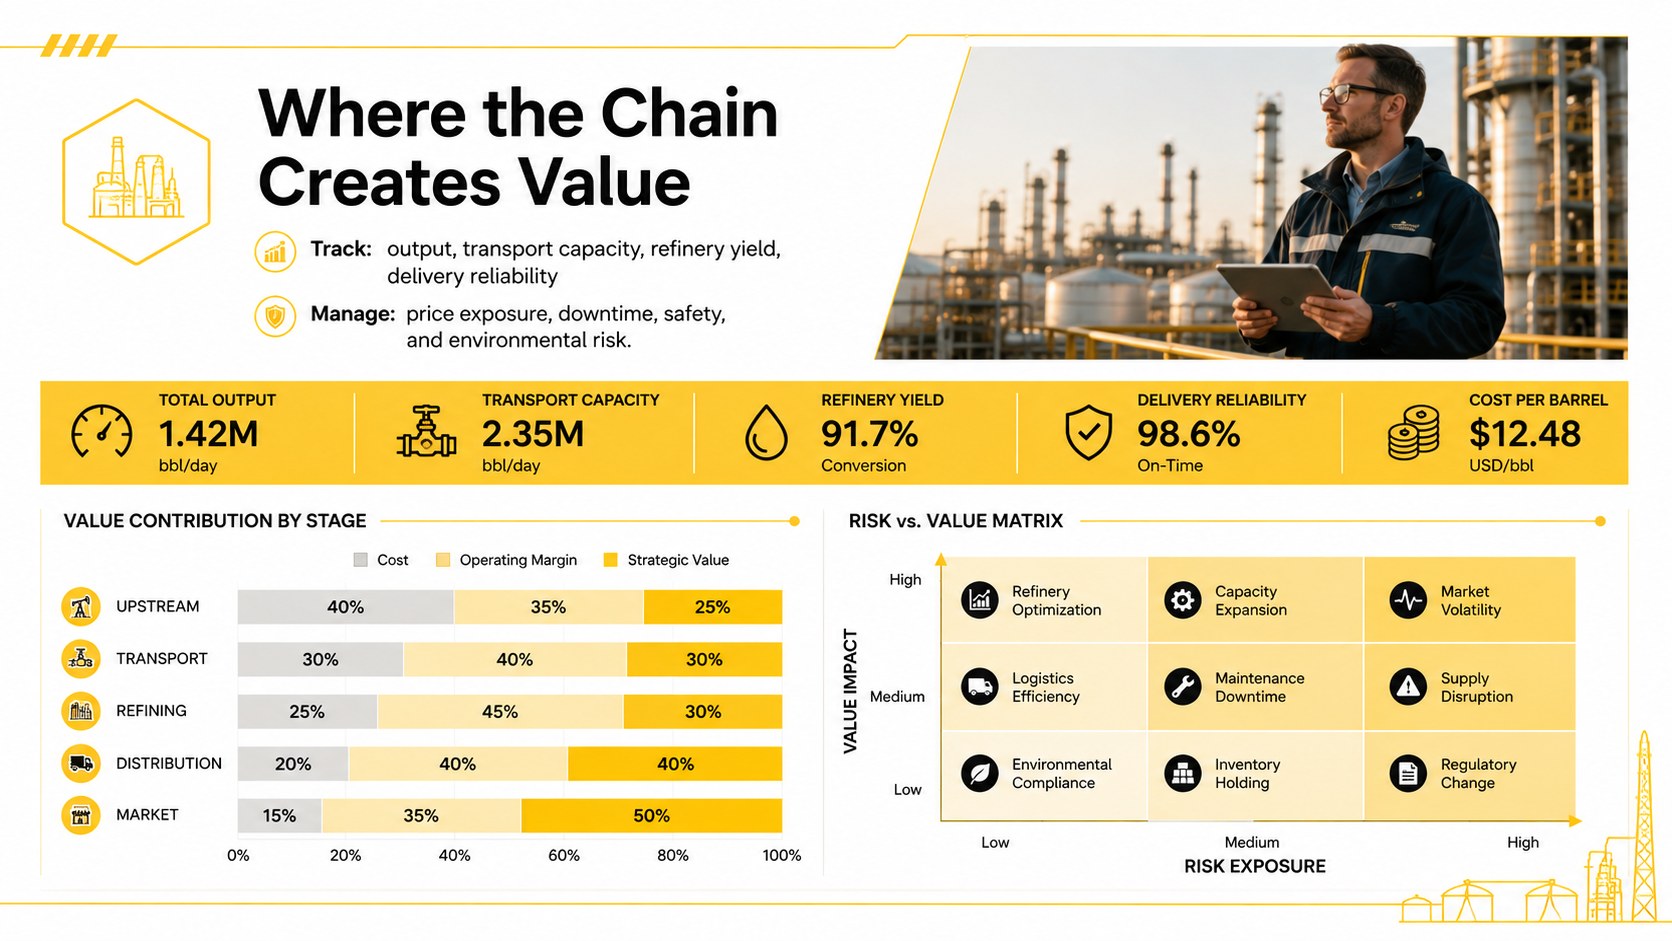
Clarify how resources move from exploration to the end customer with this petroleum supply chain infographic deck. Its bright yellow palette, clean illustrated graphics, and straightforward business style help presenters organize technical information without overwhelming their audience. Use the layouts to connect operational stages, participants, infrastructure, and value creation in one coherent narrative.
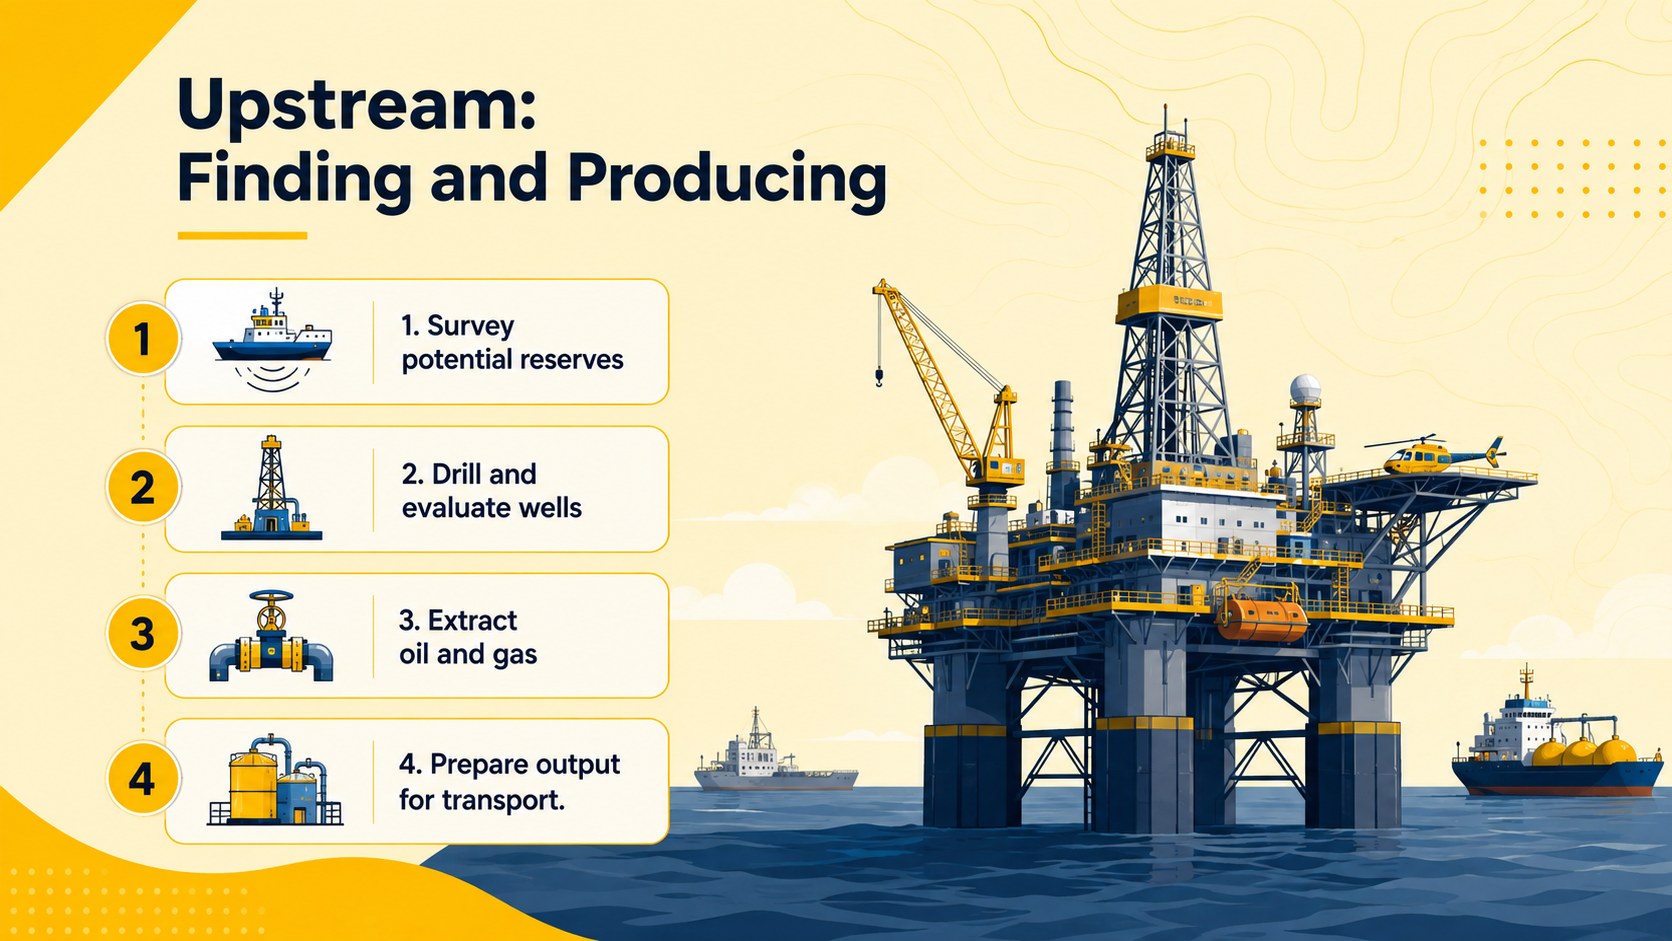
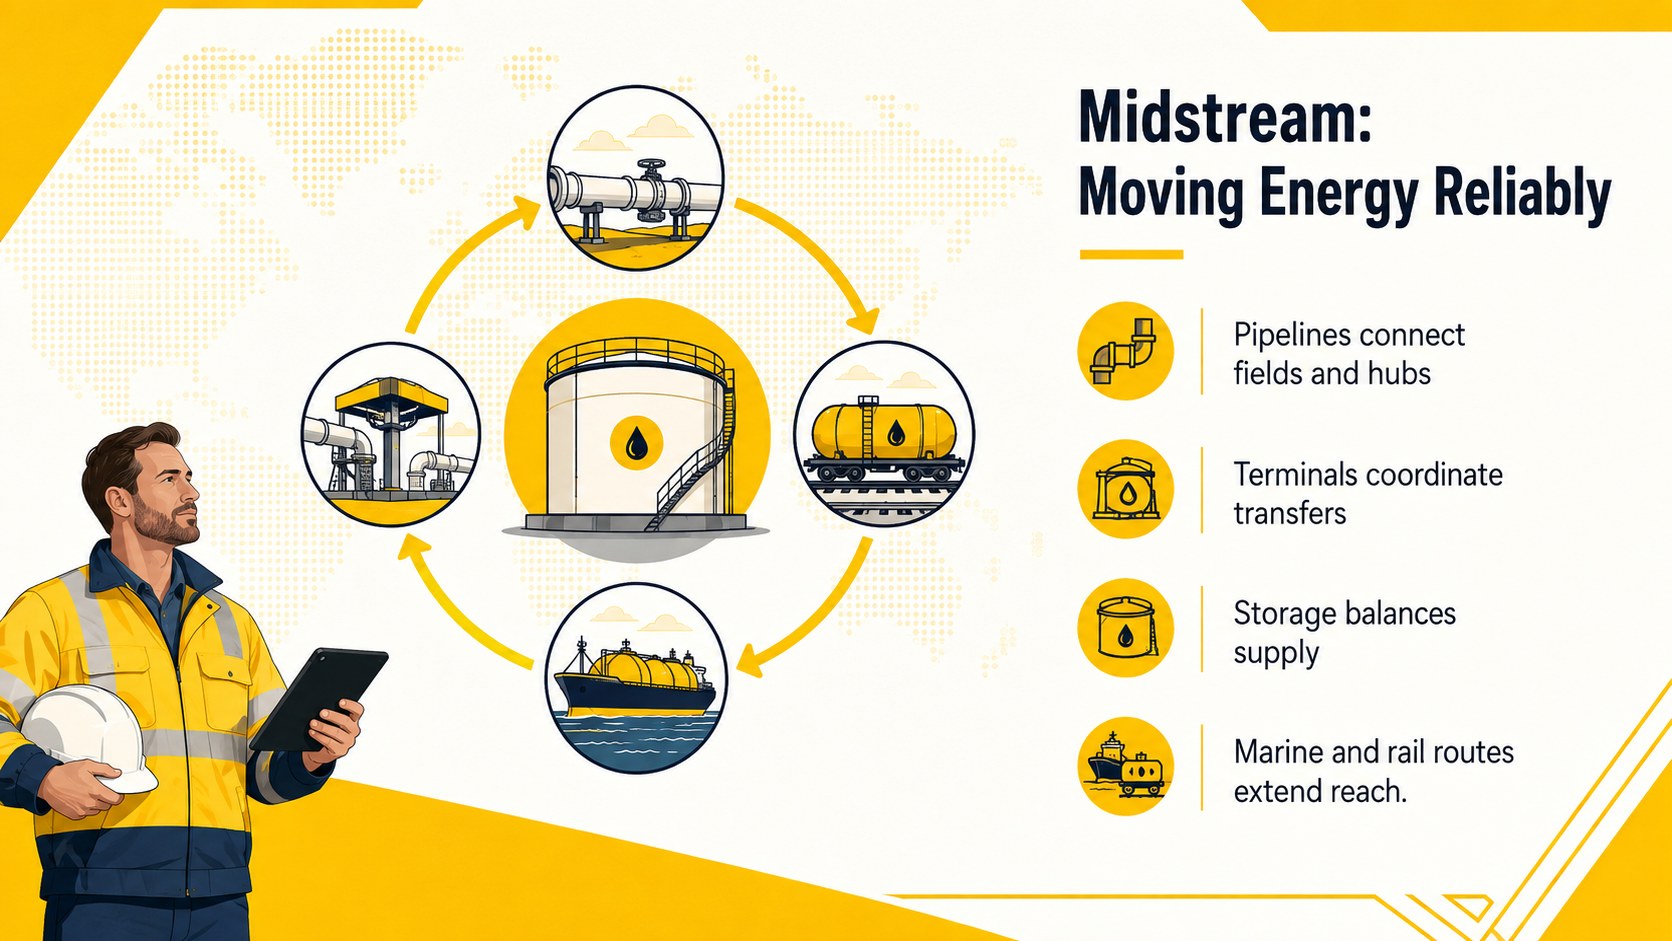
The deck includes six editable 16:9 layouts covering the complete energy journey. Introduce the industry flow, outline upstream exploration and production, explain midstream transportation and storage, and summarize downstream refining and distribution. Additional visual structures support an upstream midstream downstream presentation, an oil industry process flow diagram, and comparisons of costs, risks, or performance indicators. Text, colors, icons, shapes, and chart values can be adjusted to reflect a specific company, project, market, or training program.
Designed for PowerPoint and Google Slides, this template works well for energy consultants, operations managers, analysts, educators, and corporate training teams. It can support stakeholder briefings, employee onboarding, project reviews, investment discussions, and classroom lessons about the petroleum value chain. The structured infographics make dependencies easier to follow while leaving enough room for concise explanations and supporting data. Customize each slide with your own terminology, production figures, logistics details, and strategic priorities to create a focused oil and gas operations overview for internal or external audiences.
Perfect for: energy stakeholder briefing; petroleum employee onboarding; oil industry classroom lesson; operations strategy review; supply chain risk analysis.
Frequently asked questions
Can I edit every element in the deck? Yes. The text, colors, icons, shapes, diagrams, and data labels are editable, so you can adapt the layouts to your organization or project.
Practical details
Yes. The text, colors, icons, shapes, diagrams, and data labels are editable, so you can adapt the layouts to your organization or project.
The template is designed for Microsoft PowerPoint and Google Slides. Minor font or spacing adjustments may be needed when moving the file between platforms.
Yes. You can rename, reorder, add, or remove stages to represent your own upstream, midstream, refining, distribution, and retail activities.
Yes. The diagrams provide a simplified overview for general stakeholders, while editable labels and data areas allow specialists to add operational detail.
Keep exploring
15Shape your publishing concept with an indie magazine startup pitch deck featuring pastel gradients, bold collage layouts, and editable planning slides.
 16
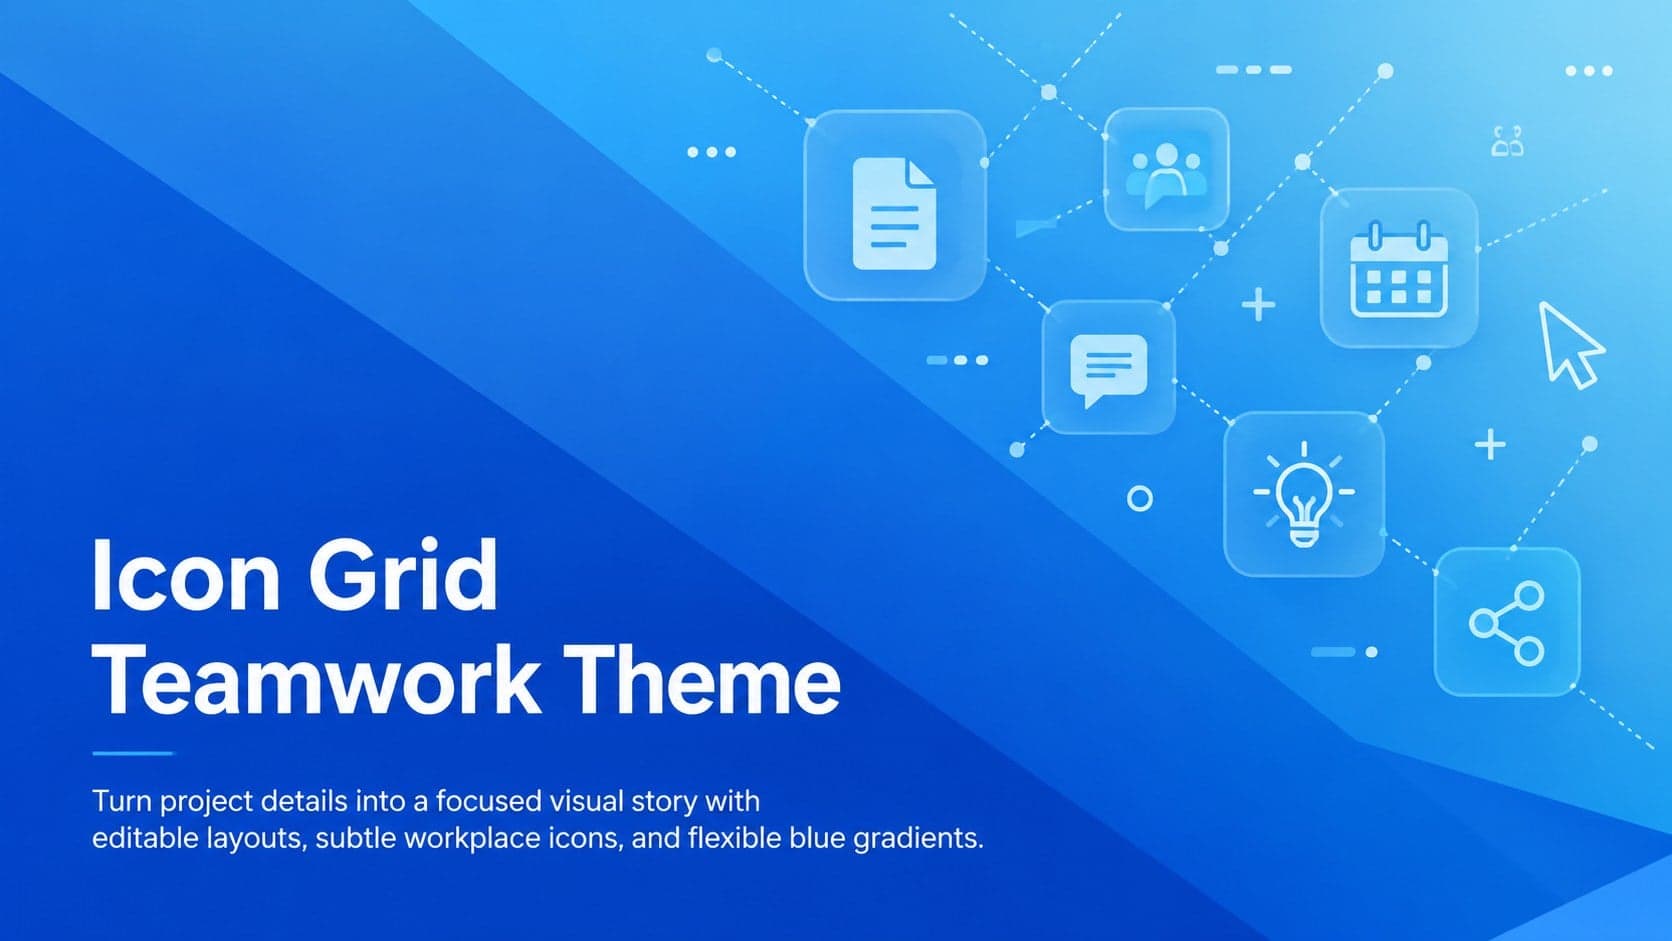
Build clear project stories with the Icon Grid Teamwork Theme, a flexible blue illustrated deck for proposals, strategy updates, and team meetings.
 3
Turn priorities into an actionable plan with an annual goals roadmap infographic, featuring editable orange and teal layouts for PowerPoint and Google Slides.
 15
Create an Annual Achievement Report Presentation with colorful geometric layouts for milestones, results, lessons, and priorities in PowerPoint or Google Slides.
 15
Turn results into a focused annual performance evaluation report with dark 3D slides for KPIs, achievements, feedback, and next-step goals for teams.
 15
Guide a focused annual recap with Business Results Retrospective Slides, a muted brown-and-blue template for PowerPoint and Google Slides.
 6
Turn complex plans into clear visual stories with Color-Coded Workflow Path Slides, an editable set for project updates, roadmaps, and team briefings.
 6
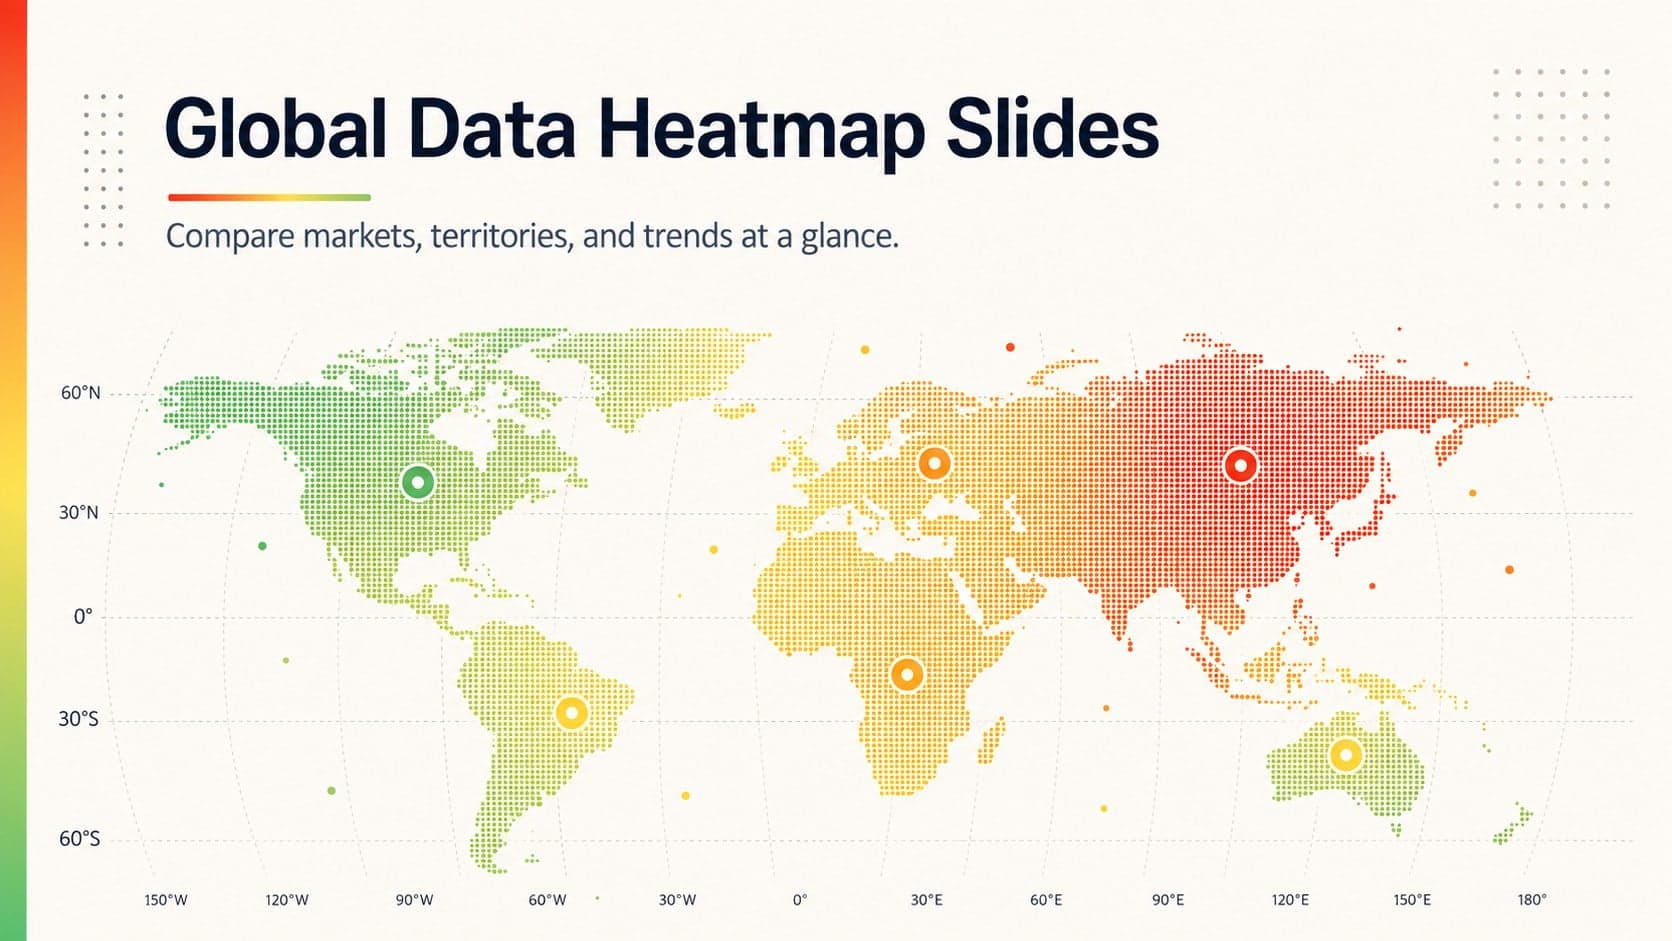
Compare regional performance at a glance with Global Data Heatmap Slides, a clean multicolor deck designed for editable PowerPoint and Google Slides.