
 15
15presentation
Indie Magazine Startup Pitch Deck
Shape your publishing concept with an indie magazine startup pitch deck featuring pastel gradients, bold collage layouts, and editable planning slides.
Google SlidesPowerPoint
presentation · English
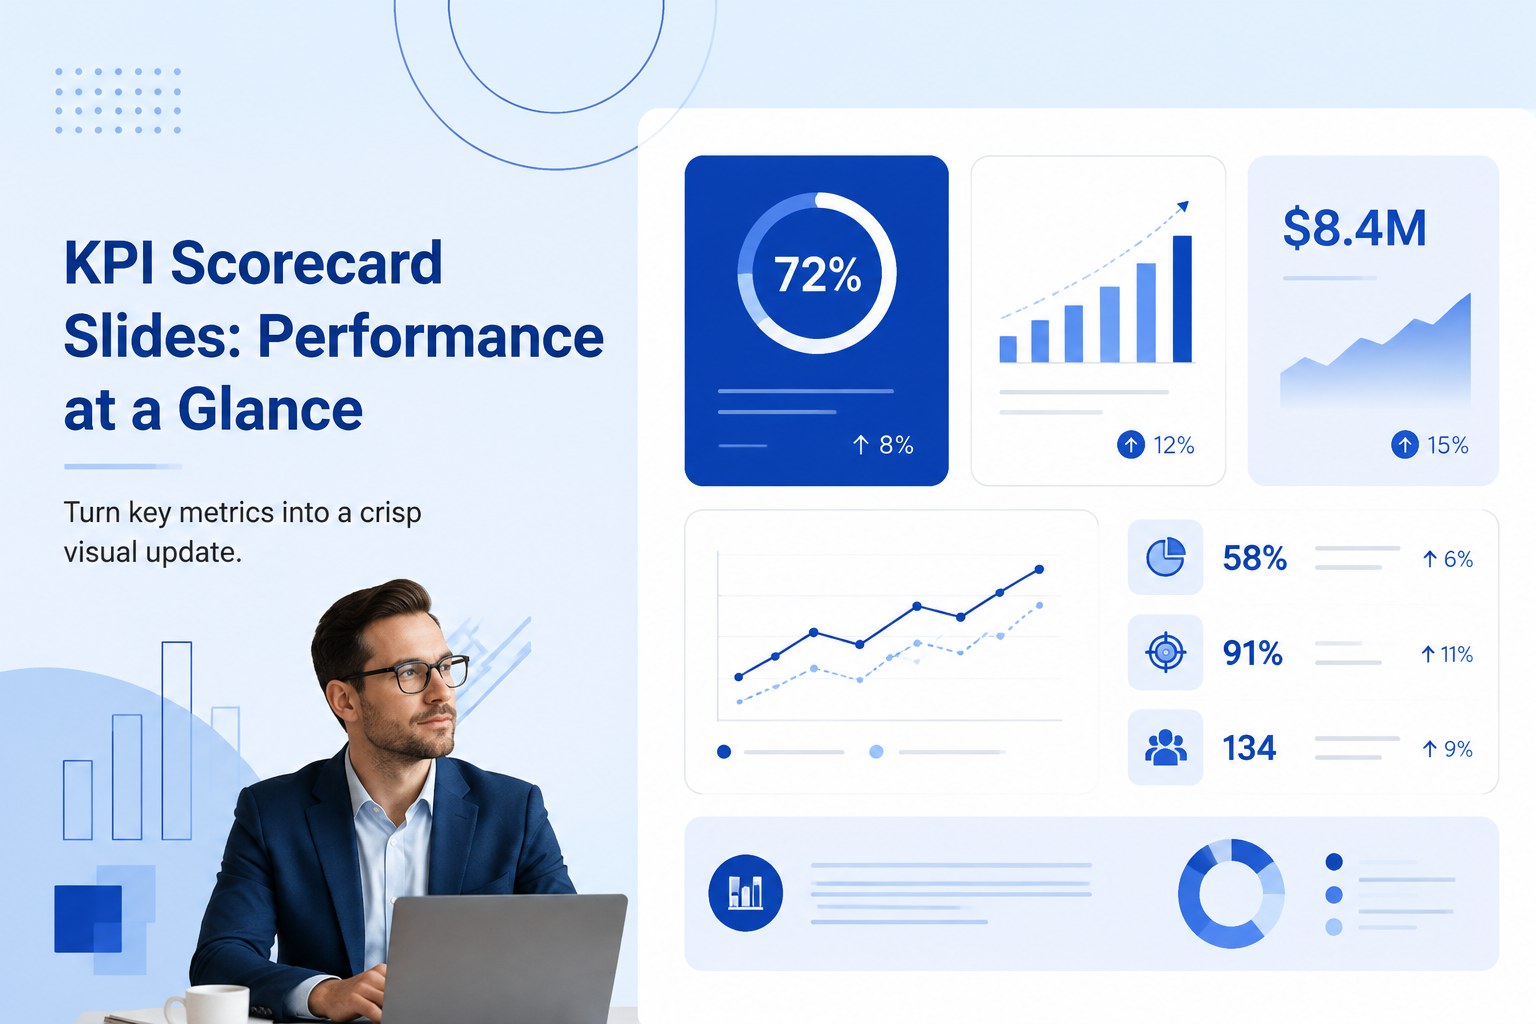
Turn key metrics into focused decisions with KPI scorecard slides for PowerPoint and Google Slides, featuring clean blue layouts for fast reporting.
Design notes
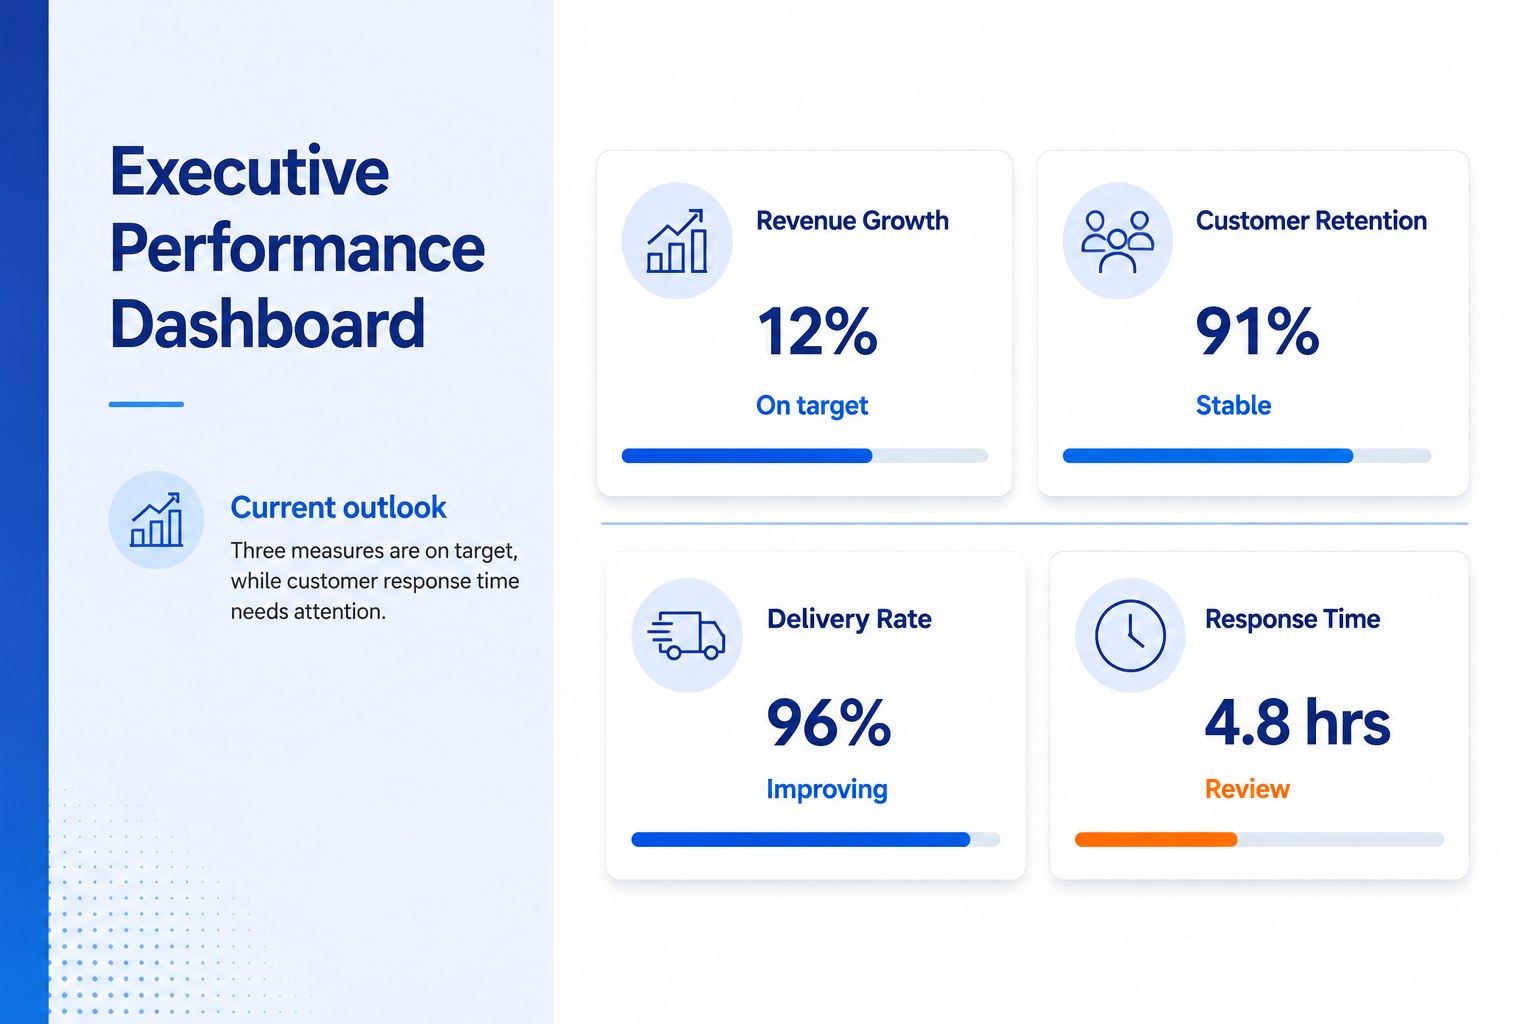
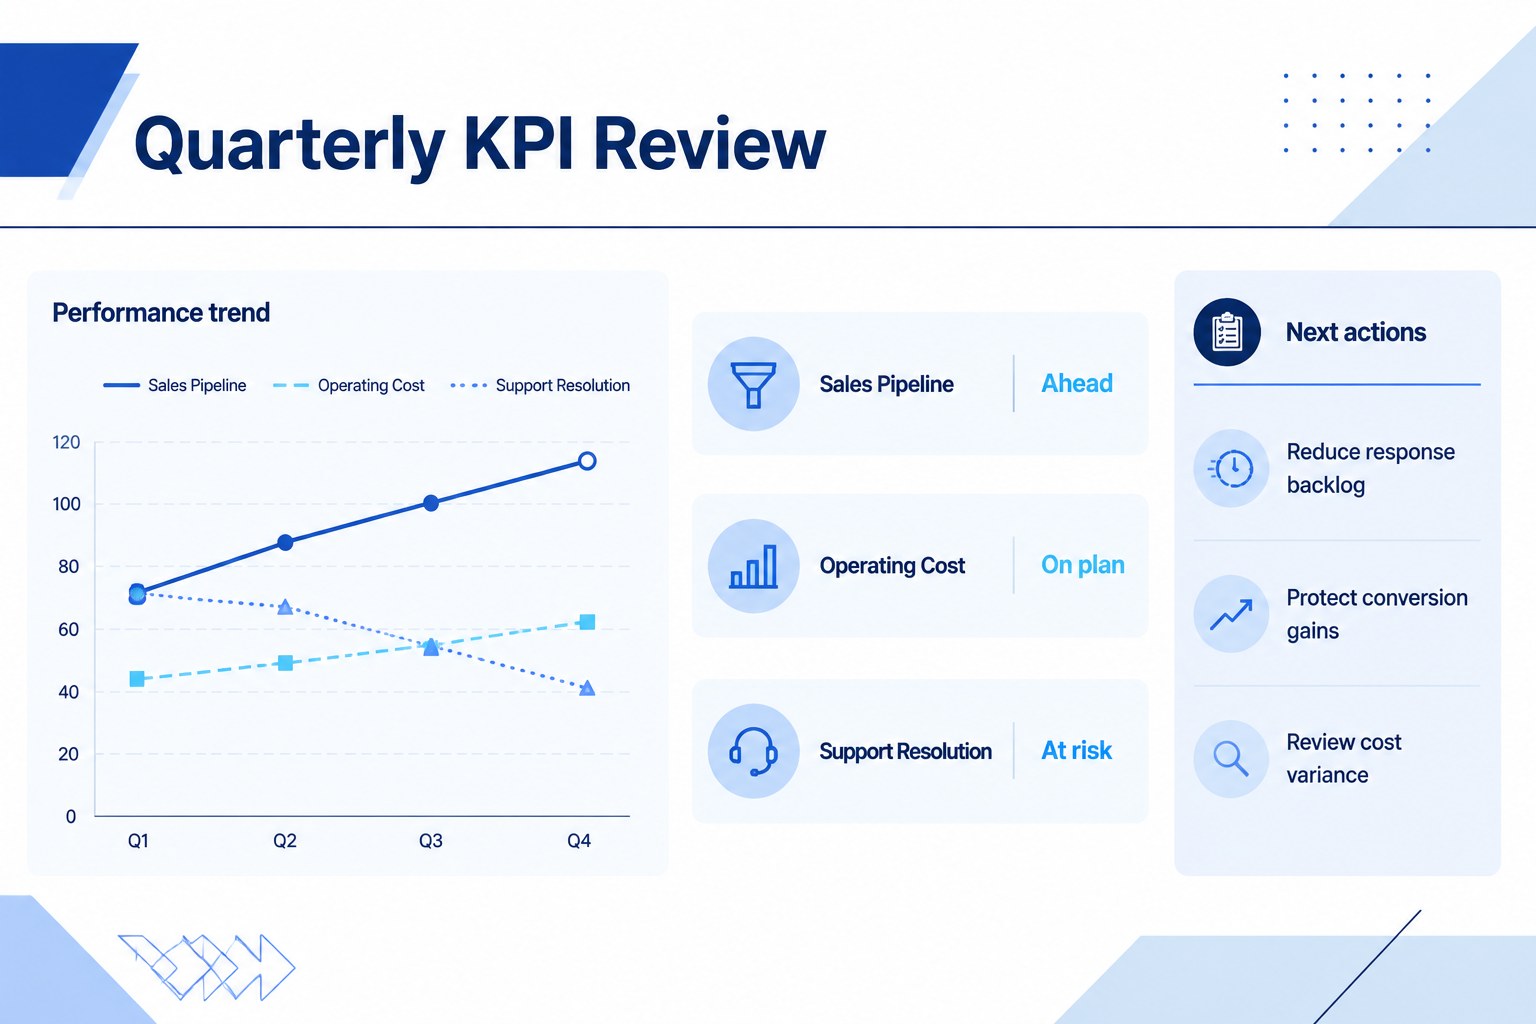
Make performance updates easier to scan with KPI scorecard slides designed for clear, focused reporting. The minimal blue visual system gives important figures room to stand out while keeping supporting details organized. Use the layouts to communicate targets, actual results, trends, and status indicators in a format that decision-makers can understand quickly.
Inside the deck are three coordinated scorecard designs for PowerPoint and Google Slides. Build an executive performance dashboard slide, summarize quarterly results, or compare several measures on one page. Editable text, shapes, charts, icons, and color accents make it simple to adapt the slides to your reporting structure. The layouts support percentages, totals, progress bars, performance ratings, brief commentary, and red-amber-green status signals without making the page feel crowded.
These slides are suited to department heads, project managers, analysts, consultants, founders, and operations teams preparing a quarterly KPI reporting deck or team metrics review presentation. They work for sales targets, financial performance, service quality, campaign outcomes, operational efficiency, customer satisfaction, and project health. Replace the sample figures with your own data, adjust the blue palette to match internal guidelines, and reorder sections around the measures your audience values most. The result is a concise reporting tool that keeps discussion centered on outcomes, exceptions, and next actions.
Perfect for: quarterly performance review; executive KPI briefing; project health update; department metrics meeting; client results report.
Frequently asked questions
Can I edit every part of these scorecard slides? Yes. Text, figures, status labels, shapes, charts, and color accents can be adjusted to match your metrics and reporting standards.
Practical details
Yes. Text, figures, status labels, shapes, charts, and color accents can be adjusted to match your metrics and reporting standards.
The template is designed for PowerPoint and Google Slides. Upload or open the deck in your preferred platform, then replace the sample content with your own data.
Start by replacing the sample KPIs, targets, and results, then update the blue accents and typography to align with your visual identity. Keep the number of measures limited so the main findings remain easy to scan.
The layouts accommodate financial, sales, marketing, operational, customer service, and project metrics. They are especially useful for measures that include a target, current result, trend, and short status note.
Keep exploring
15Shape your publishing concept with an indie magazine startup pitch deck featuring pastel gradients, bold collage layouts, and editable planning slides.
 16
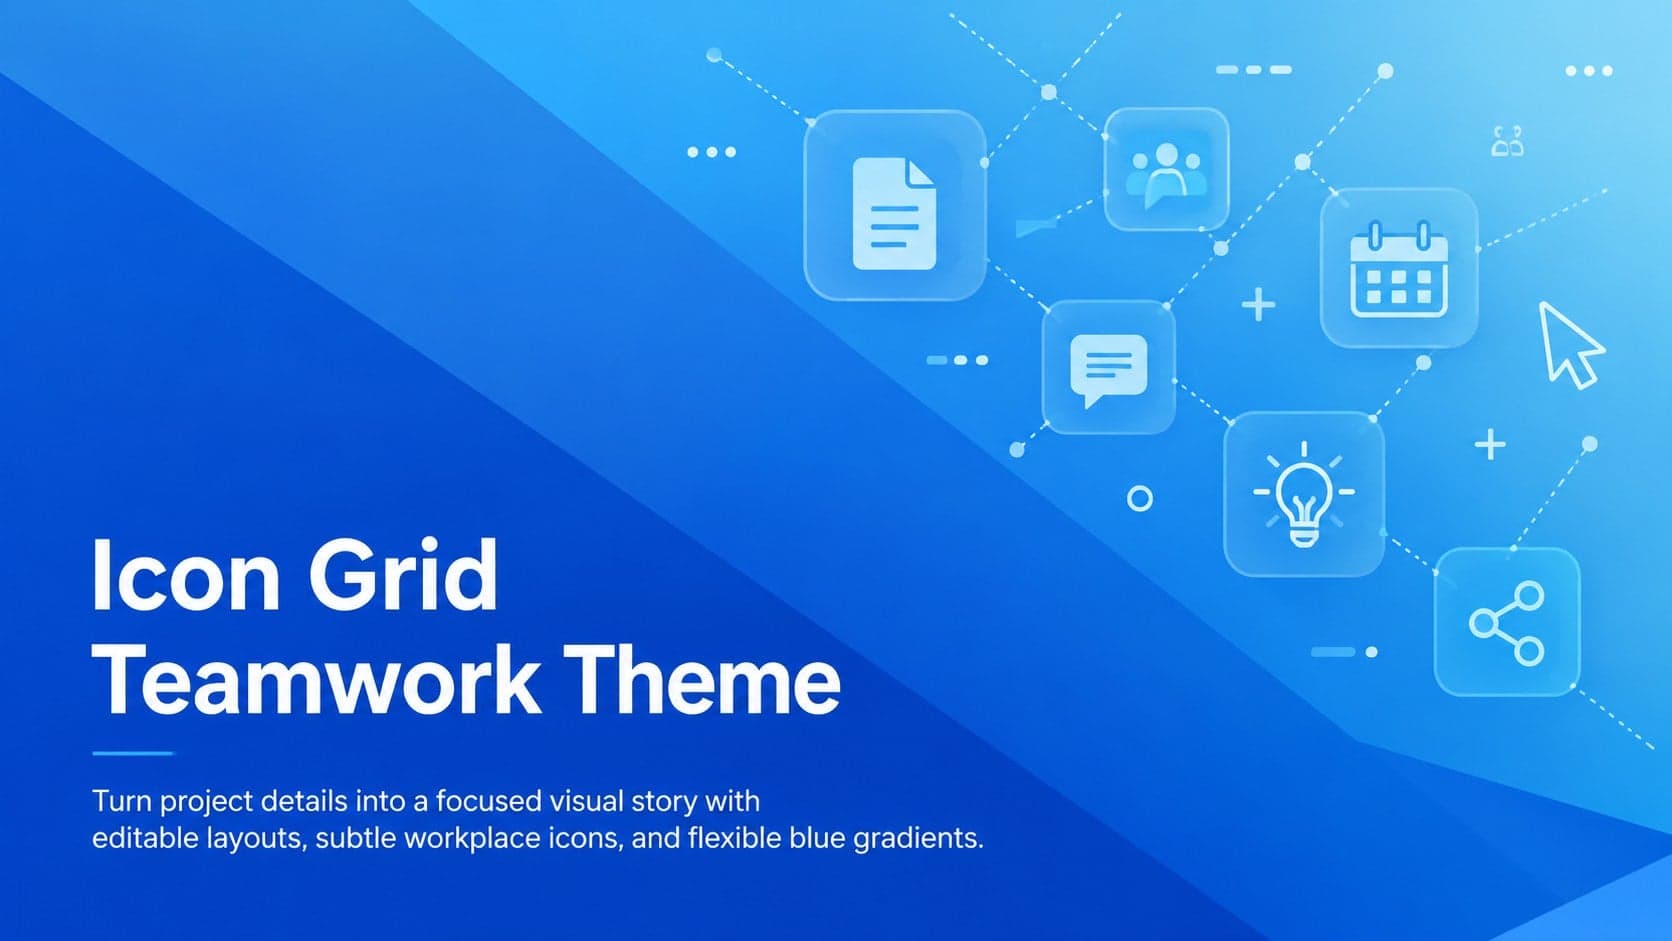
16Build clear project stories with the Icon Grid Teamwork Theme, a flexible blue illustrated deck for proposals, strategy updates, and team meetings.
 3
3Turn priorities into an actionable plan with an annual goals roadmap infographic, featuring editable orange and teal layouts for PowerPoint and Google Slides.
 15
15Create an Annual Achievement Report Presentation with colorful geometric layouts for milestones, results, lessons, and priorities in PowerPoint or Google Slides.
 15
15Turn results into a focused annual performance evaluation report with dark 3D slides for KPIs, achievements, feedback, and next-step goals for teams.
 15
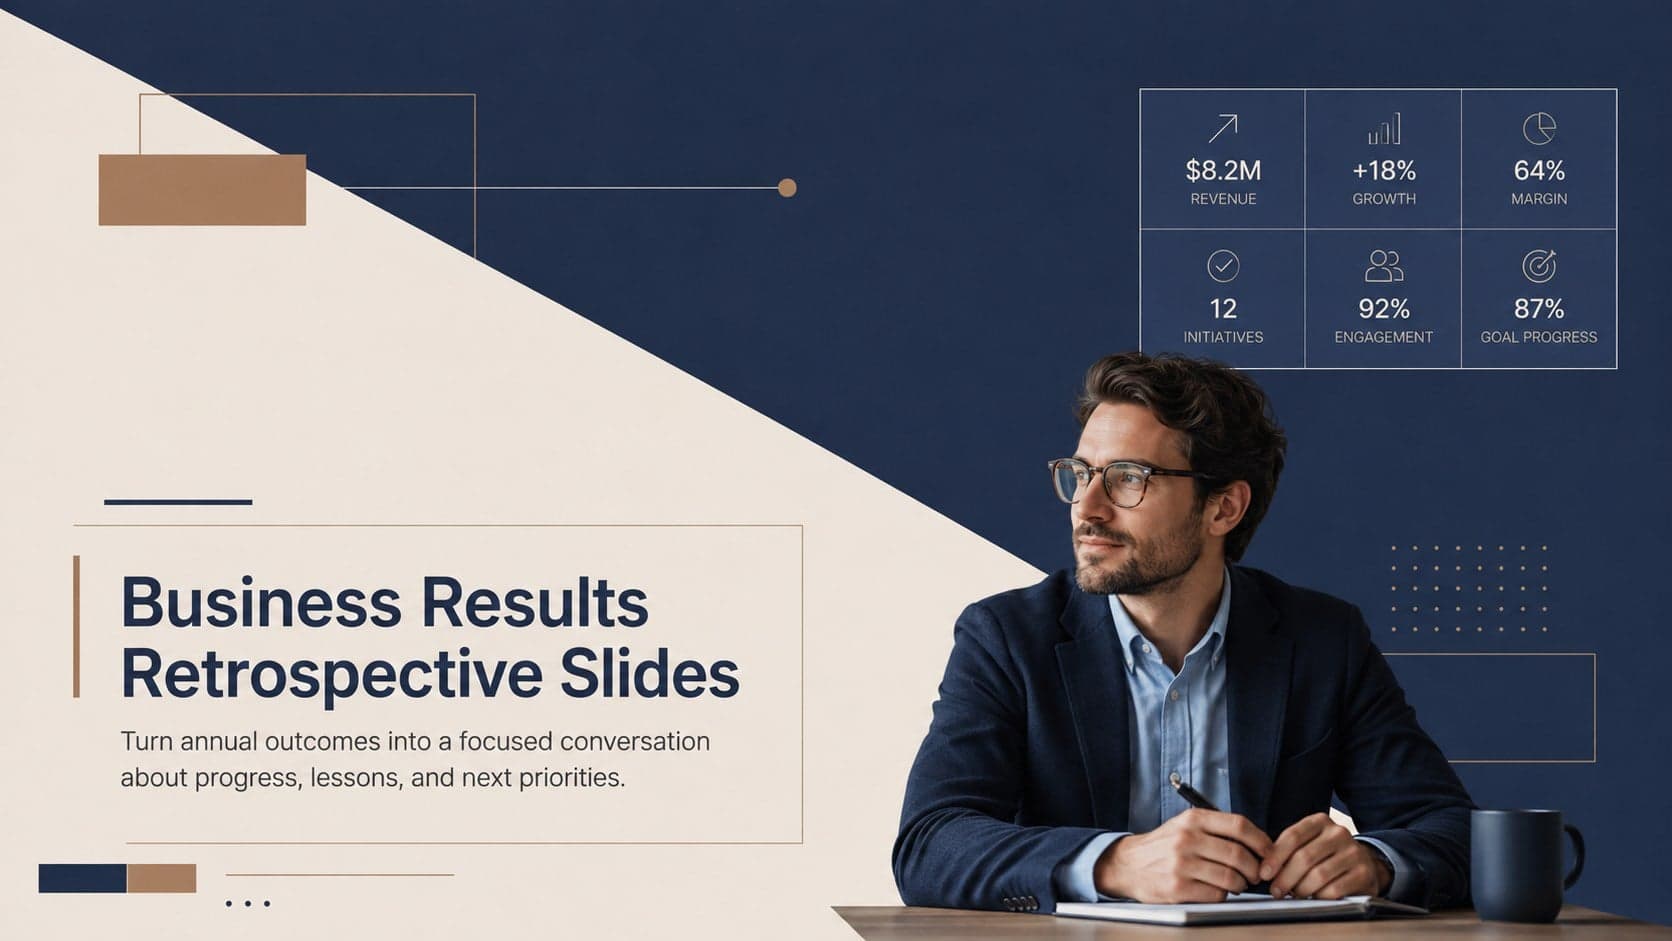
15Guide a focused annual recap with Business Results Retrospective Slides, a muted brown-and-blue template for PowerPoint and Google Slides.
 6
6Turn complex plans into clear visual stories with Color-Coded Workflow Path Slides, an editable set for project updates, roadmaps, and team briefings.
 6
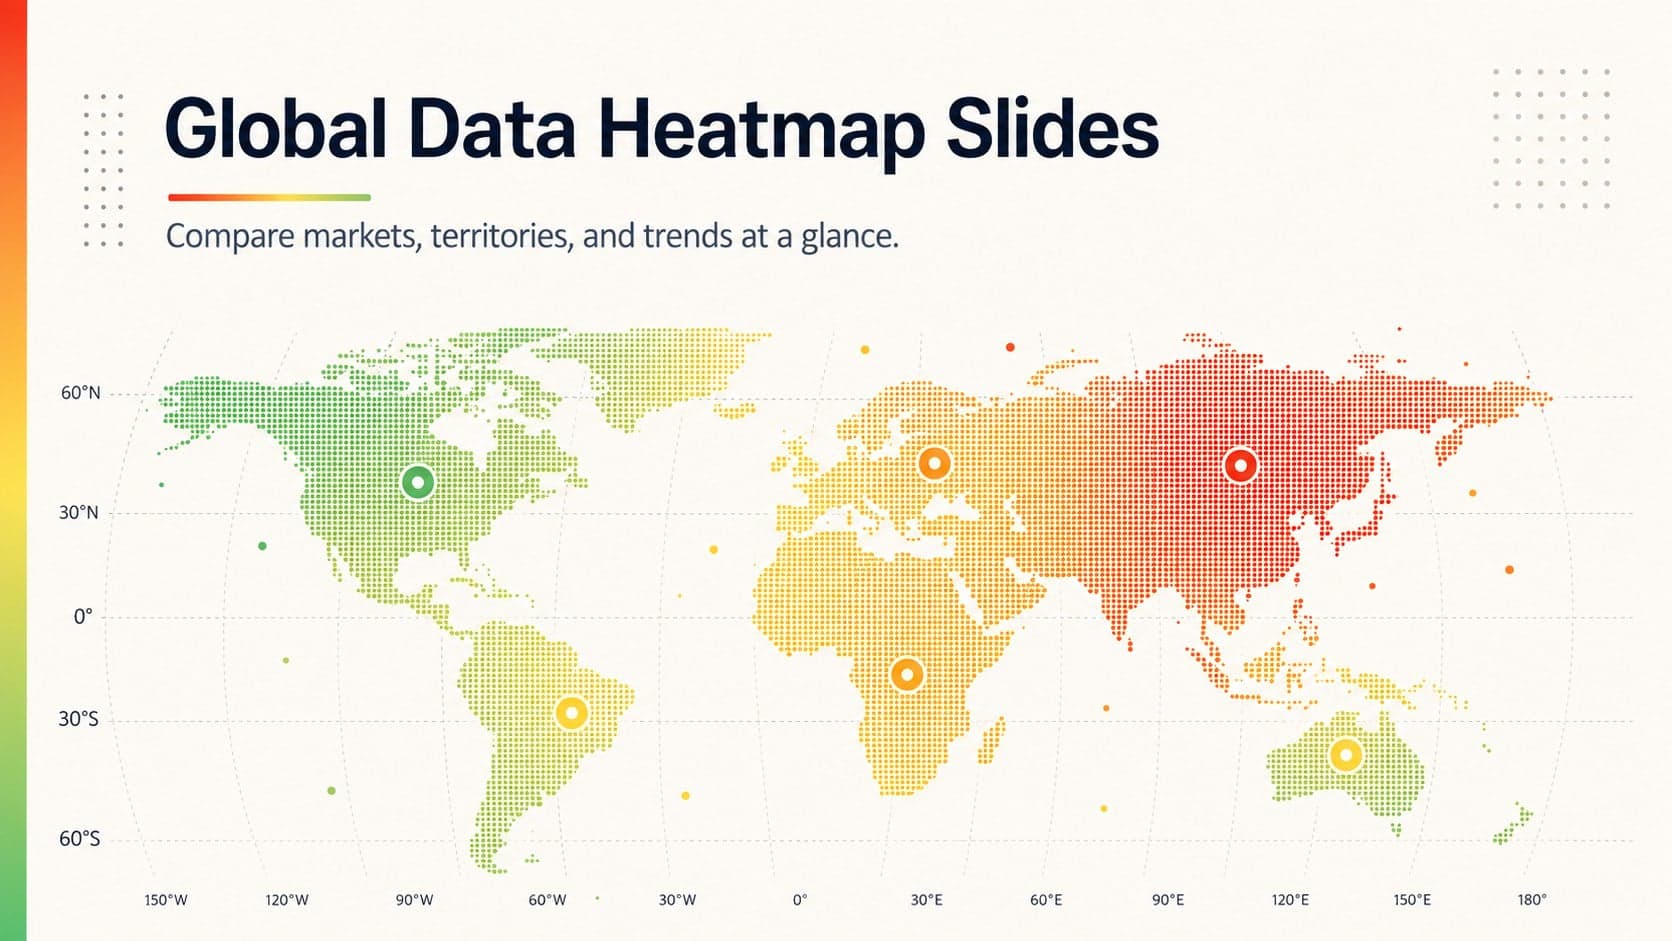
6Compare regional performance at a glance with Global Data Heatmap Slides, a clean multicolor deck designed for editable PowerPoint and Google Slides.