
 15
presentation
Indie Magazine Startup Pitch Deck
Shape your publishing concept with an indie magazine startup pitch deck featuring pastel gradients, bold collage layouts, and editable planning slides.
Google SlidesPowerPoint
presentation · English
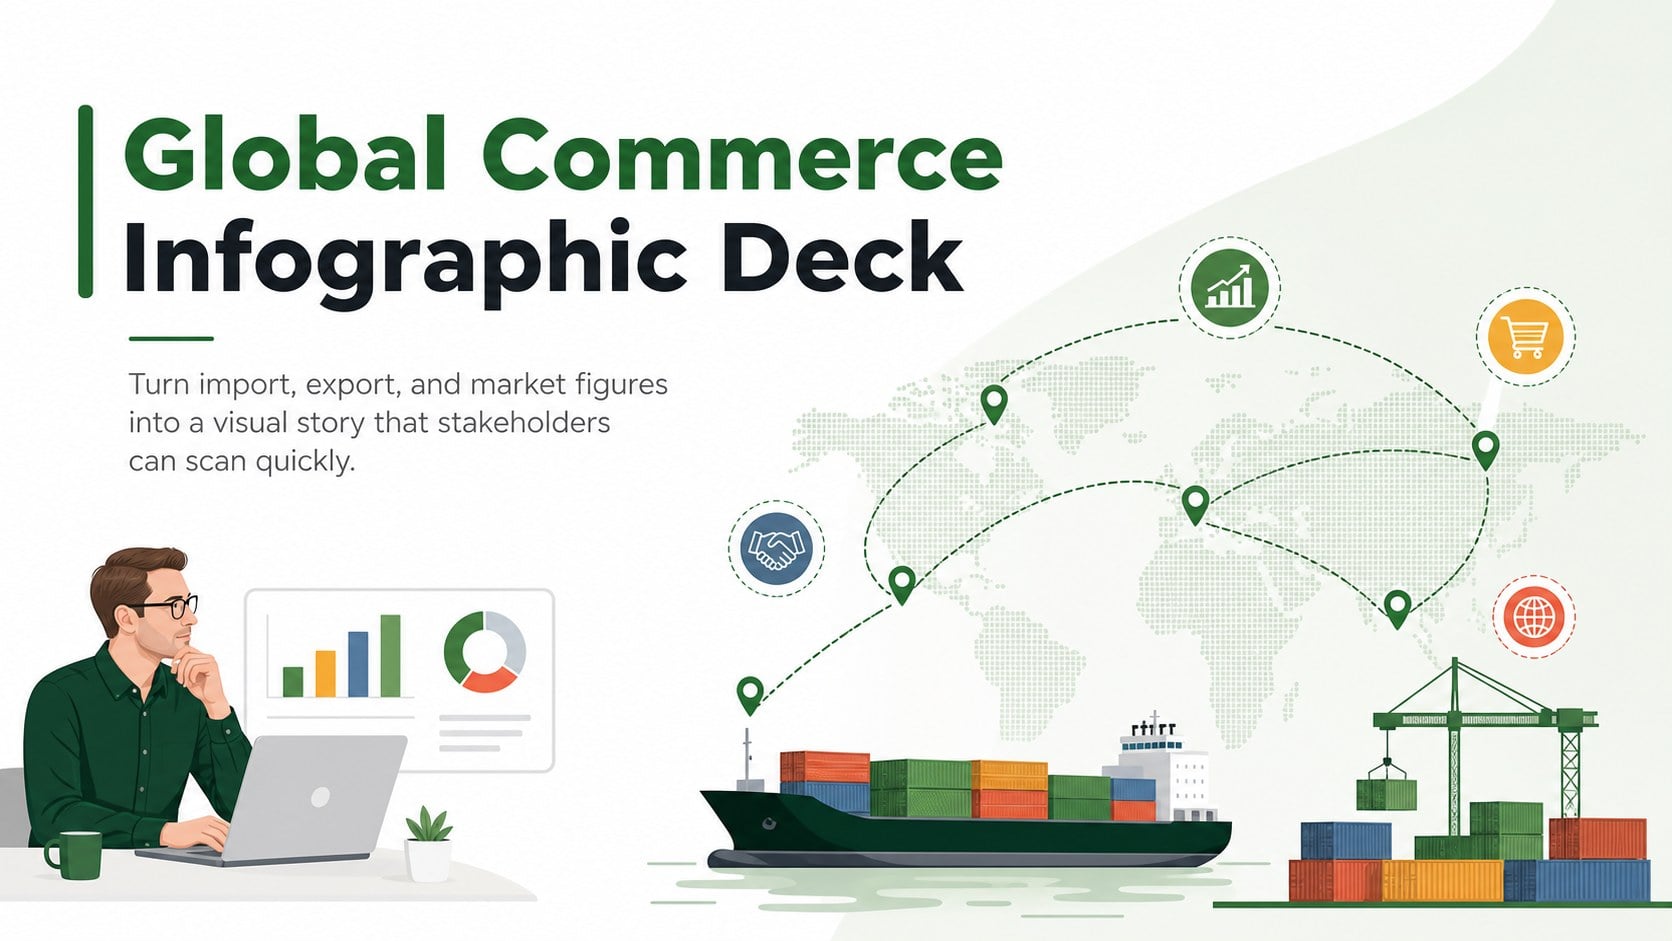
Build clear import, export, and supply chain stories with a global commerce infographic deck in green and white, ready for PowerPoint and Google Slides.
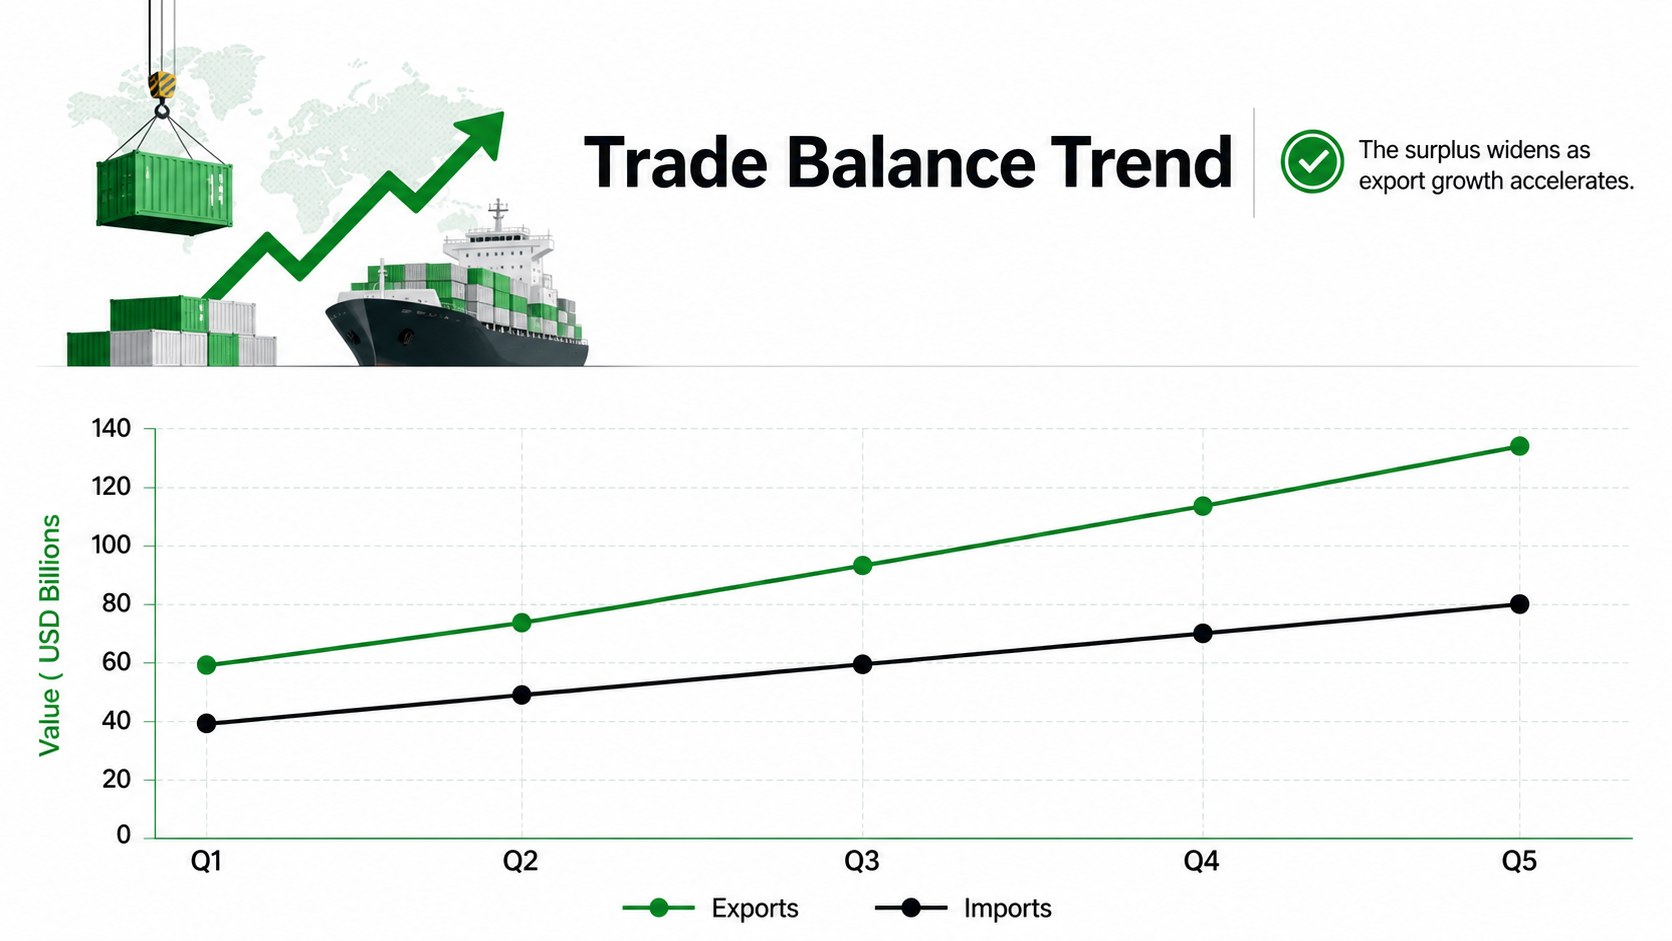
Design notes
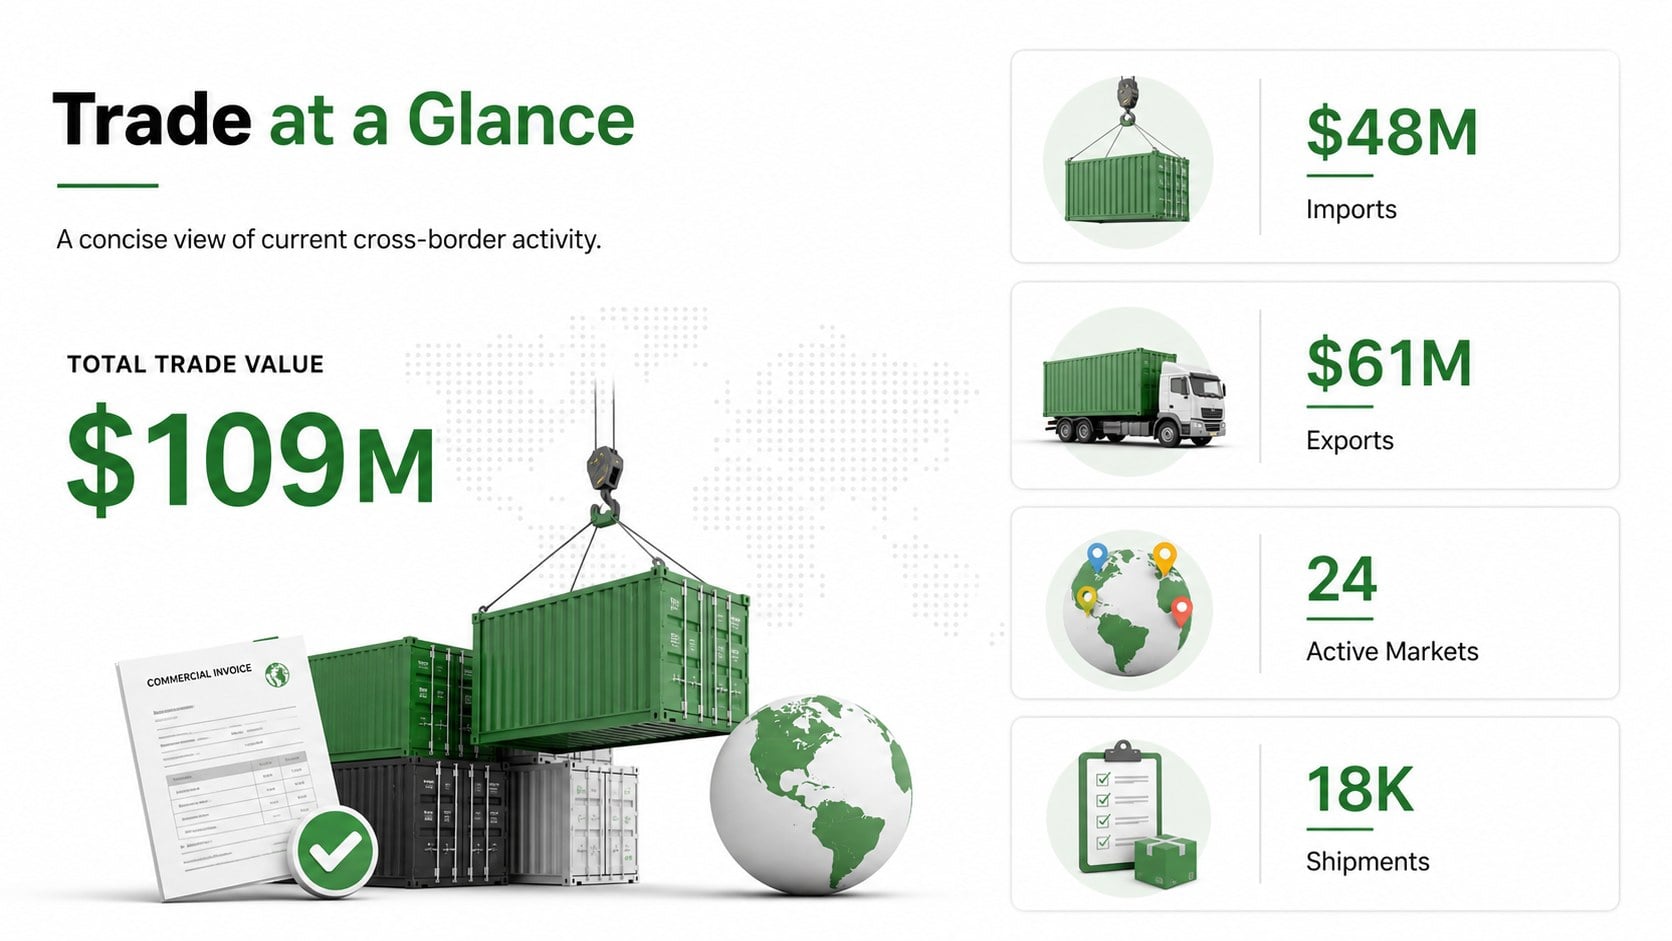
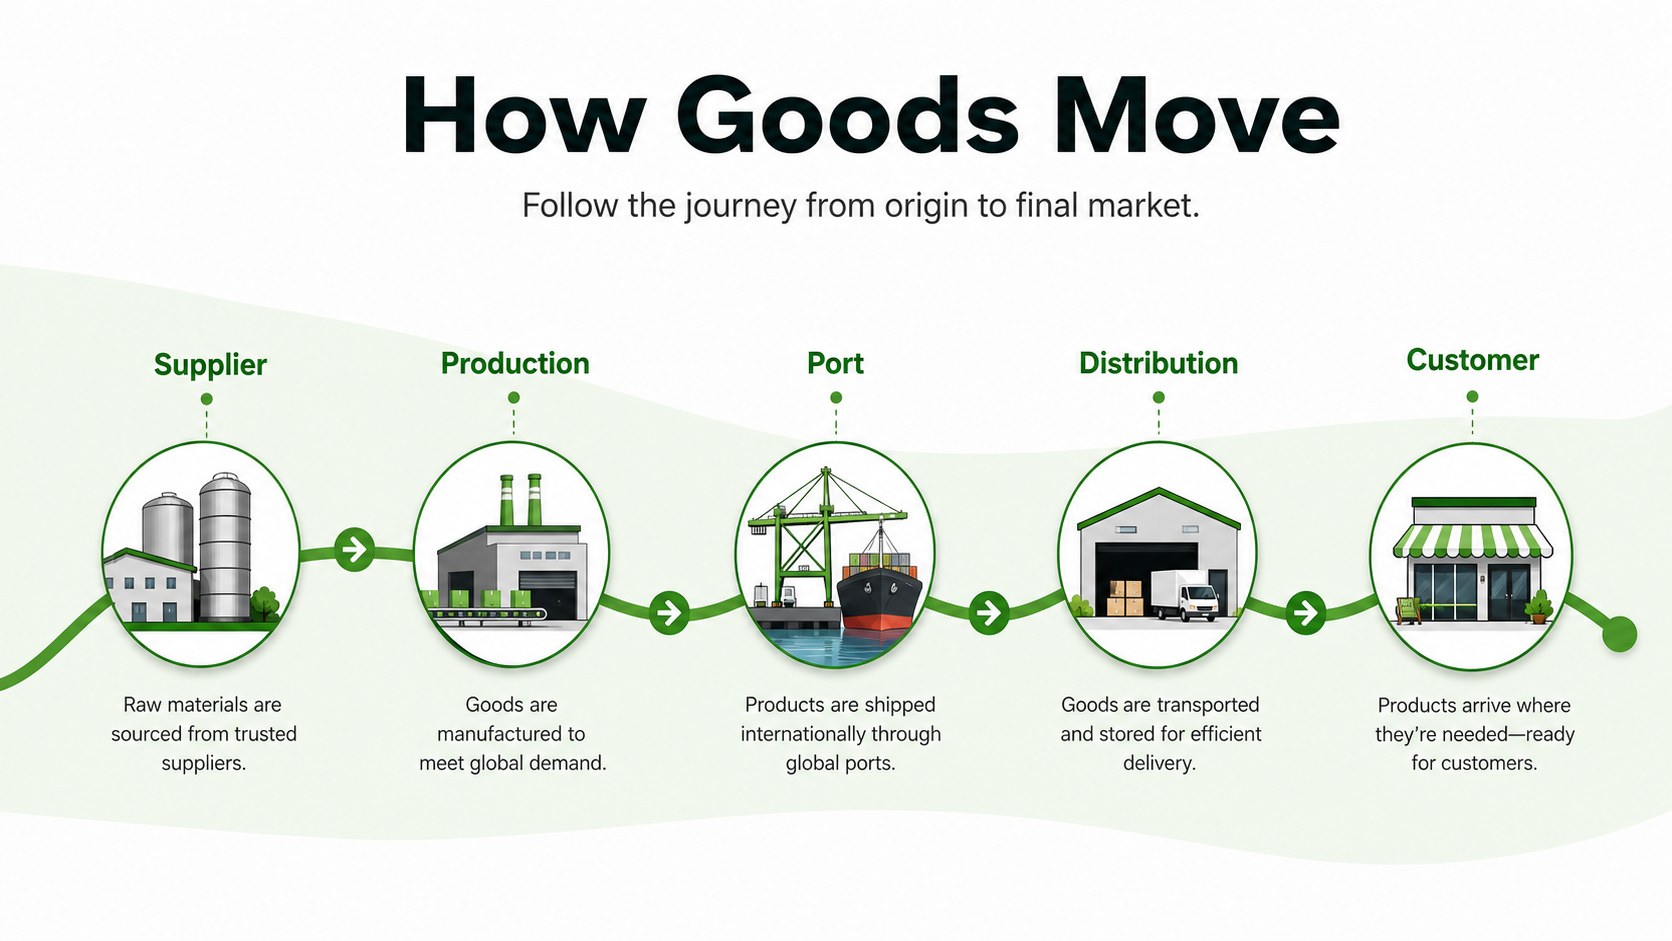
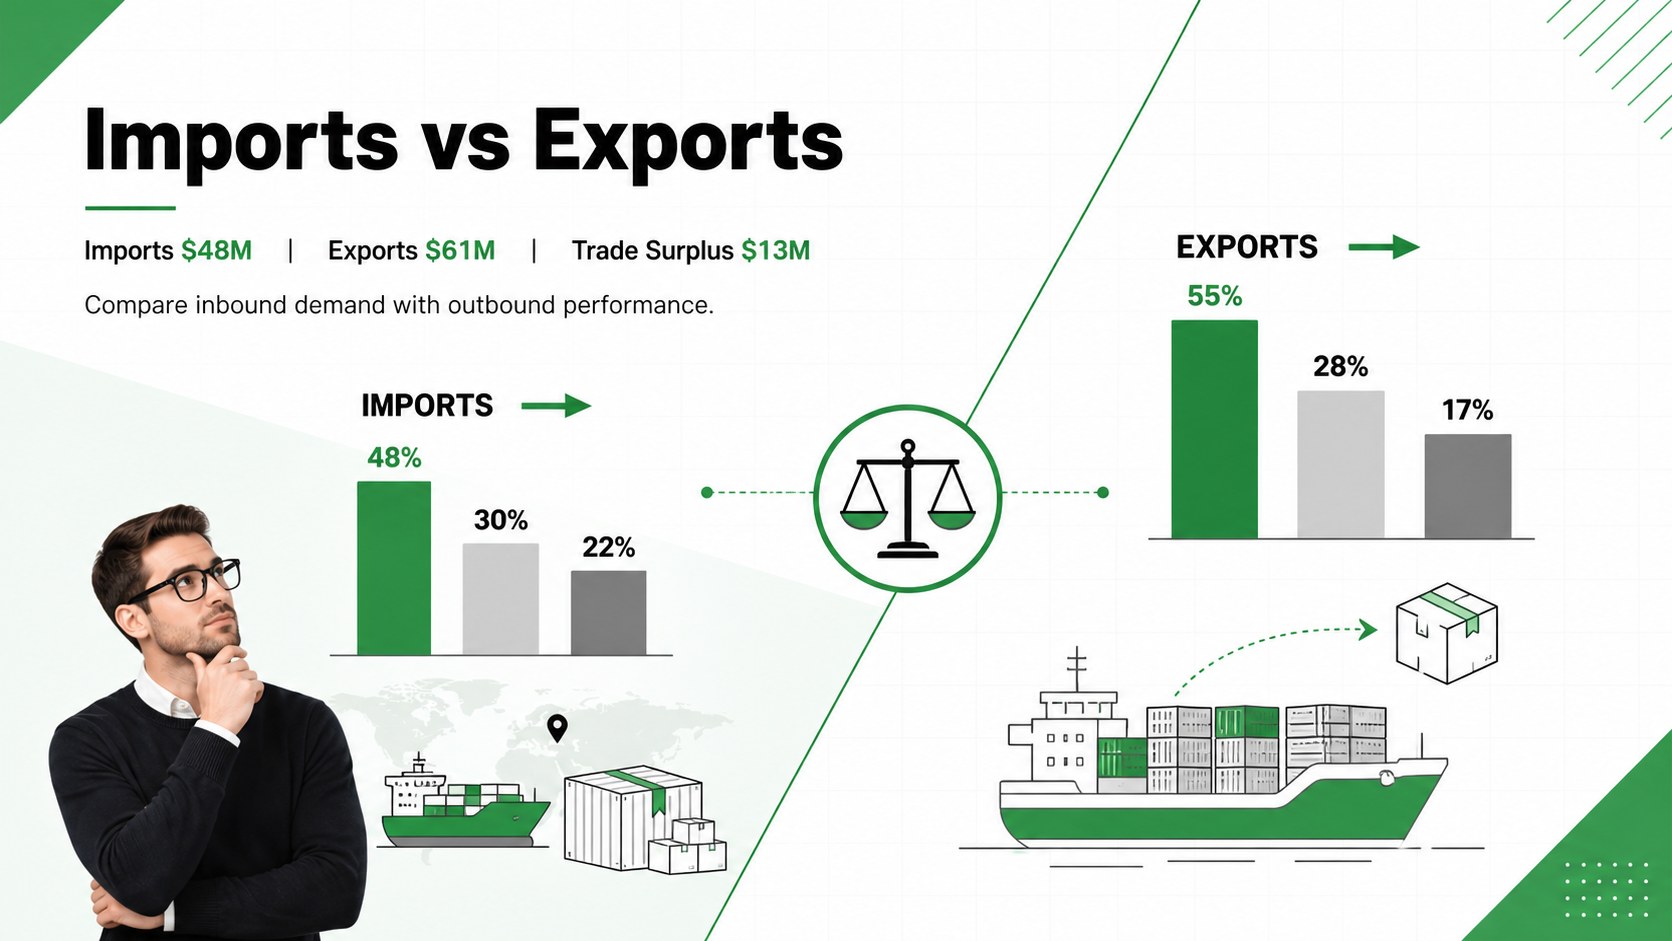
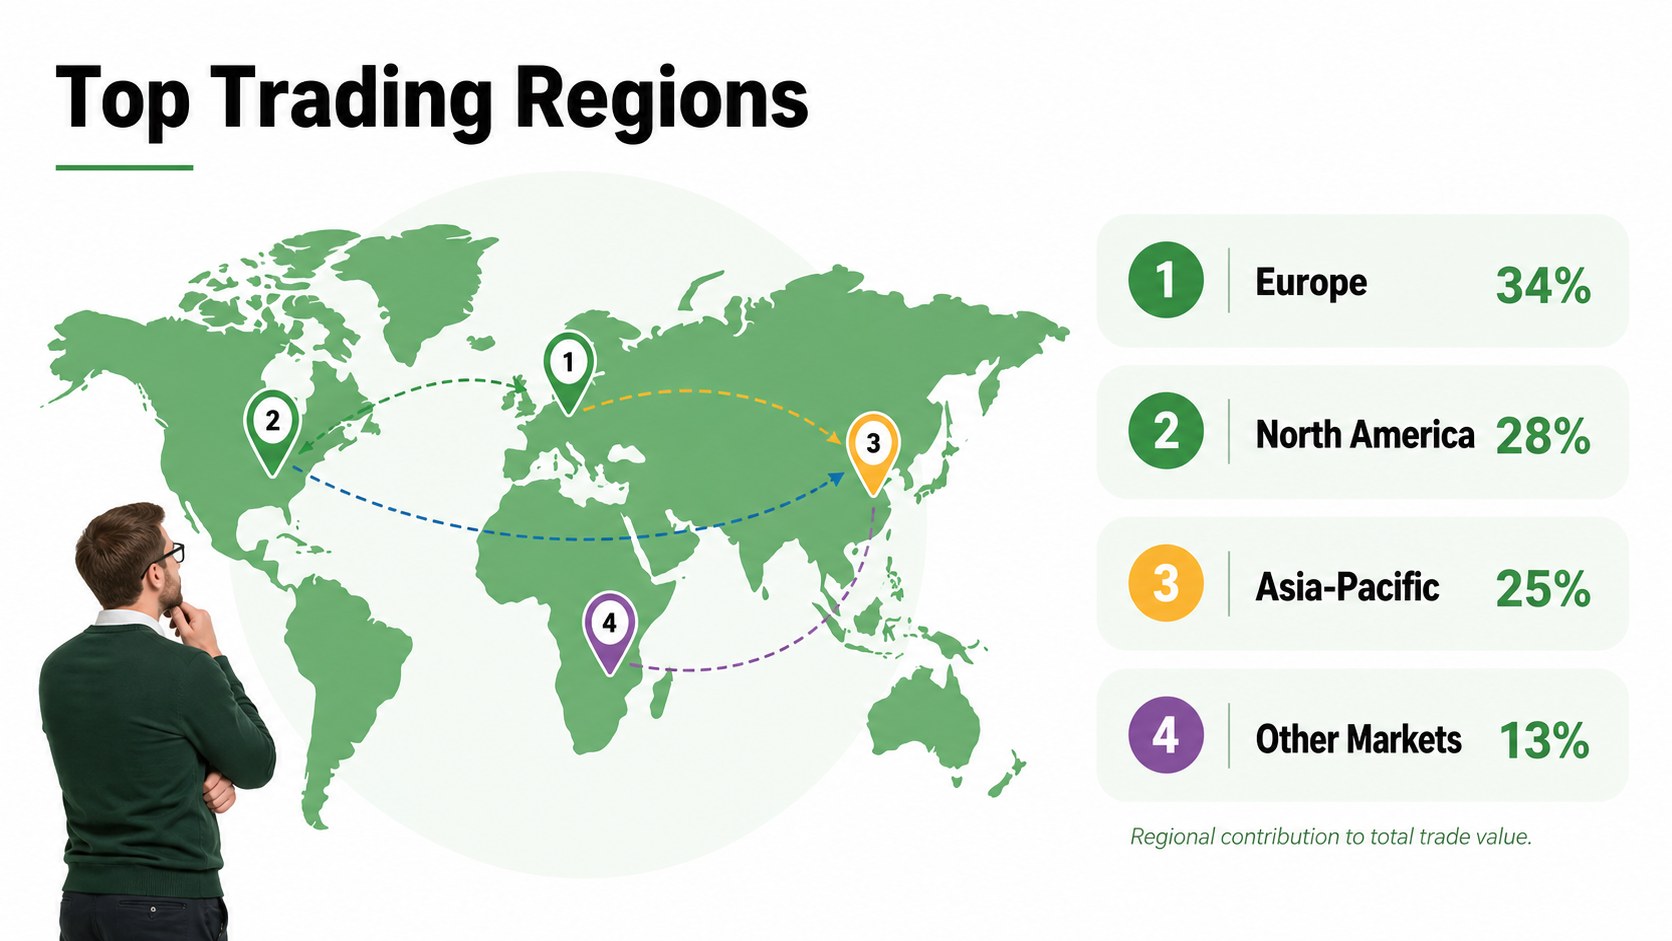
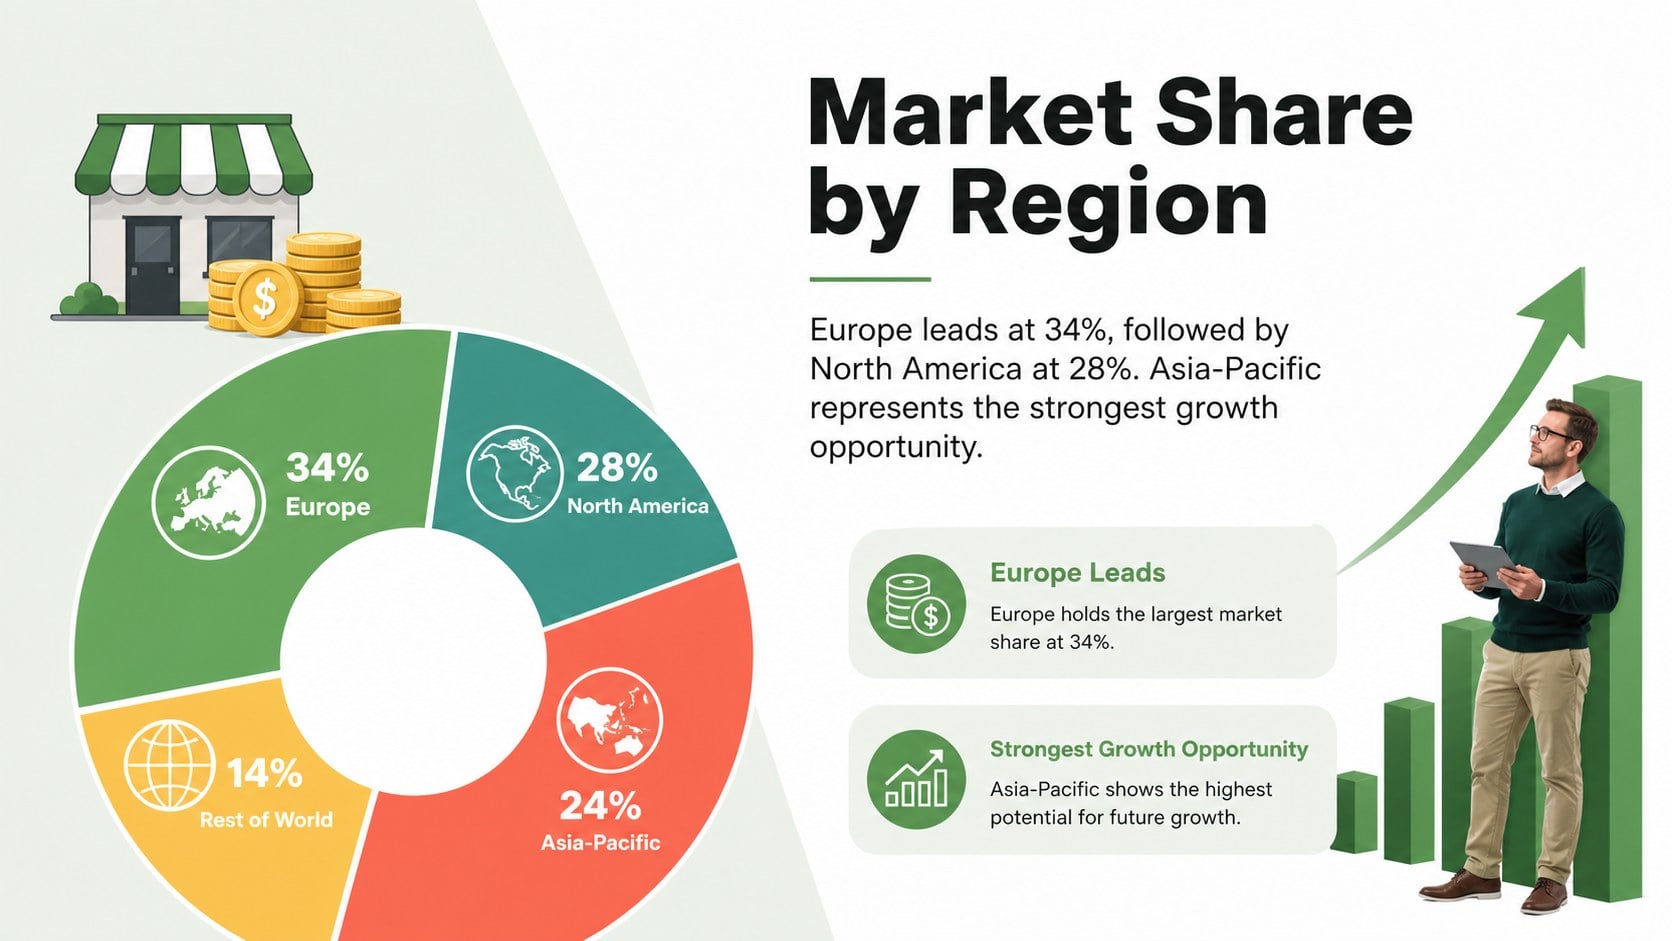
Turn complicated trade figures into a focused visual narrative with this global commerce infographic deck. Its clean white canvas, fresh green accents, black typography, and colorful illustrations help audiences understand imports, exports, market movement, and supply chain relationships without wading through dense tables. Use it as an import export presentation template for reports, briefings, proposals, or classroom discussions.
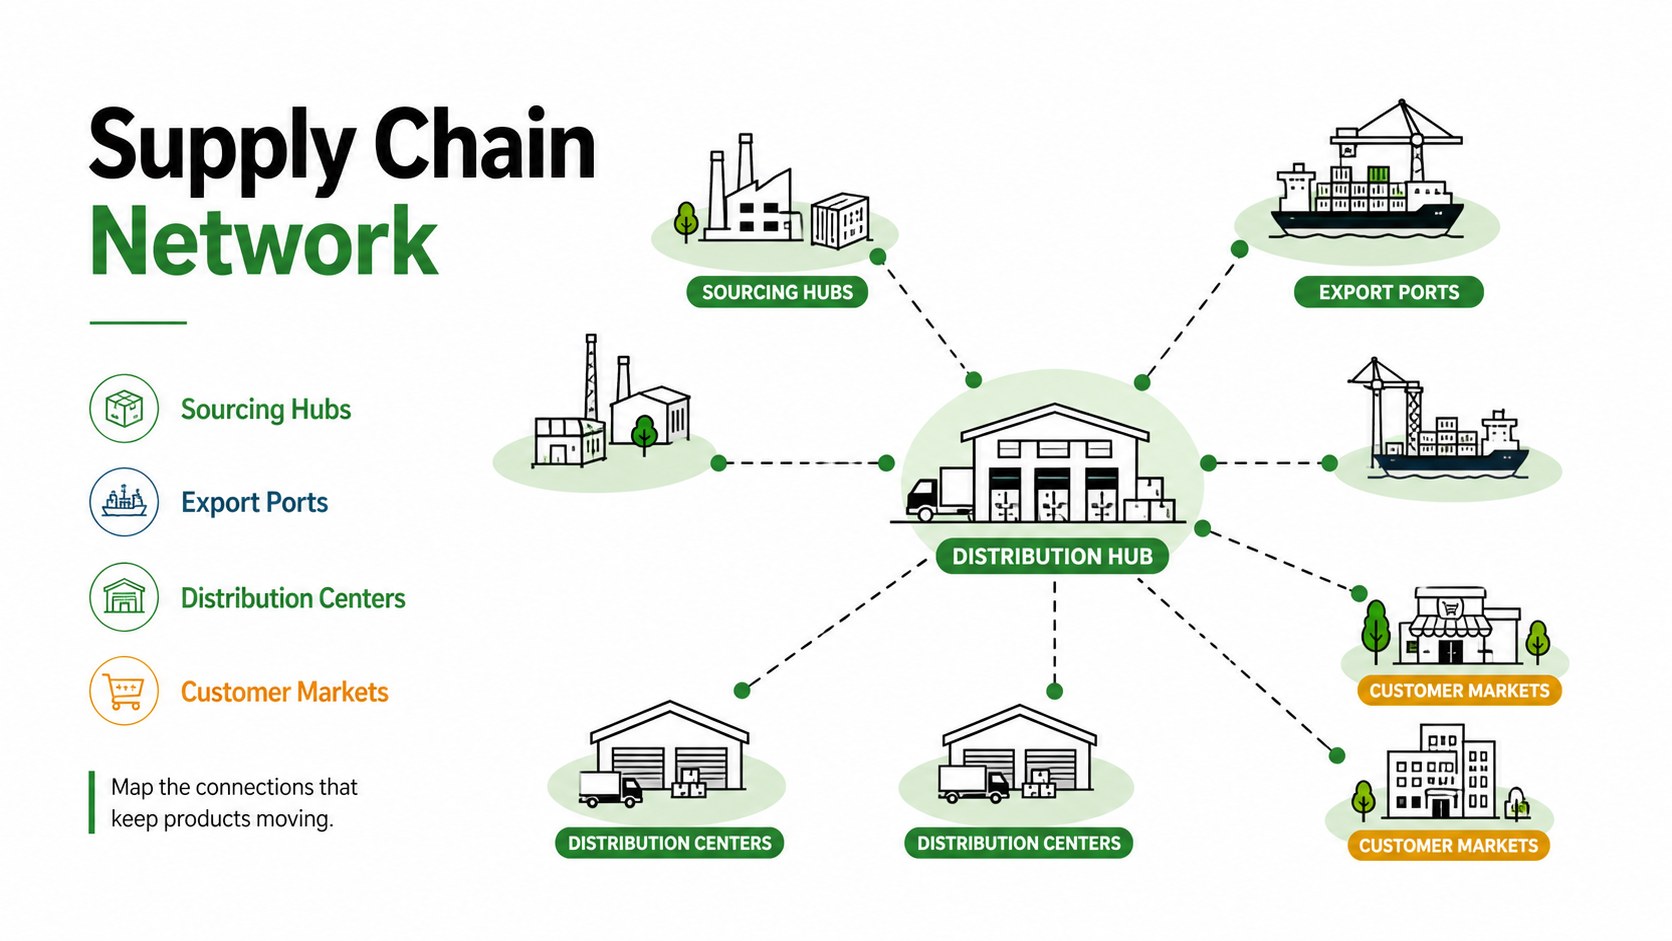
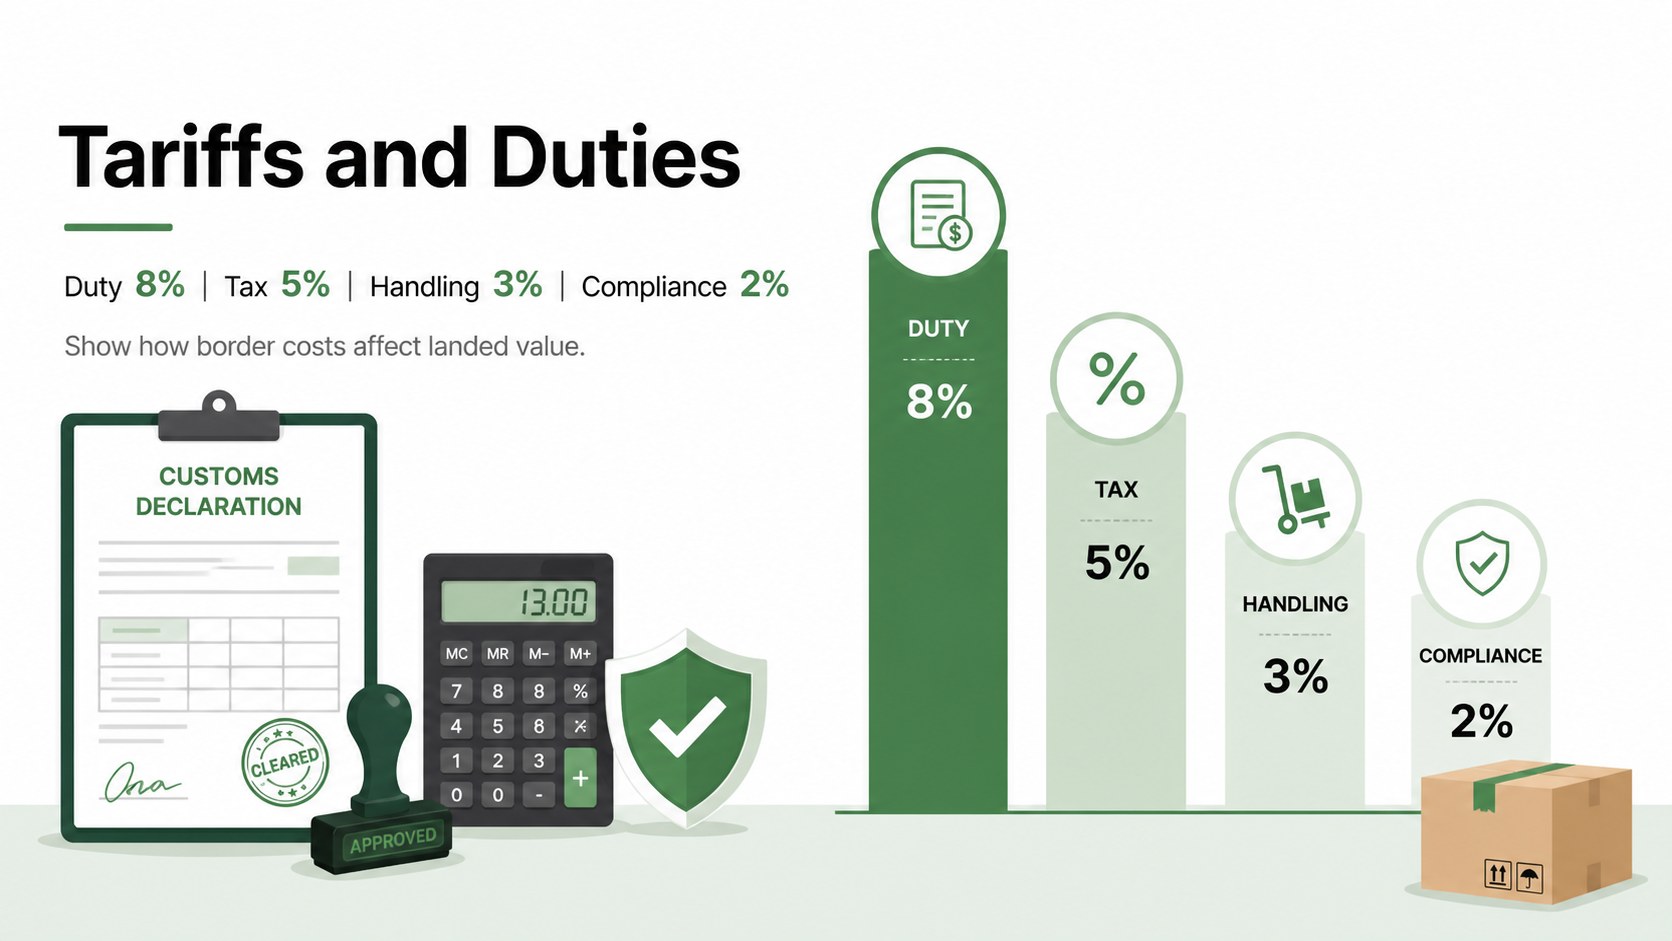
The deck includes 14 adaptable layouts covering trade snapshots, goods movement, regional comparisons, market share, supply networks, tariffs, trade balances, product categories, route analysis, risks, and closing insights. Maps, timelines, diagrams, charts, and percentage graphics provide a flexible foundation for international commerce data visualization. Every slide uses a consistent minimalist system, making it easy to replace sample figures, adjust labels, recolor graphics, and reorganize sections around your own research.
Designed for business analysts, logistics teams, consultants, educators, exporters, and economic development groups, these global supply chain infographic slides work in both PowerPoint and Google Slides. Present quarterly trade performance, explain cross-border operations, compare target markets, or summarize policy impacts with a polished deck that keeps data central. The 16:9 format is ready for meetings, webinars, conference screens, and online sharing.
Perfect for: quarterly trade performance report; export market opportunity briefing; global supply chain review; customs and tariff overview; international business lesson; logistics conference presentation.
Frequently asked questions
Can I edit the charts and trade figures? Yes. Replace the sample values, labels, icons, and chart elements with your own commerce data. Colors and typography can also be adjusted to match an organization or report.
Practical details
Yes. Replace the sample values, labels, icons, and chart elements with your own commerce data. Colors and typography can also be adjusted to match an organization or report.
The deck is designed for PowerPoint and Google Slides. Core layouts, text boxes, shapes, and visual hierarchy remain editable on both platforms.
Yes. Update the maps, product categories, route labels, currencies, and regional comparisons for your target market. Slides can be duplicated or reordered to fit a country profile, sector report, or trade proposal.
Yes. Dedicated layouts support sourcing networks, shipping routes, regional flows, risk factors, and logistics comparisons. They can be combined with the market and trade balance slides for a complete supply chain briefing.
Keep exploring
15Shape your publishing concept with an indie magazine startup pitch deck featuring pastel gradients, bold collage layouts, and editable planning slides.
 16
Build clear project stories with the Icon Grid Teamwork Theme, a flexible blue illustrated deck for proposals, strategy updates, and team meetings.
 3
Turn priorities into an actionable plan with an annual goals roadmap infographic, featuring editable orange and teal layouts for PowerPoint and Google Slides.
 15
Create an Annual Achievement Report Presentation with colorful geometric layouts for milestones, results, lessons, and priorities in PowerPoint or Google Slides.
 15
Turn results into a focused annual performance evaluation report with dark 3D slides for KPIs, achievements, feedback, and next-step goals for teams.
 15
Guide a focused annual recap with Business Results Retrospective Slides, a muted brown-and-blue template for PowerPoint and Google Slides.
 6
Turn complex plans into clear visual stories with Color-Coded Workflow Path Slides, an editable set for project updates, roadmaps, and team briefings.
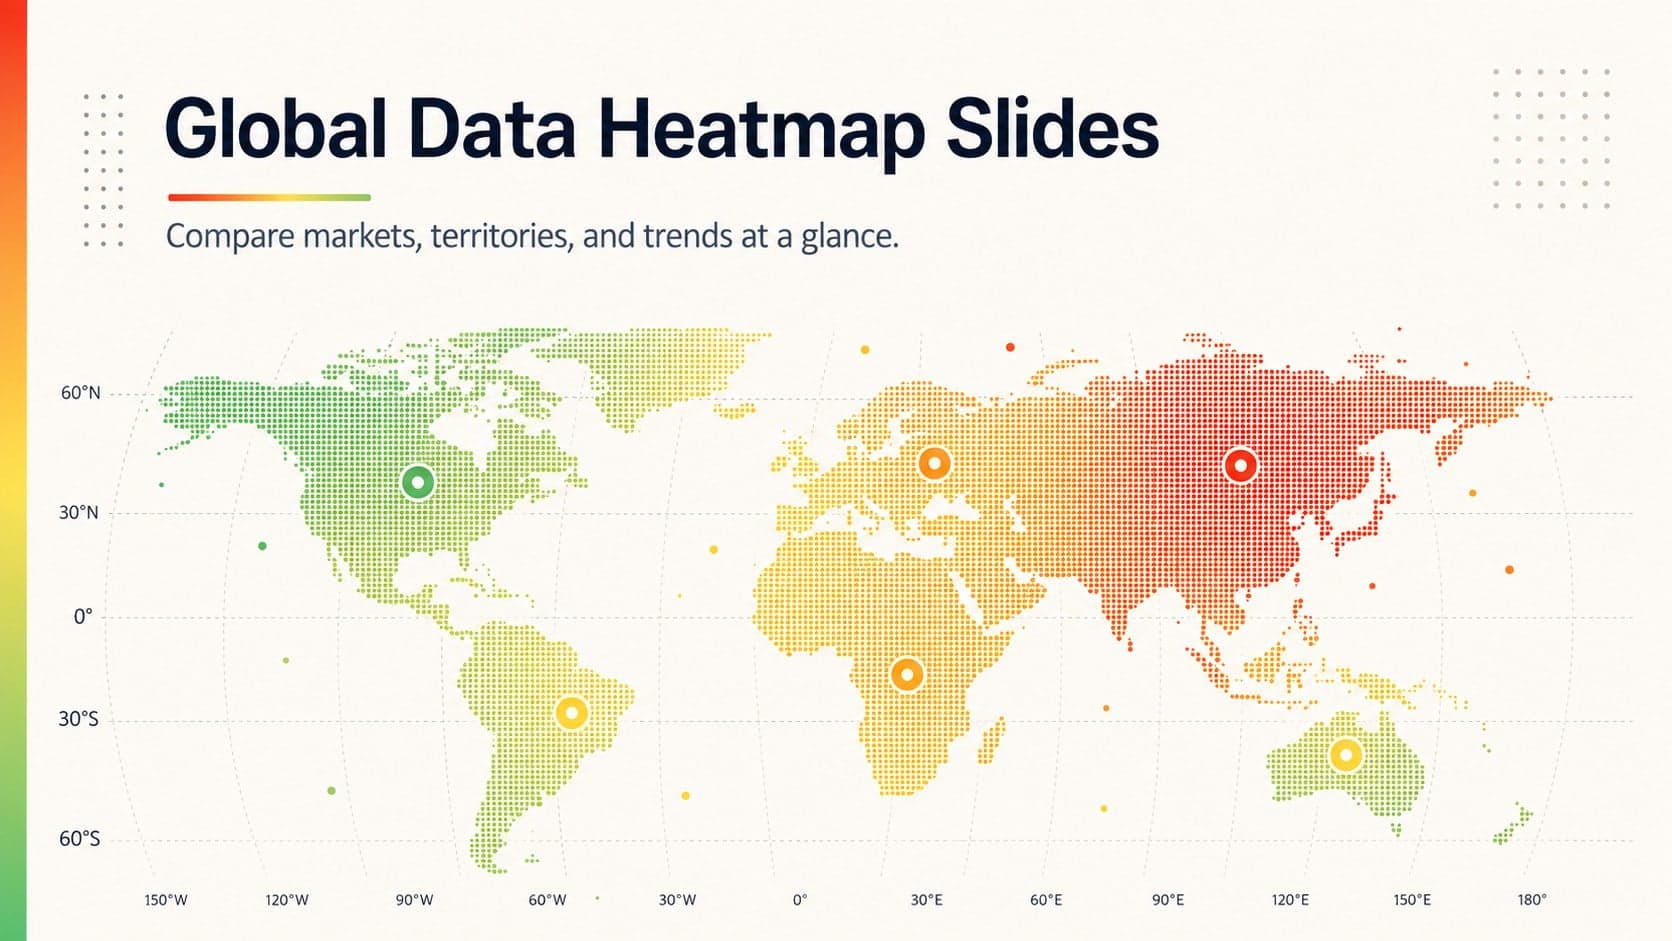 6
Compare regional performance at a glance with Global Data Heatmap Slides, a clean multicolor deck designed for editable PowerPoint and Google Slides.