
 15
presentation
Indie Magazine Startup Pitch Deck
Shape your publishing concept with an indie magazine startup pitch deck featuring pastel gradients, bold collage layouts, and editable planning slides.
Google SlidesPowerPoint
presentation · English
Build a sharp black data storytelling deck for analytics reports, project reviews, and stakeholder meetings with editable charts and clear visual layouts.



Design notes
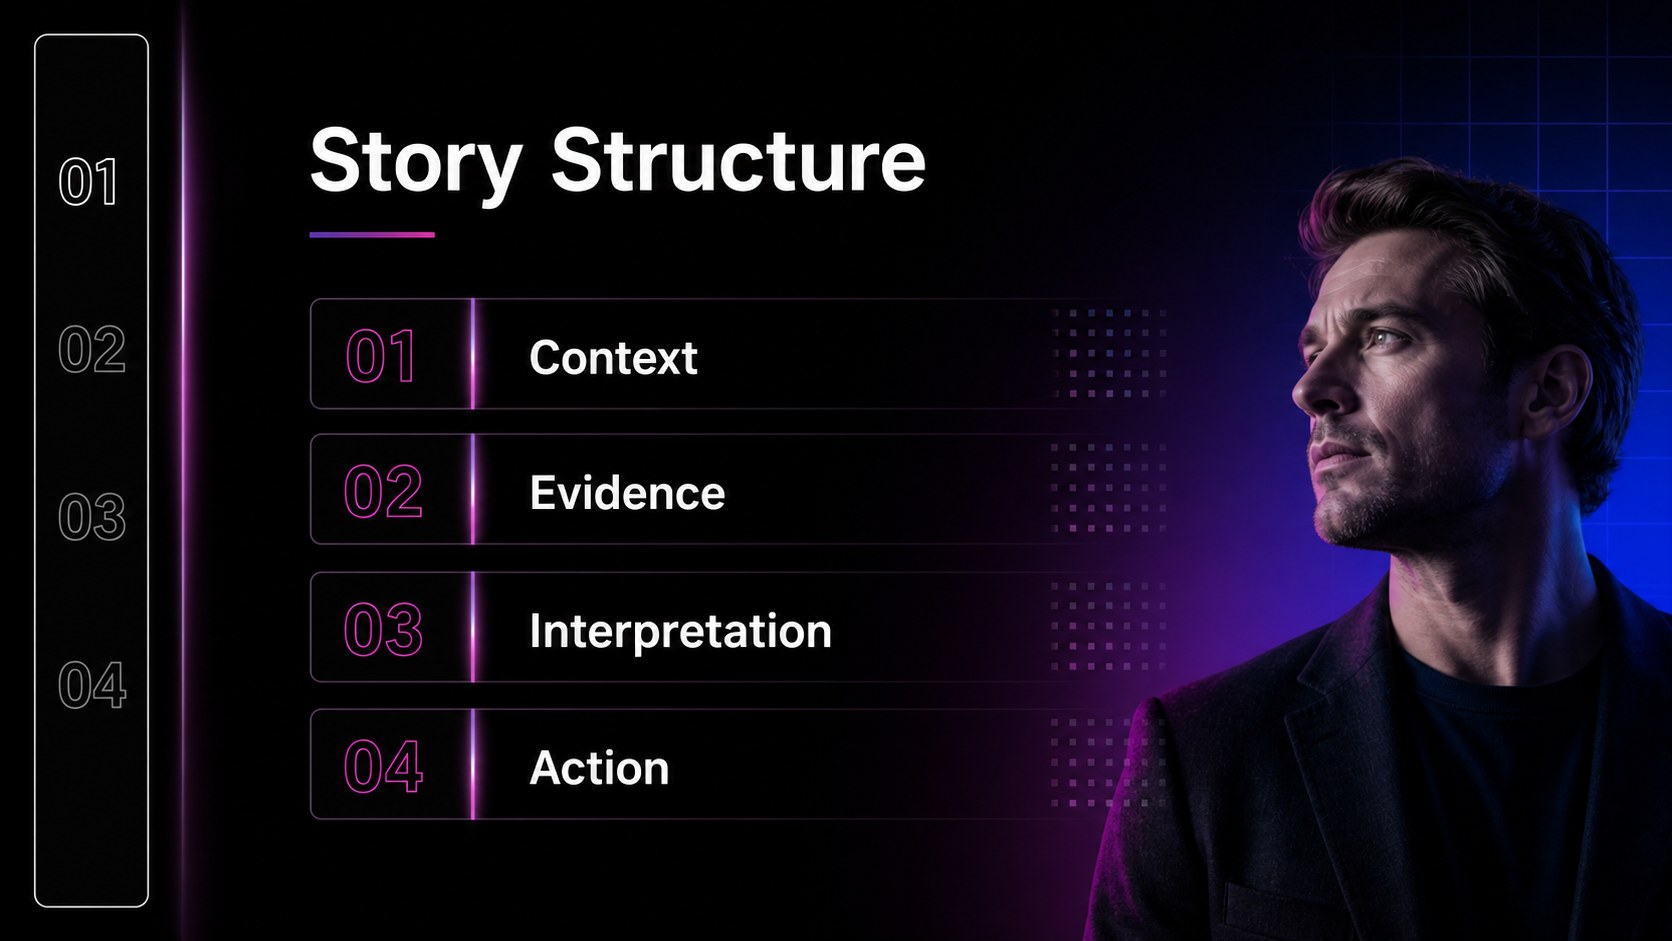
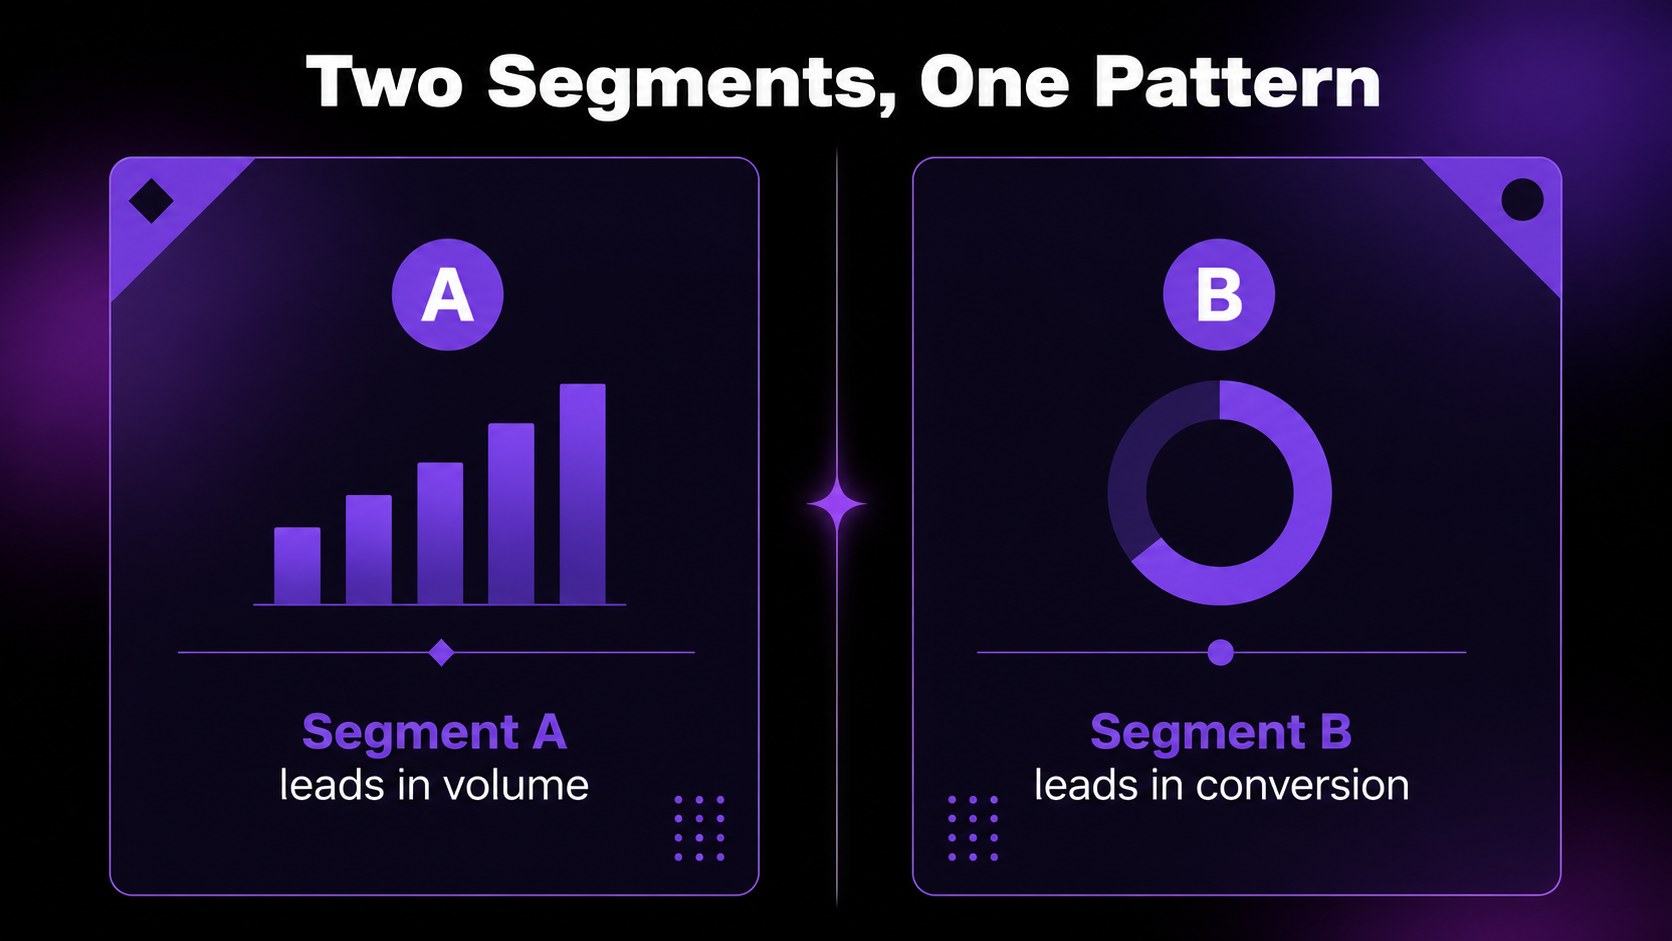
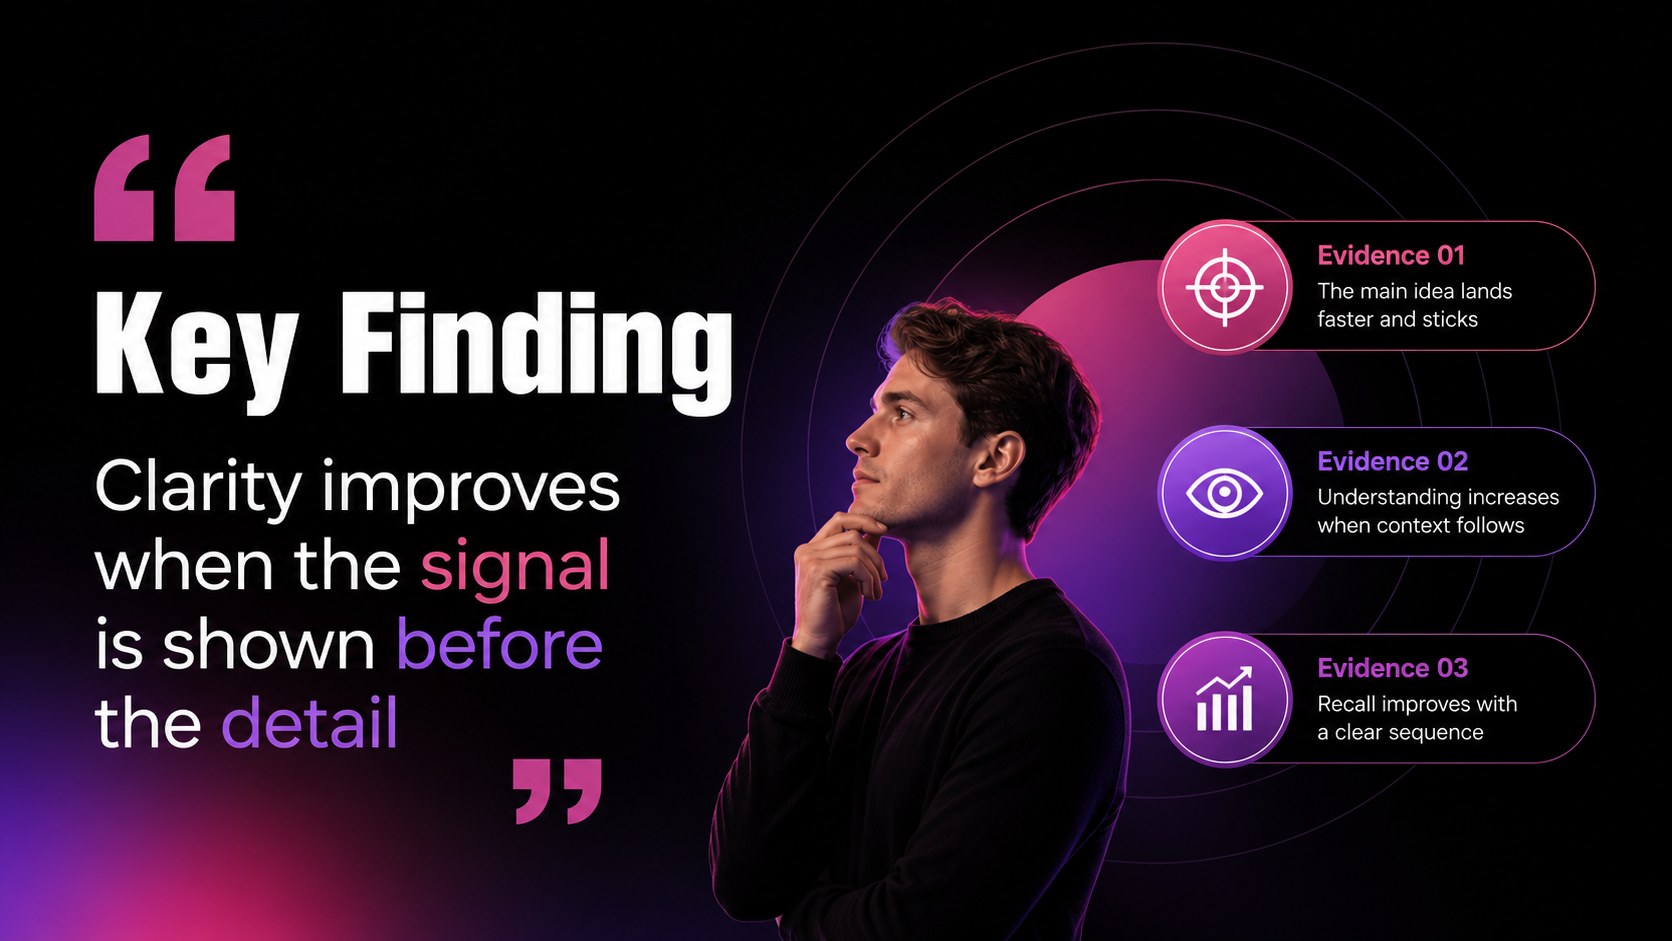
Turn complex datasets into focused visual narratives with a polished black data storytelling deck. Its cool black gradient, crisp typography, and structured information design help analysts, consultants, researchers, and business teams explain findings without overwhelming the audience. Use the layouts to move from a project overview to evidence, interpretation, and recommended action.
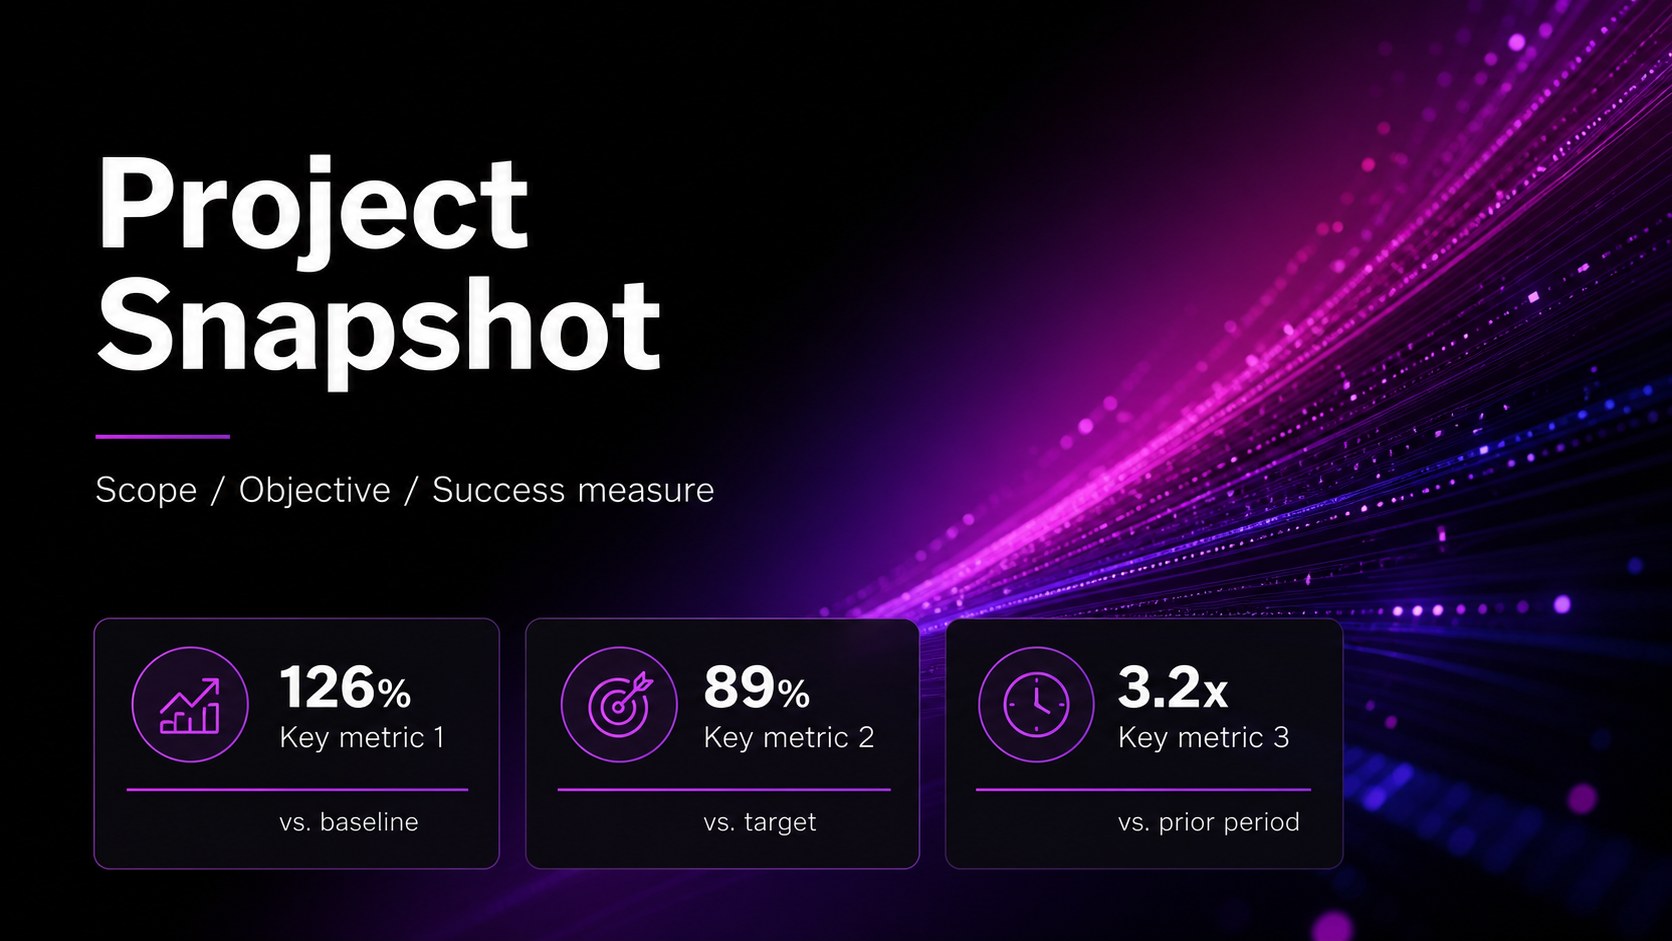
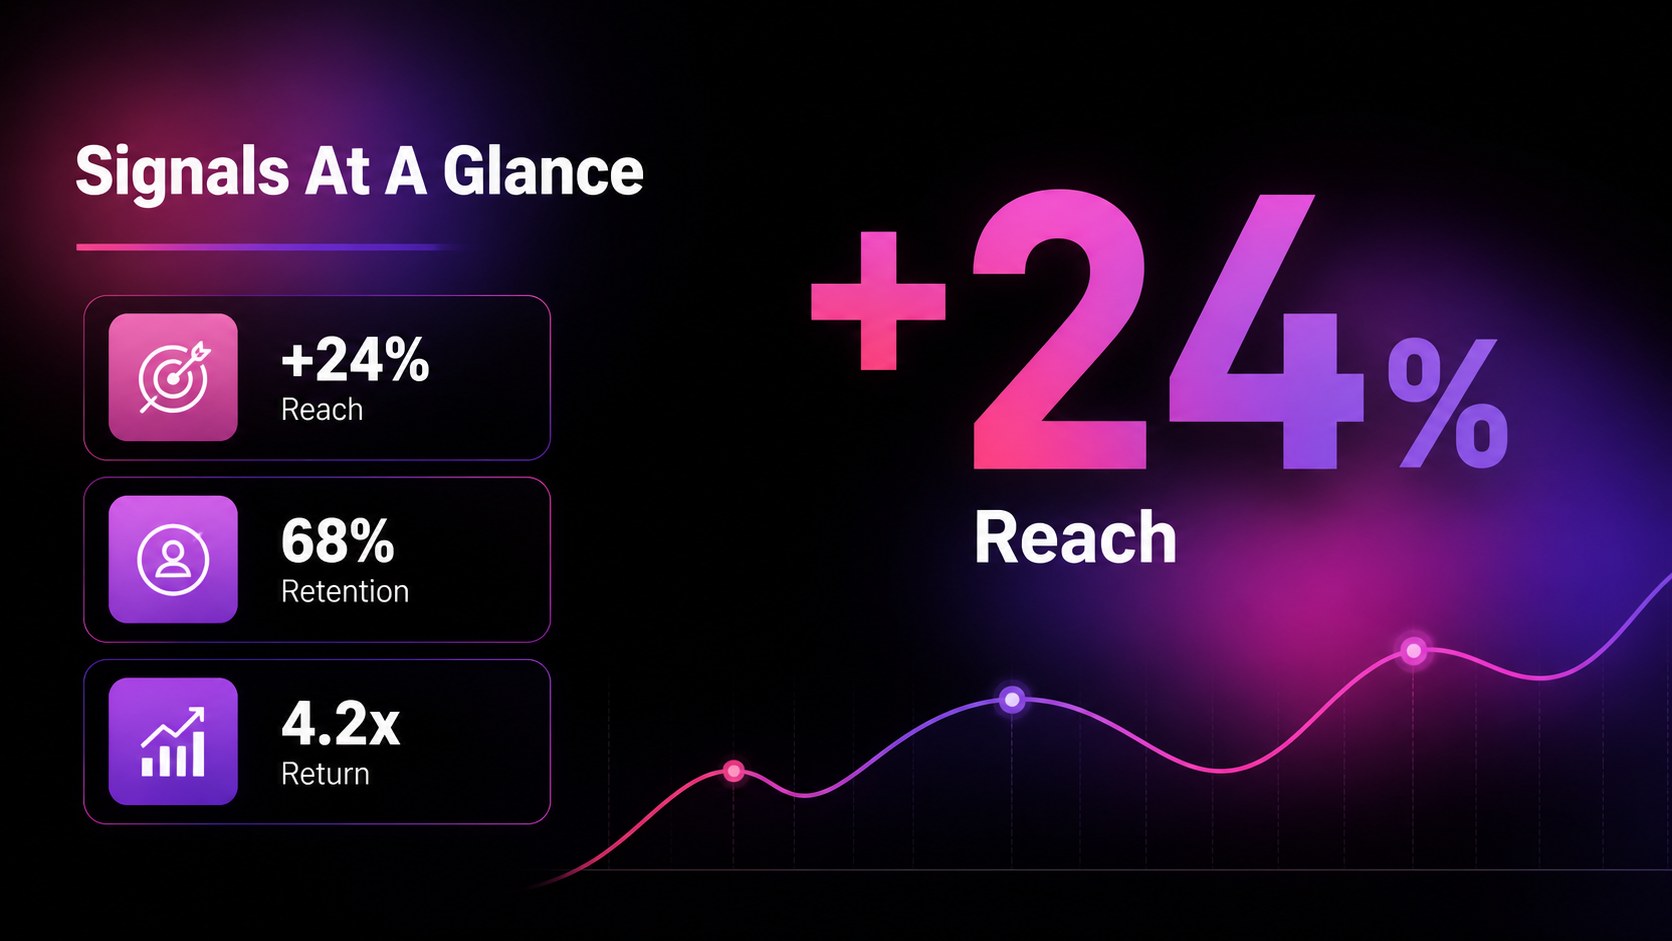
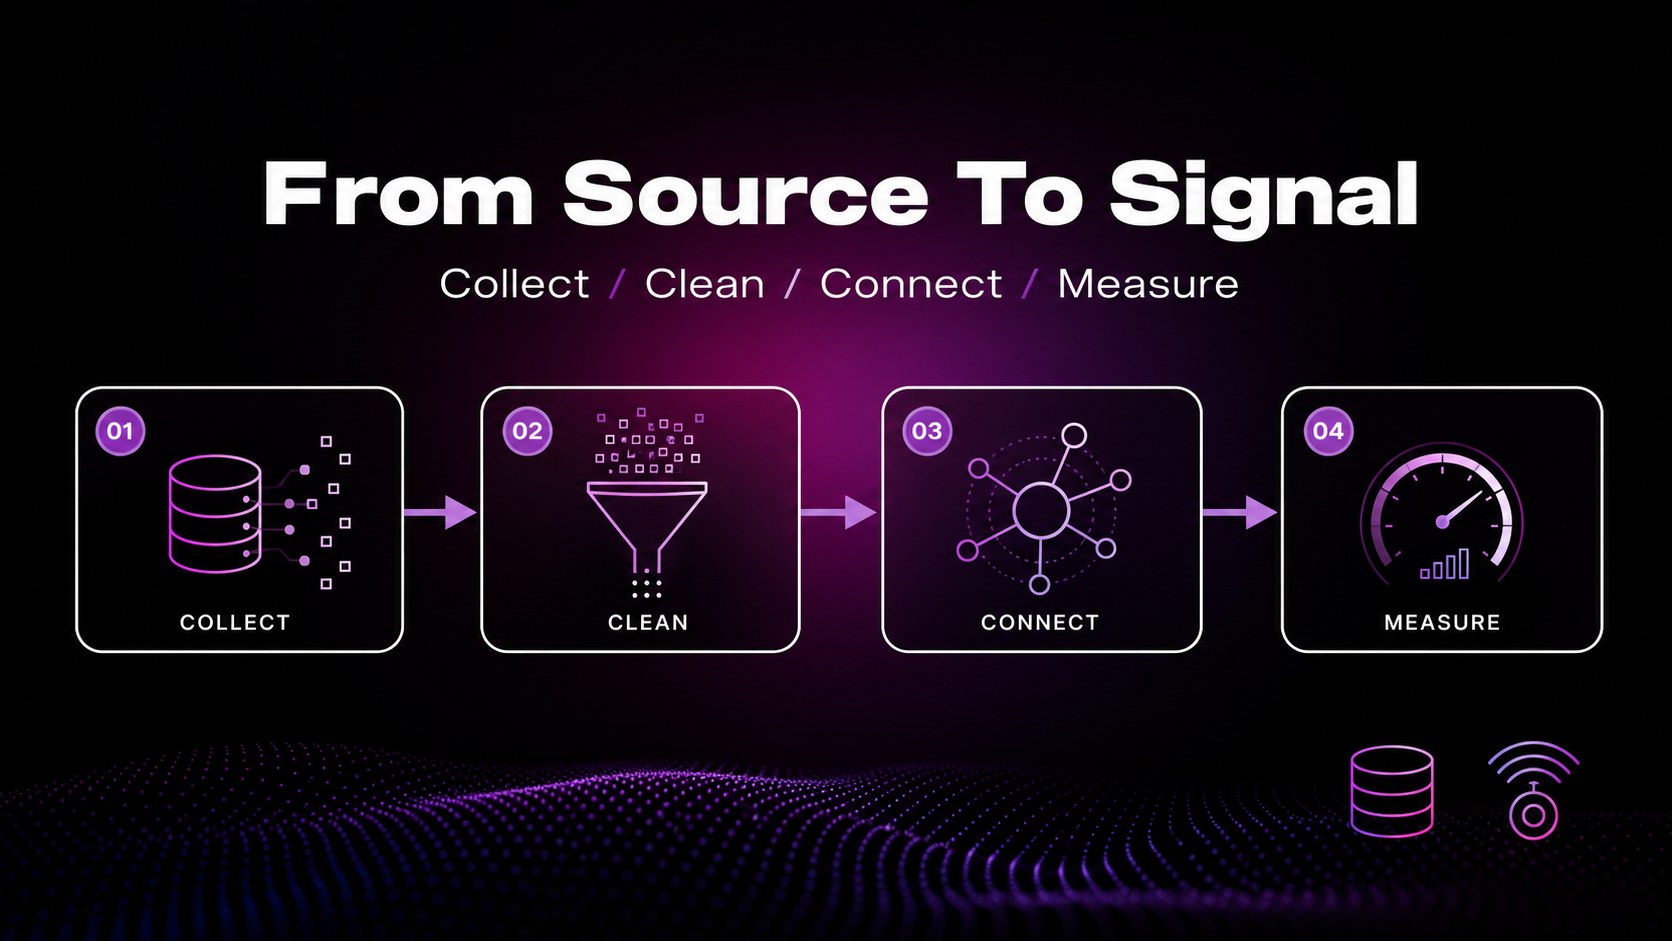
Inside, you will find 15 editable 16:9 slides with chart layouts, KPI highlights, comparison panels, data model diagrams, process flows, research summaries, and conclusion pages. The visual system is built around black with restrained contrast, clean lines, and modern infographic details, making it suitable for executive reporting and technical presentations alike. The deck works well as a data analysis presentation template for monthly reporting, project readouts, and business intelligence storytelling.
Edit the slides in PowerPoint or Google Slides, replace sample figures with your own metrics, and adjust labels, charts, shapes, and typography to match your project. It is a practical choice for an analytics project review, a stakeholder update, a consulting recommendation, or a research briefing where clarity matters as much as visual impact.
Perfect for: analytics project review; business intelligence report; stakeholder performance update; research findings briefing; consulting recommendation pitch.
Frequently asked questions
Can I edit this deck in PowerPoint? Yes. The presentation is designed for PowerPoint editing, including text, charts, shapes, colors, and layout elements. Replace the sample data with your own project information before presenting.
Practical details
Yes. The presentation is designed for PowerPoint editing, including text, charts, shapes, colors, and layout elements. Replace the sample data with your own project information before presenting.
Yes, you can open and edit the presentation in Google Slides. Some fonts or advanced animation effects may need minor adjustments after import.
Yes. The black foundation can be adapted with your brand colors while preserving the contrast and hierarchy of the layouts. Update chart accents, headings, and graphic elements consistently across the deck.
The layouts support KPI summaries, comparisons, trends, process diagrams, data models, and research conclusions. They are suitable for business reporting, analytics reviews, technical briefings, and project presentations.
Keep exploring
15Shape your publishing concept with an indie magazine startup pitch deck featuring pastel gradients, bold collage layouts, and editable planning slides.
 16
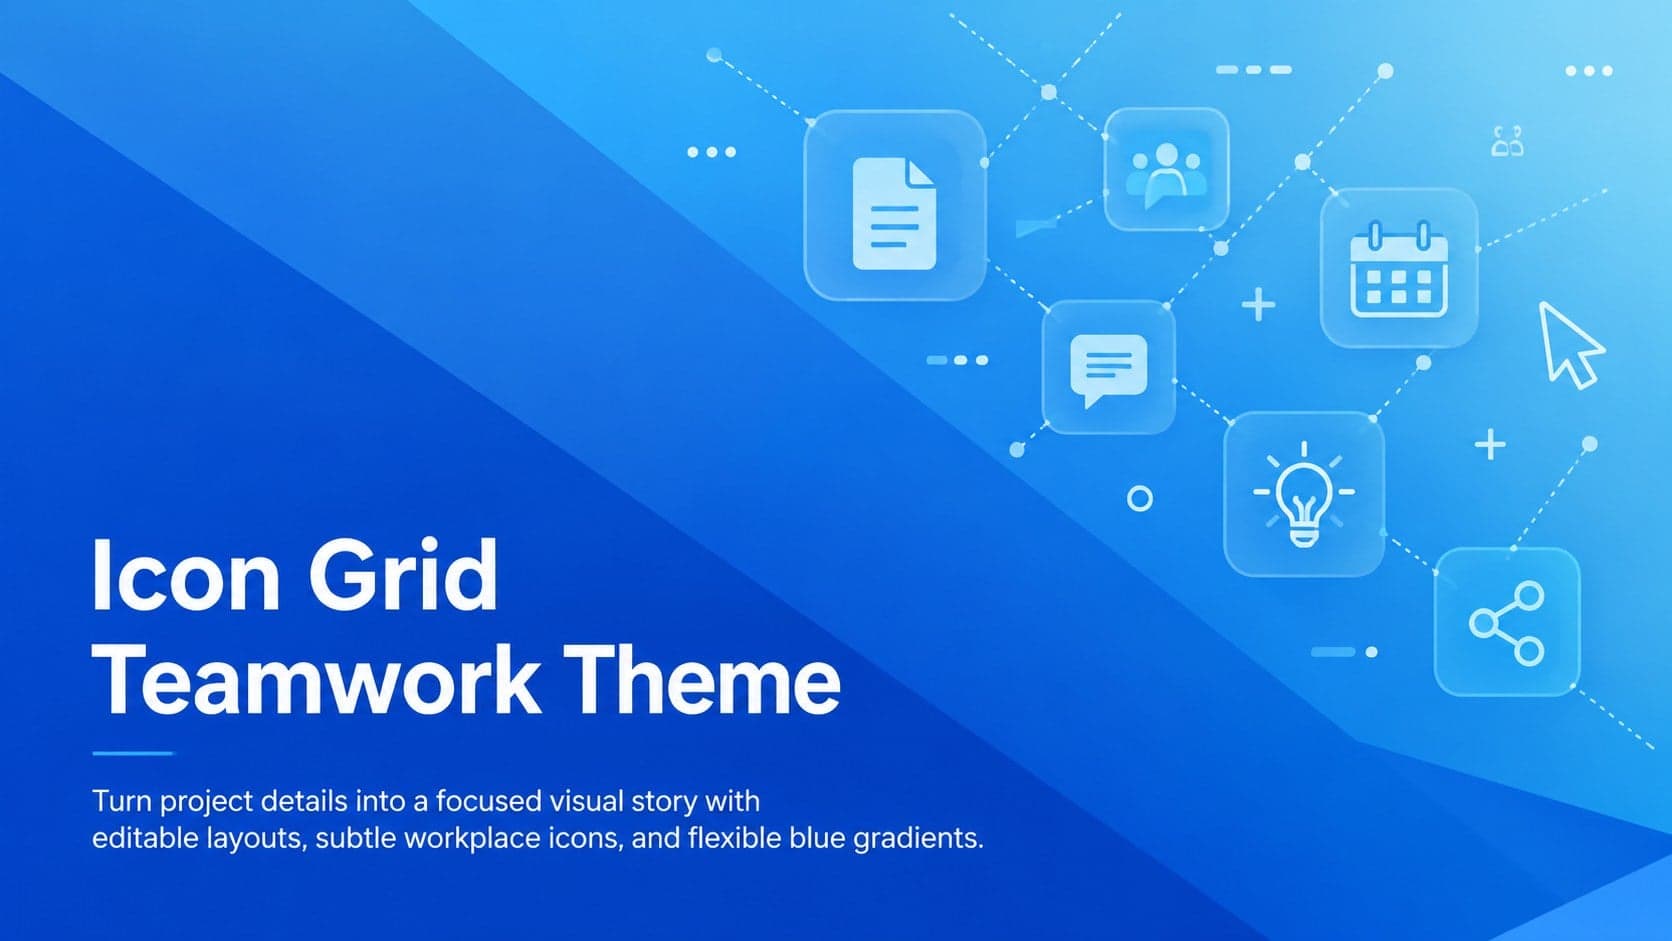
Build clear project stories with the Icon Grid Teamwork Theme, a flexible blue illustrated deck for proposals, strategy updates, and team meetings.
 3
Turn priorities into an actionable plan with an annual goals roadmap infographic, featuring editable orange and teal layouts for PowerPoint and Google Slides.
 15
Create an Annual Achievement Report Presentation with colorful geometric layouts for milestones, results, lessons, and priorities in PowerPoint or Google Slides.
 15
Turn results into a focused annual performance evaluation report with dark 3D slides for KPIs, achievements, feedback, and next-step goals for teams.
 15
Guide a focused annual recap with Business Results Retrospective Slides, a muted brown-and-blue template for PowerPoint and Google Slides.
 6
Turn complex plans into clear visual stories with Color-Coded Workflow Path Slides, an editable set for project updates, roadmaps, and team briefings.
 6
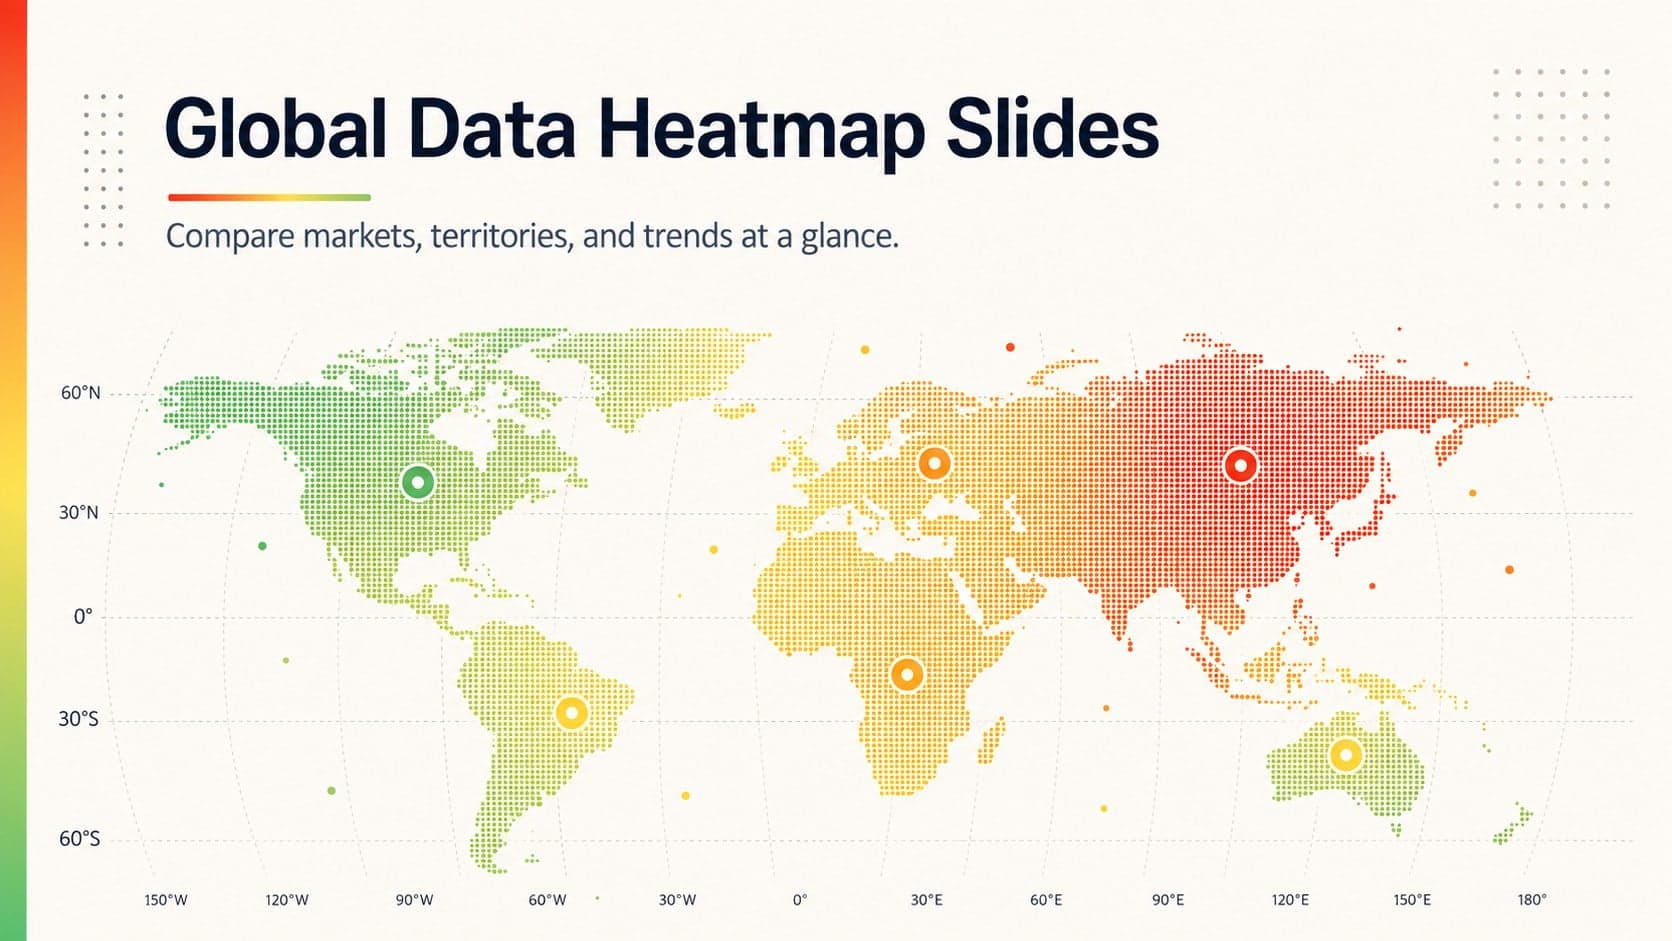
Compare regional performance at a glance with Global Data Heatmap Slides, a clean multicolor deck designed for editable PowerPoint and Google Slides.