
 6
6spreadsheet
Orange Year-End Recognition Certificate Set
Honor teams and individuals with an Orange Year-End Recognition Certificate Set featuring six editable designs for PowerPoint and Google Slides.
Google SlidesPowerPointExcel
spreadsheet · English
Build an annual sales planning spreadsheet for monthly targets, revenue scenarios, and clear team reviews in Excel or Google Sheets with flexible charts.
Design notes
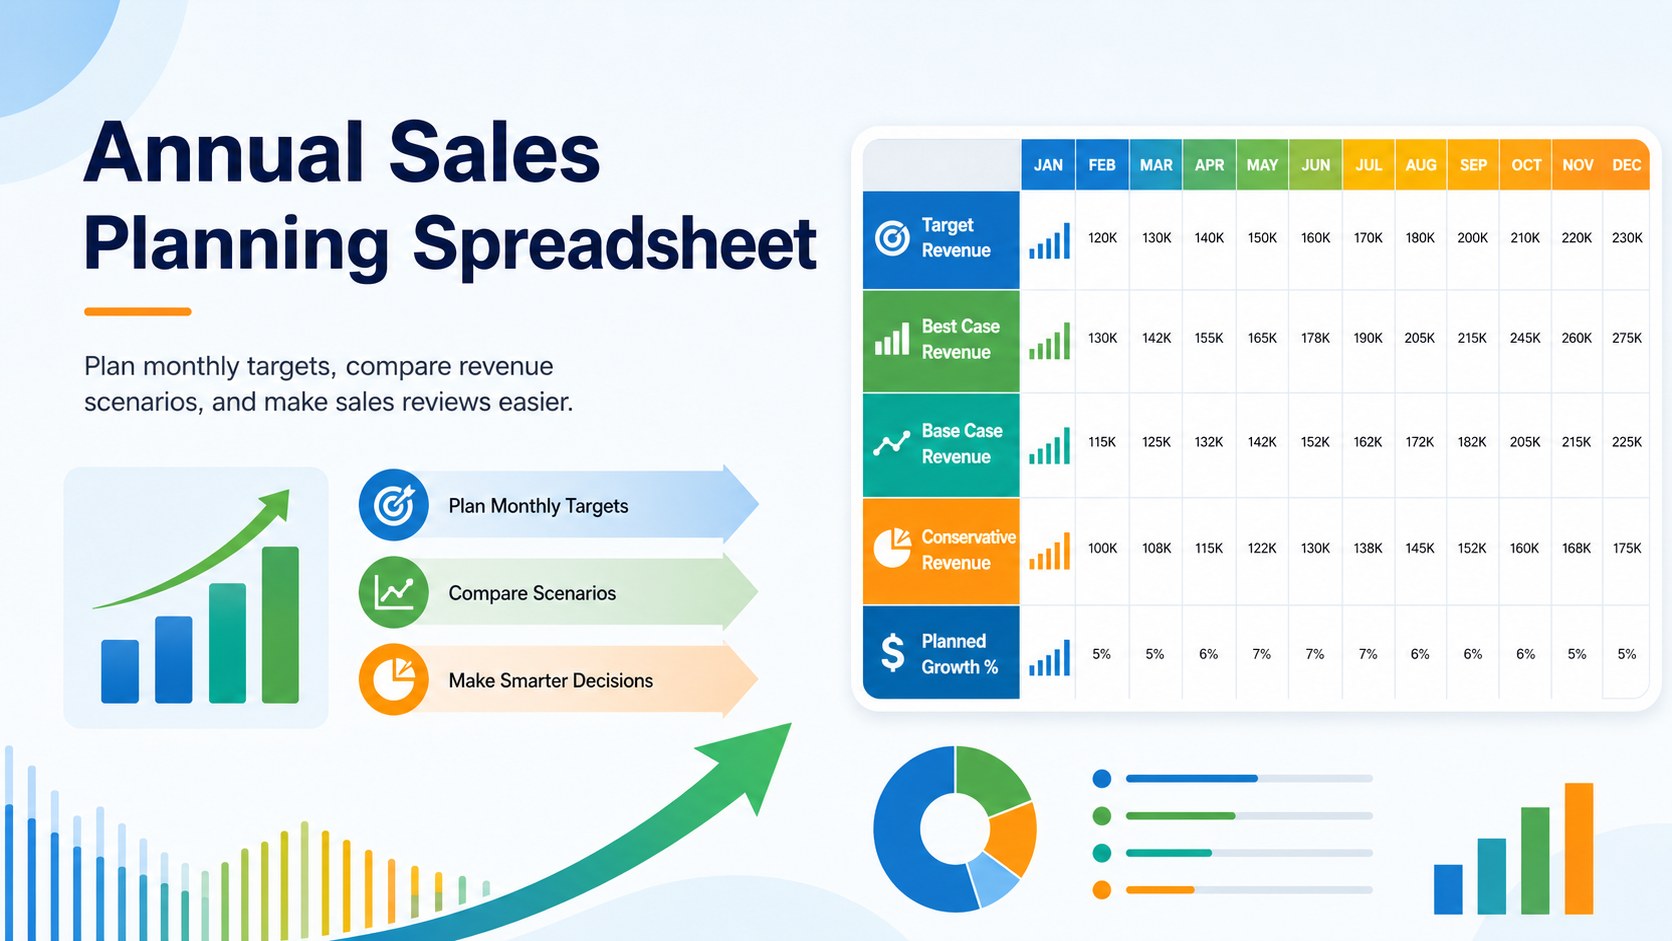
Annual Sales Planning Spreadsheet is a practical, colorful planning tool for turning revenue goals into a clear month-by-month view. Use it to organize targets, compare expected performance, and spot gaps before they affect your results. The blue, green, and orange palette gives the workbook an energetic modern look while keeping key figures easy to scan.
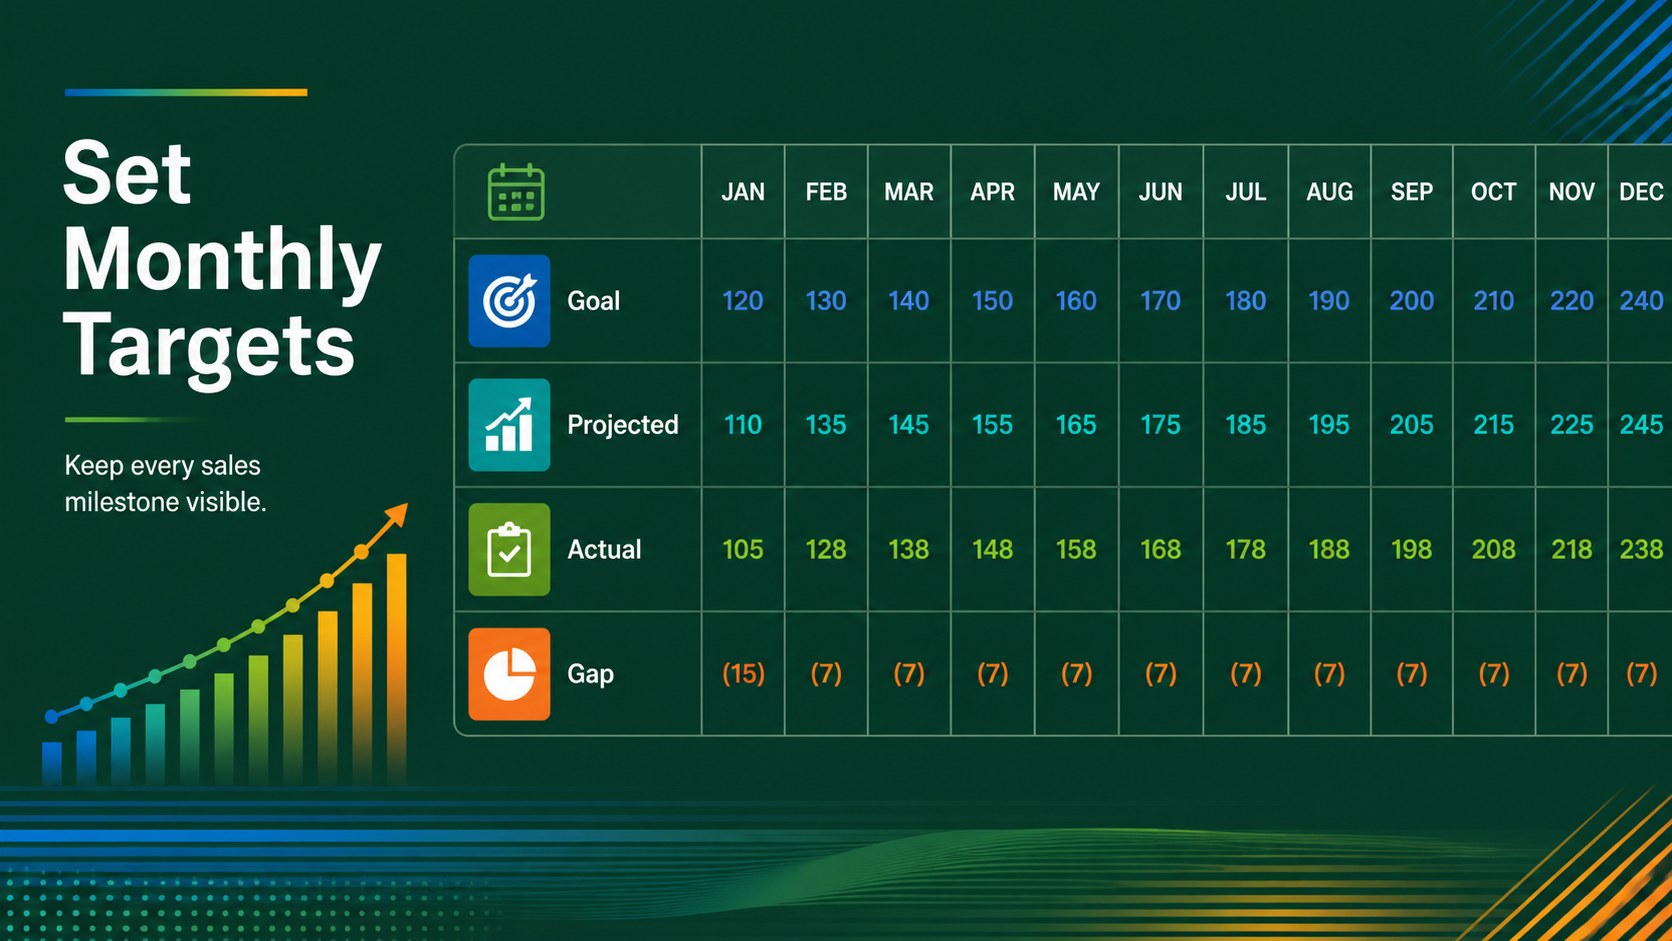
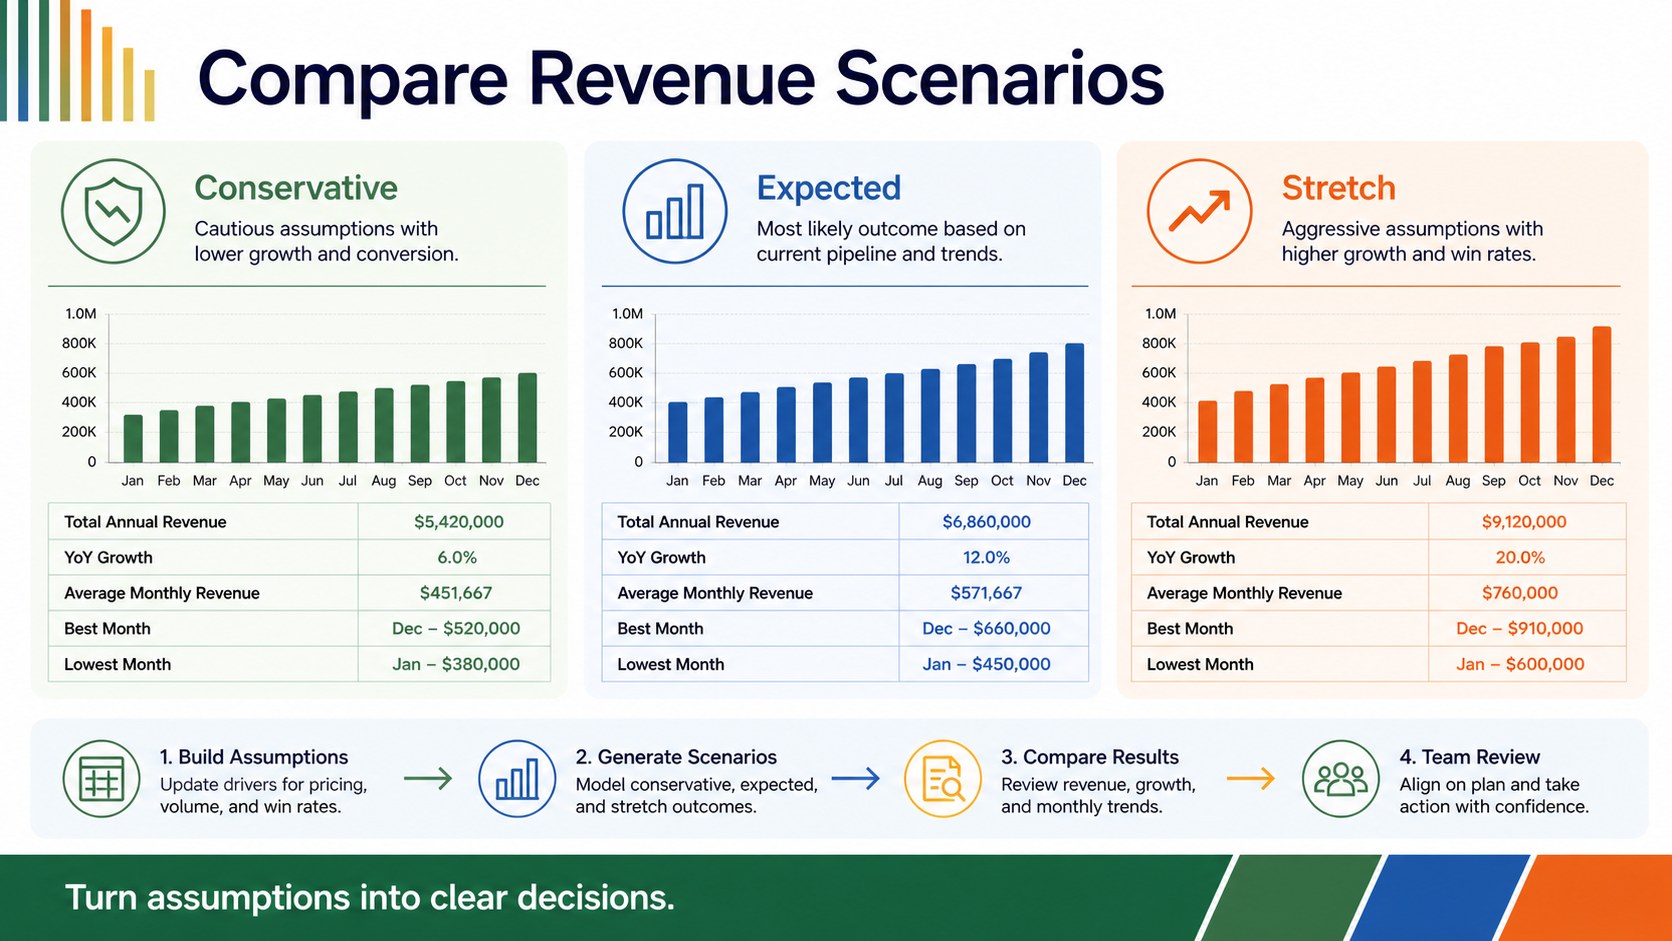
Inside, you will find editable planning areas for monthly targets, projected revenue, performance tracking, and summary comparisons. The layout works as a monthly sales target spreadsheet for individual contributors, sales managers, and growing teams. Add your own figures, labels, charts, and notes without rebuilding the structure. It can also support a revenue projection worksheet workflow when you need to present assumptions and outcomes together.
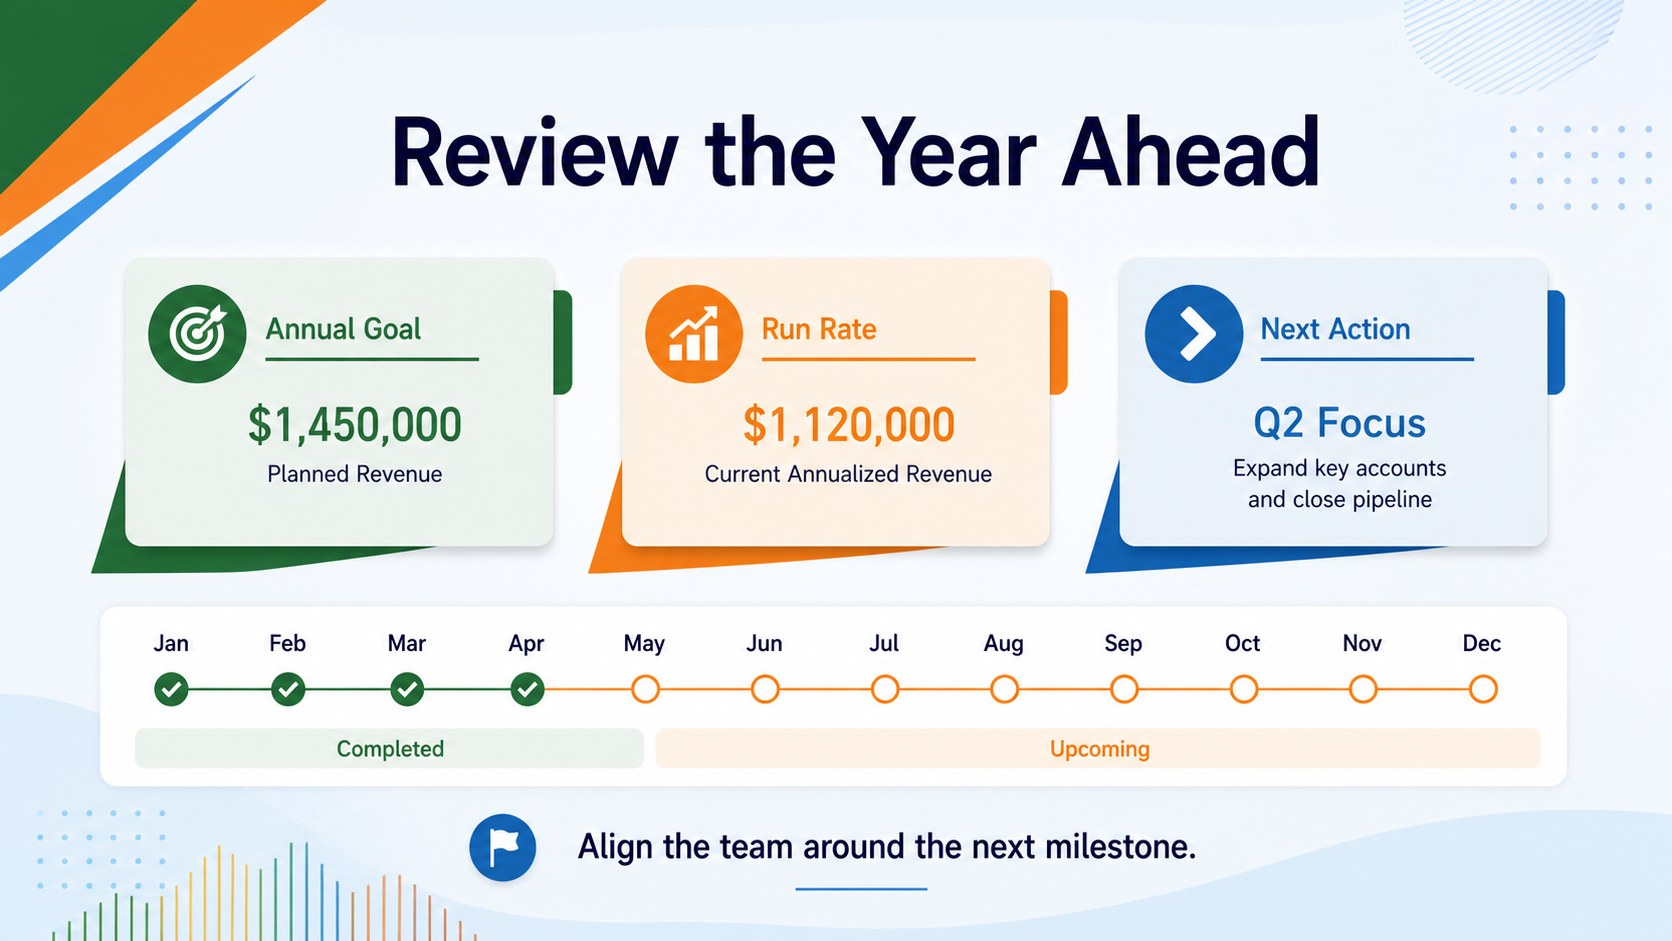
The template is suitable for Excel and Google Sheets, with flexible sharing and export options for team reviews. Use it as a sales planning dashboard template during quarterly meetings, pipeline discussions, budget preparation, or leadership updates. The straightforward grid structure helps startups, agencies, retail teams, and established departments keep targets visible and decisions grounded in current data.
Perfect for: quarterly sales review; startup revenue planning; sales team target setting; annual budget meeting; agency growth planning.
Frequently asked questions
Can I edit this spreadsheet in Excel? Yes. The planning areas, labels, figures, and chart data can be customized in Excel. You can adjust the structure to match your sales process and reporting periods.
Practical details
Yes. The planning areas, labels, figures, and chart data can be customized in Excel. You can adjust the structure to match your sales process and reporting periods.
Yes, the template can be used in Google Sheets for browser-based editing and collaboration. Upload or import the spreadsheet, then update the formulas and visual elements for your team.
Yes. Replace the sample categories, update the headings, and change the blue, green, and orange styling to match your reporting needs. Charts and summary areas can also be adapted to show your preferred metrics.
It is designed for sales managers, startup founders, account teams, and business analysts who need a structured annual view. It is useful for setting targets, comparing scenarios, and preparing review meetings.
Keep exploring
6Honor teams and individuals with an Orange Year-End Recognition Certificate Set featuring six editable designs for PowerPoint and Google Slides.
 4
4Keep inspections, repairs, priorities, and follow-up dates organized in a weekly equipment service log designed for facilities and operations teams.
 4
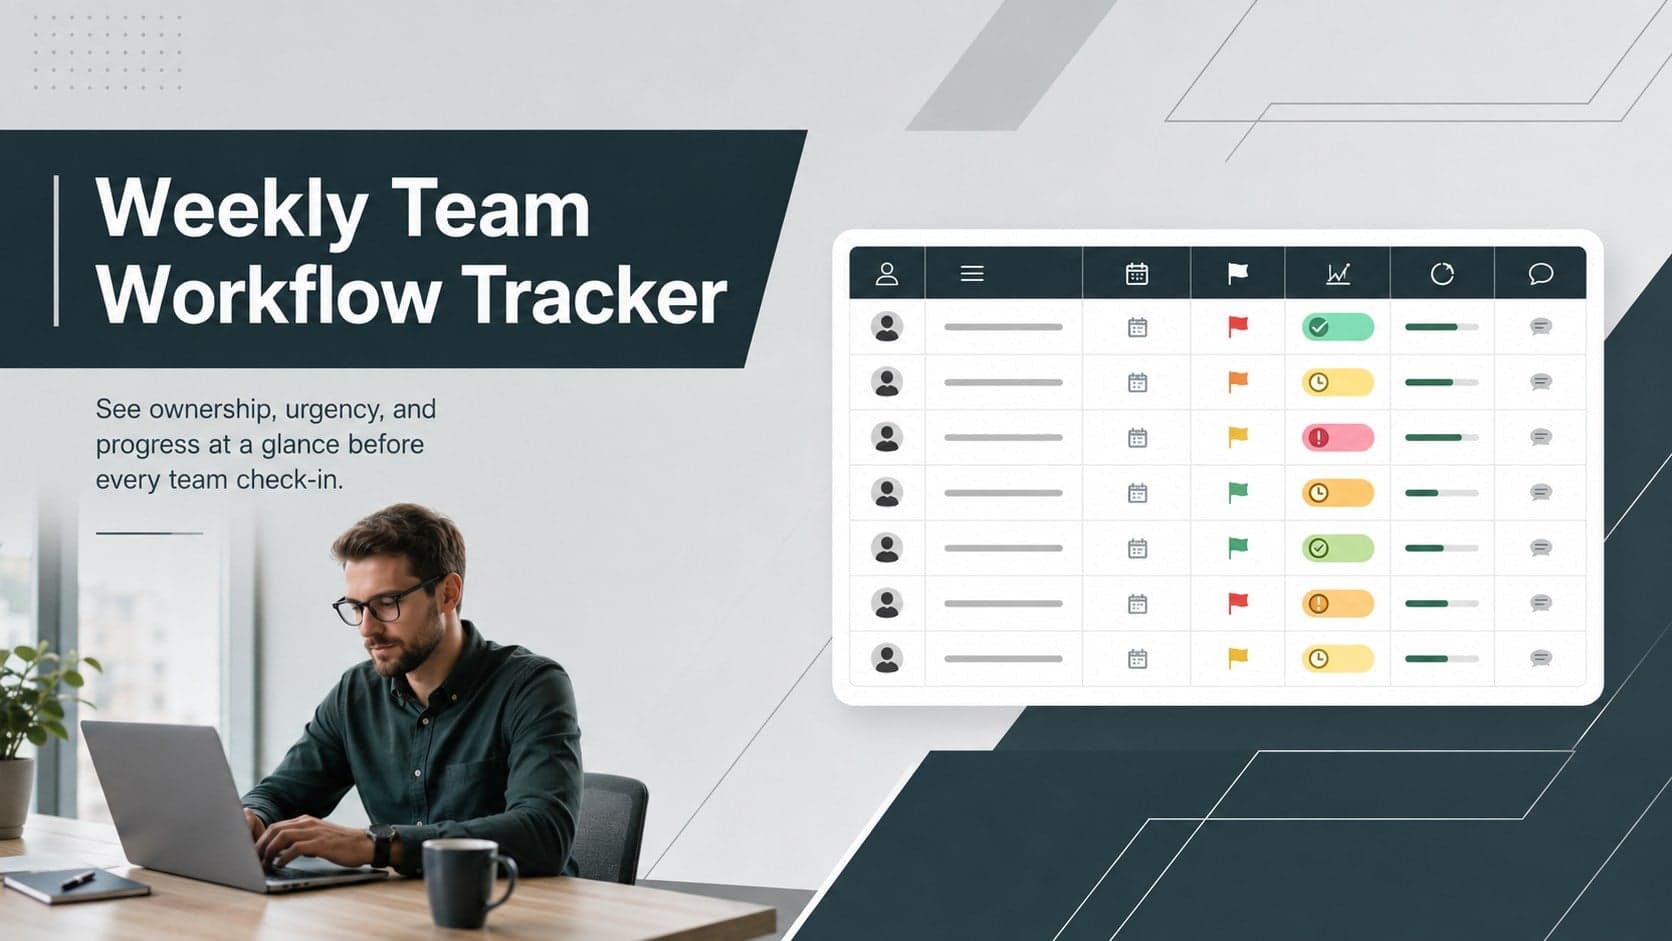
4Keep weekly ownership visible with a Weekly Team Workflow Tracker for assignments, deadlines, priorities, logged hours, blockers, and status updates.
 4
4Turn weekly results into quick decisions with a colorful sales pulse tracker for comparing targets, revenue, wins, and trends in Excel or Google Sheets.
 4
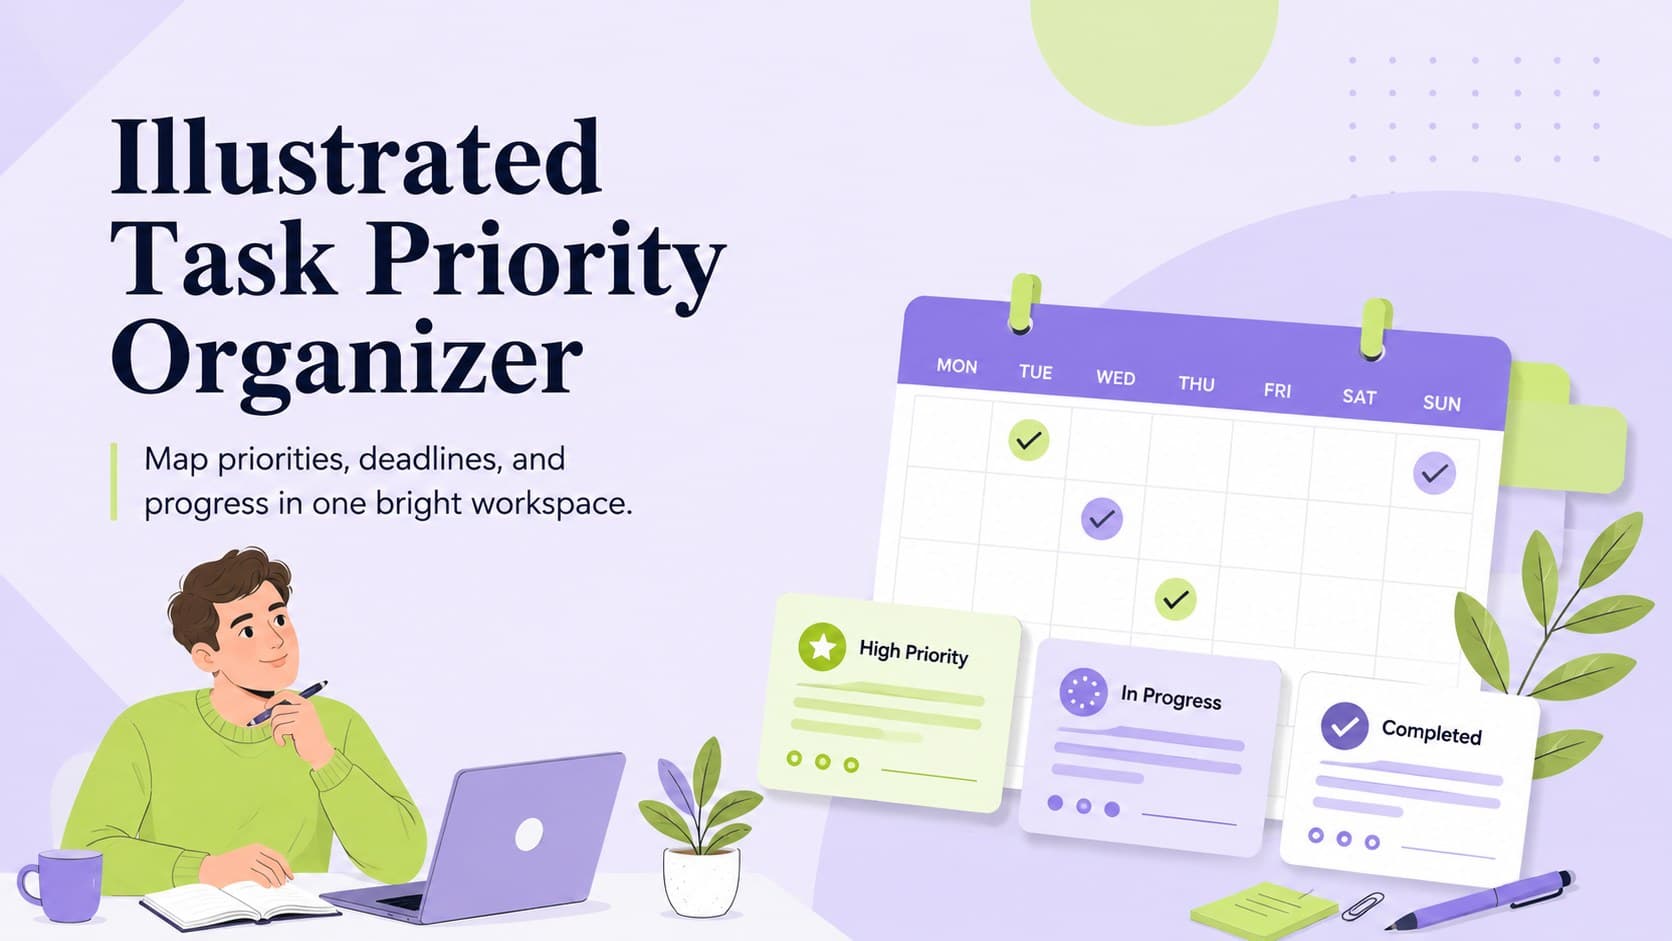
4Turn a busy workload into a clear action plan with the Illustrated Task Priority Organizer, an editable green-and-purple template for focused days.
 4
4Organize classes, meetings, and personal tasks with a vibrant weekly schedule planner, editable in Excel and Google Sheets for fast, flexible updates.
 4
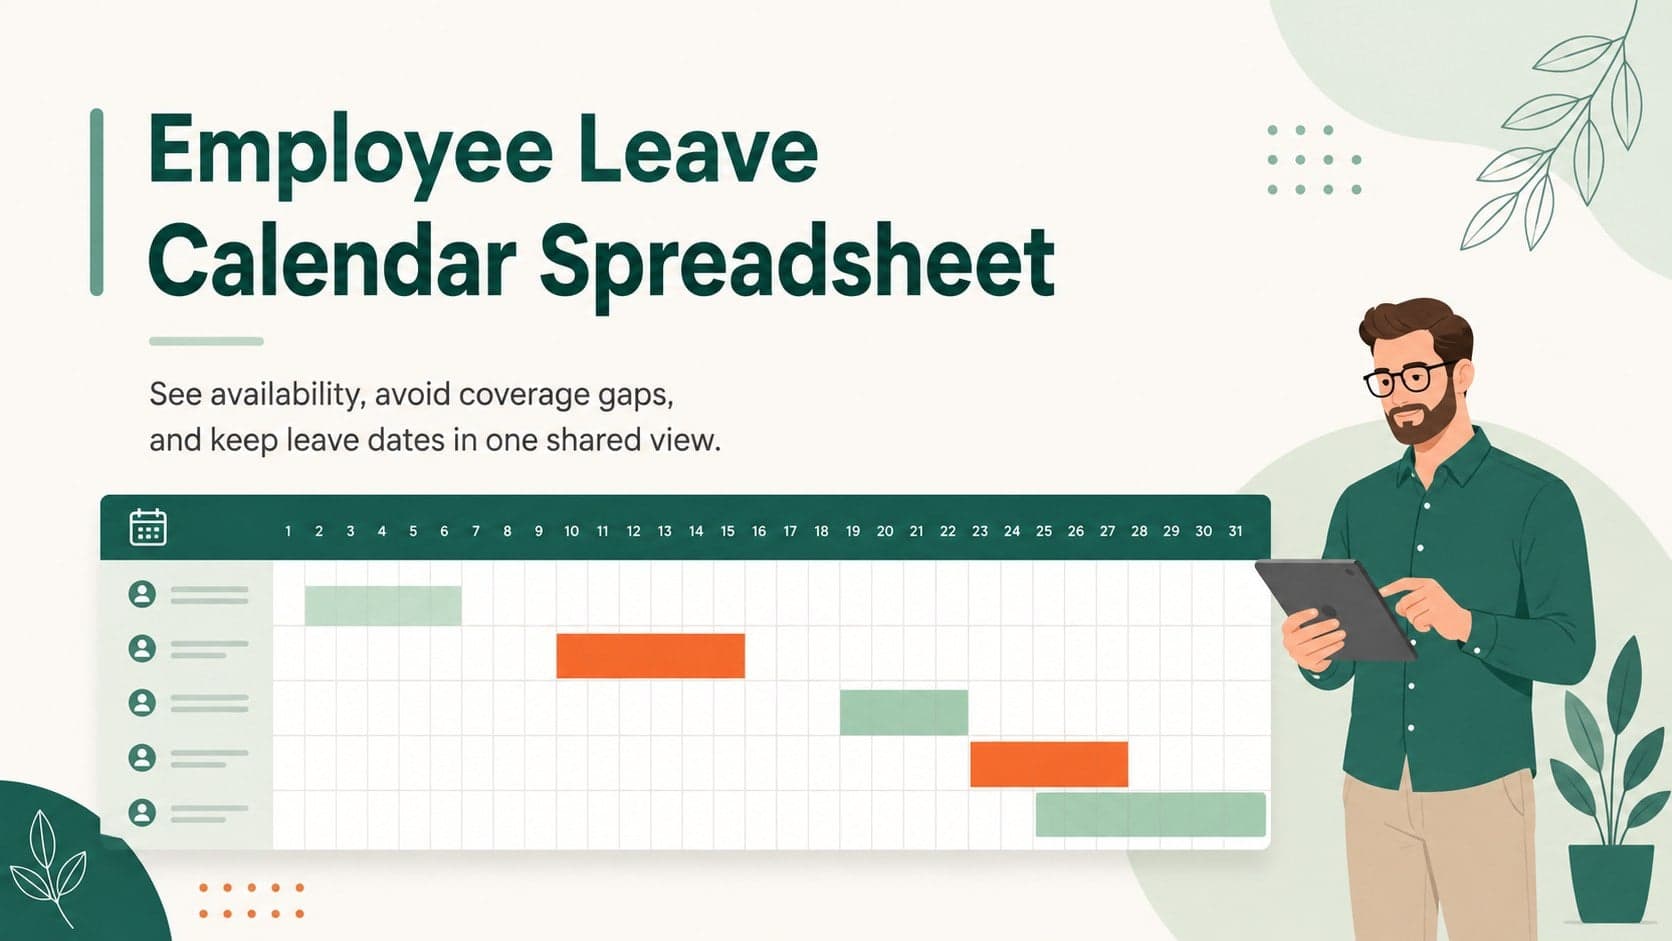
4Coordinate absences with an employee leave calendar spreadsheet built for clear approvals, reliable team coverage, and easy editing in Excel or Google Sheets.
 4
4Plan bills, savings, and daily costs with a colorful weekly spending planner for Excel or Google Sheets, with clear categories and automatic totals.