
 15
presentation
Flying Saucer History Lesson Deck
Build an engaging World UFO Day session with this flying saucer history lesson deck, featuring retro green-and-brown slides for PowerPoint and Google Slides.
Google SlidesPowerPoint
presentation · English
Build a credible stock trading strategy blueprint with 16 minimal brown slides for market analysis, risk controls, forecasts, and investor presentations.

Design notes
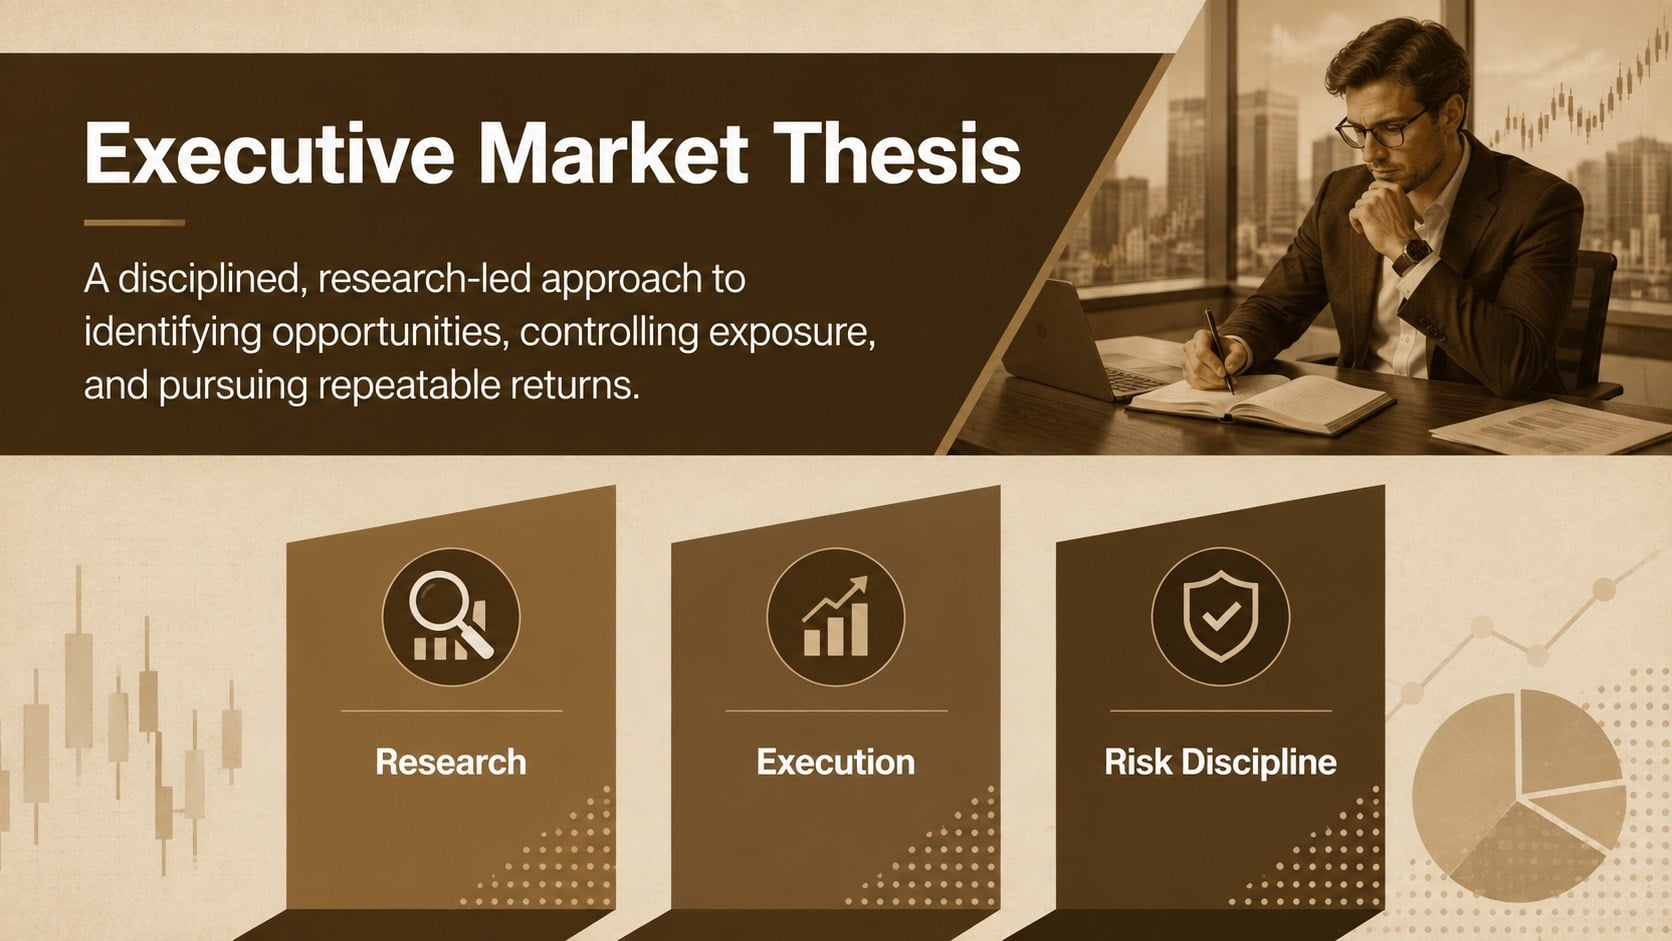
Built for analysts, trading teams, brokerage founders, and finance consultants, this stock trading strategy blueprint turns a complex market plan into a structured, persuasive presentation. Its understated brown palette, clean typography, and minimal layouts create a professional setting for discussing opportunities, execution methods, capital requirements, and expected performance without distracting from the numbers.
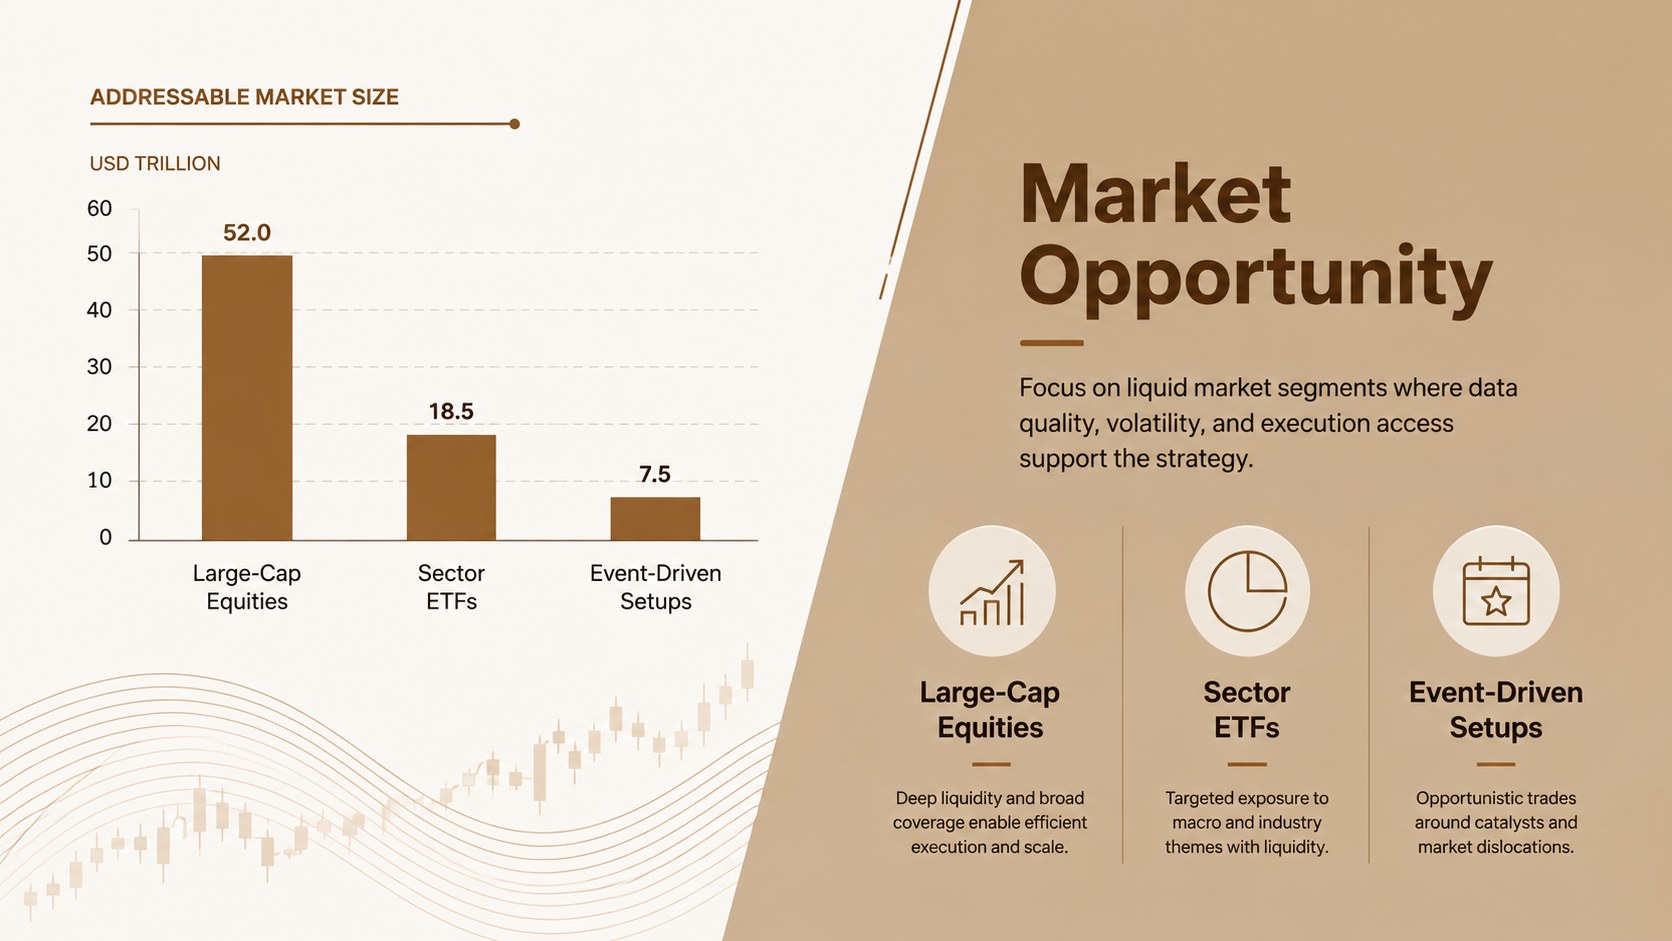
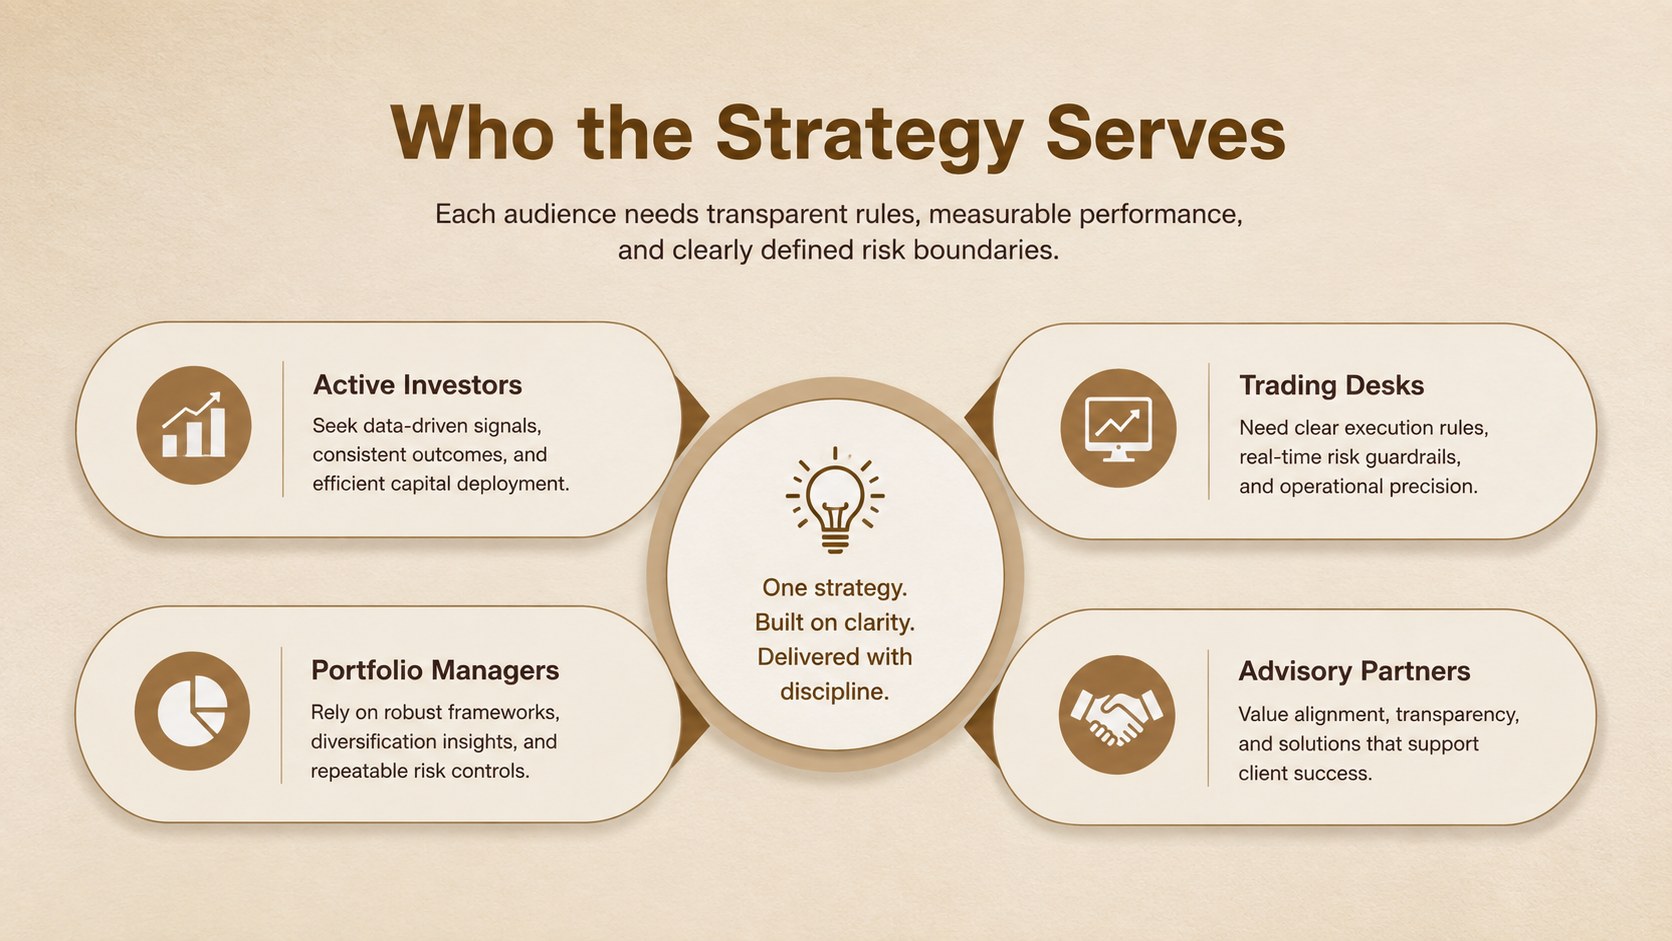
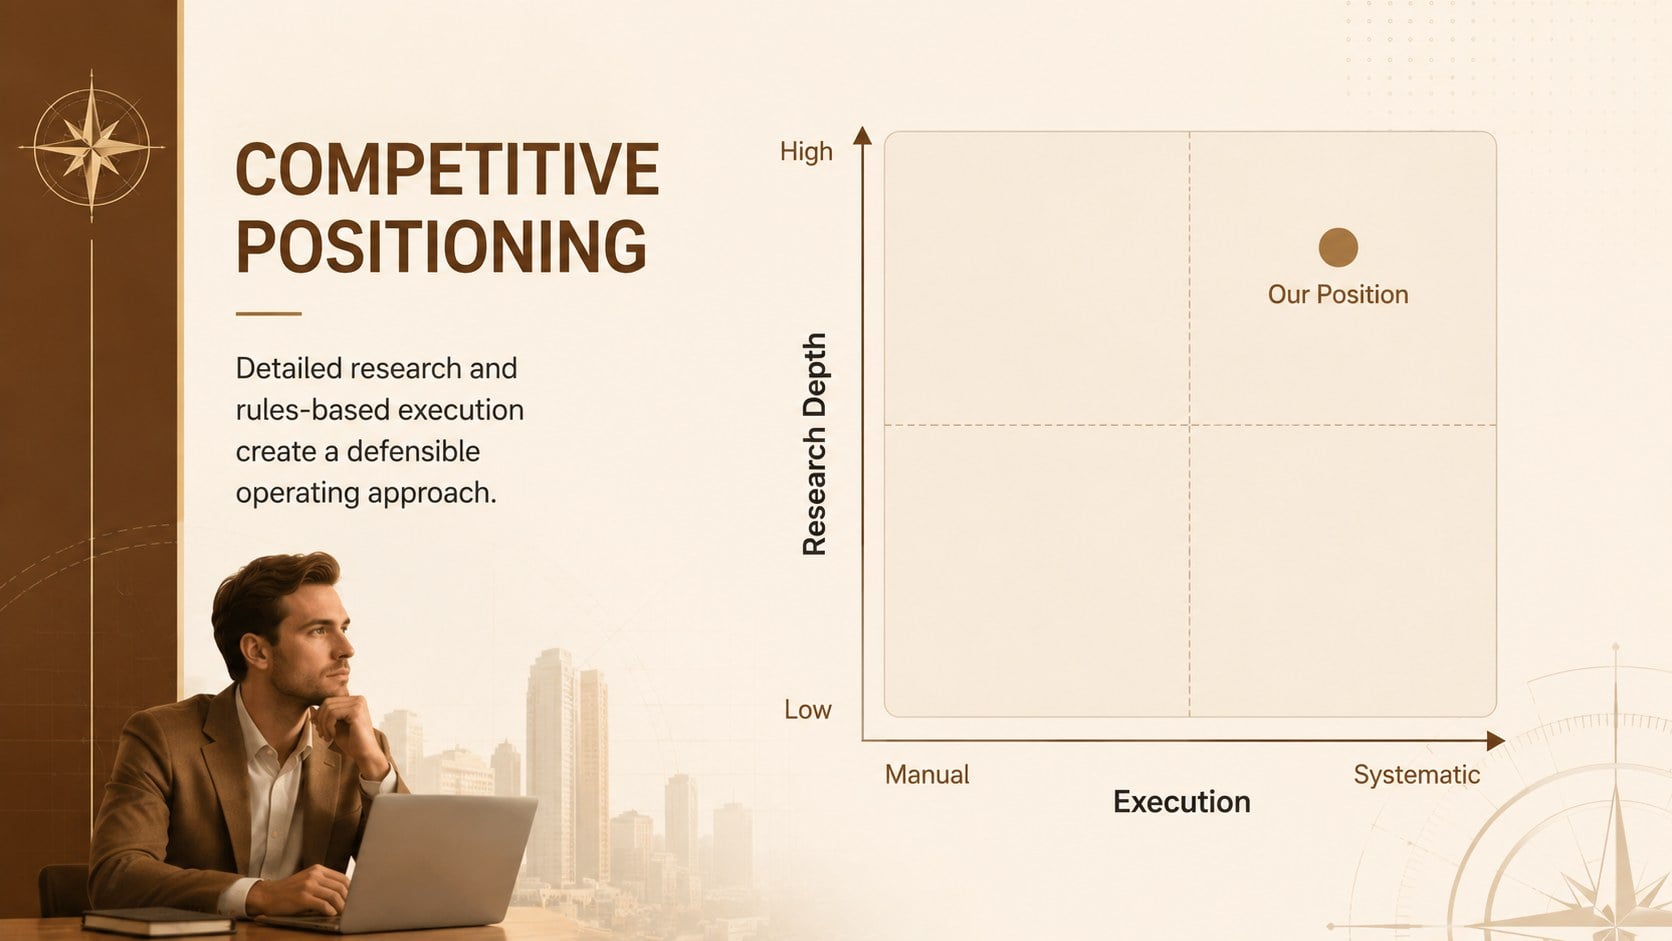
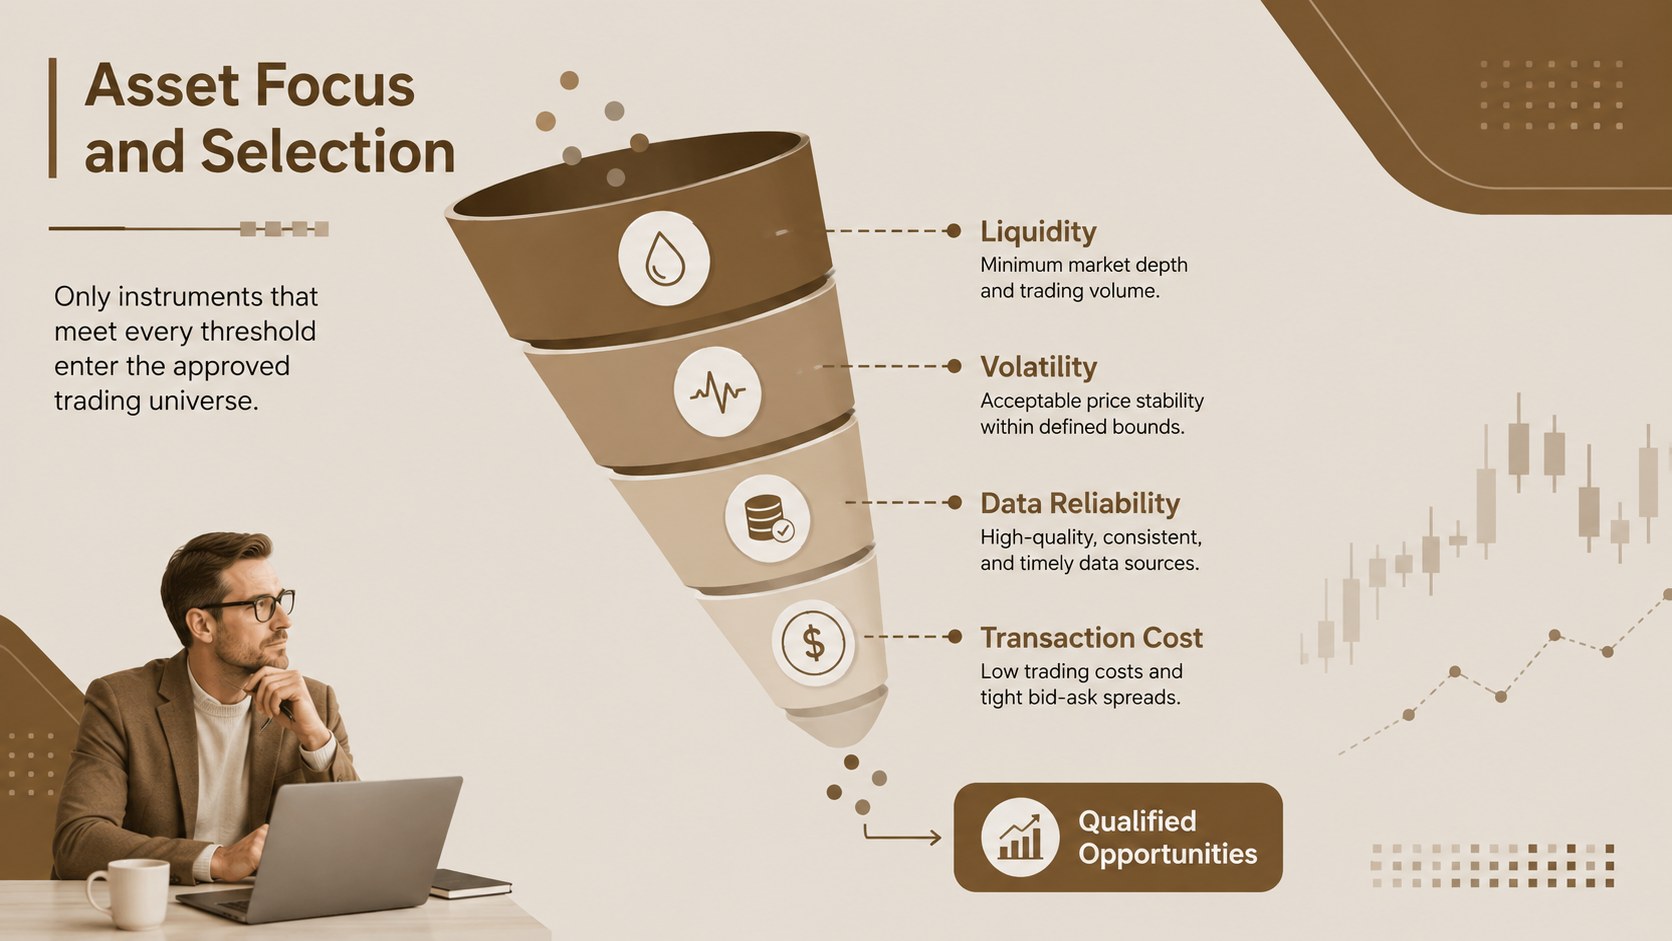
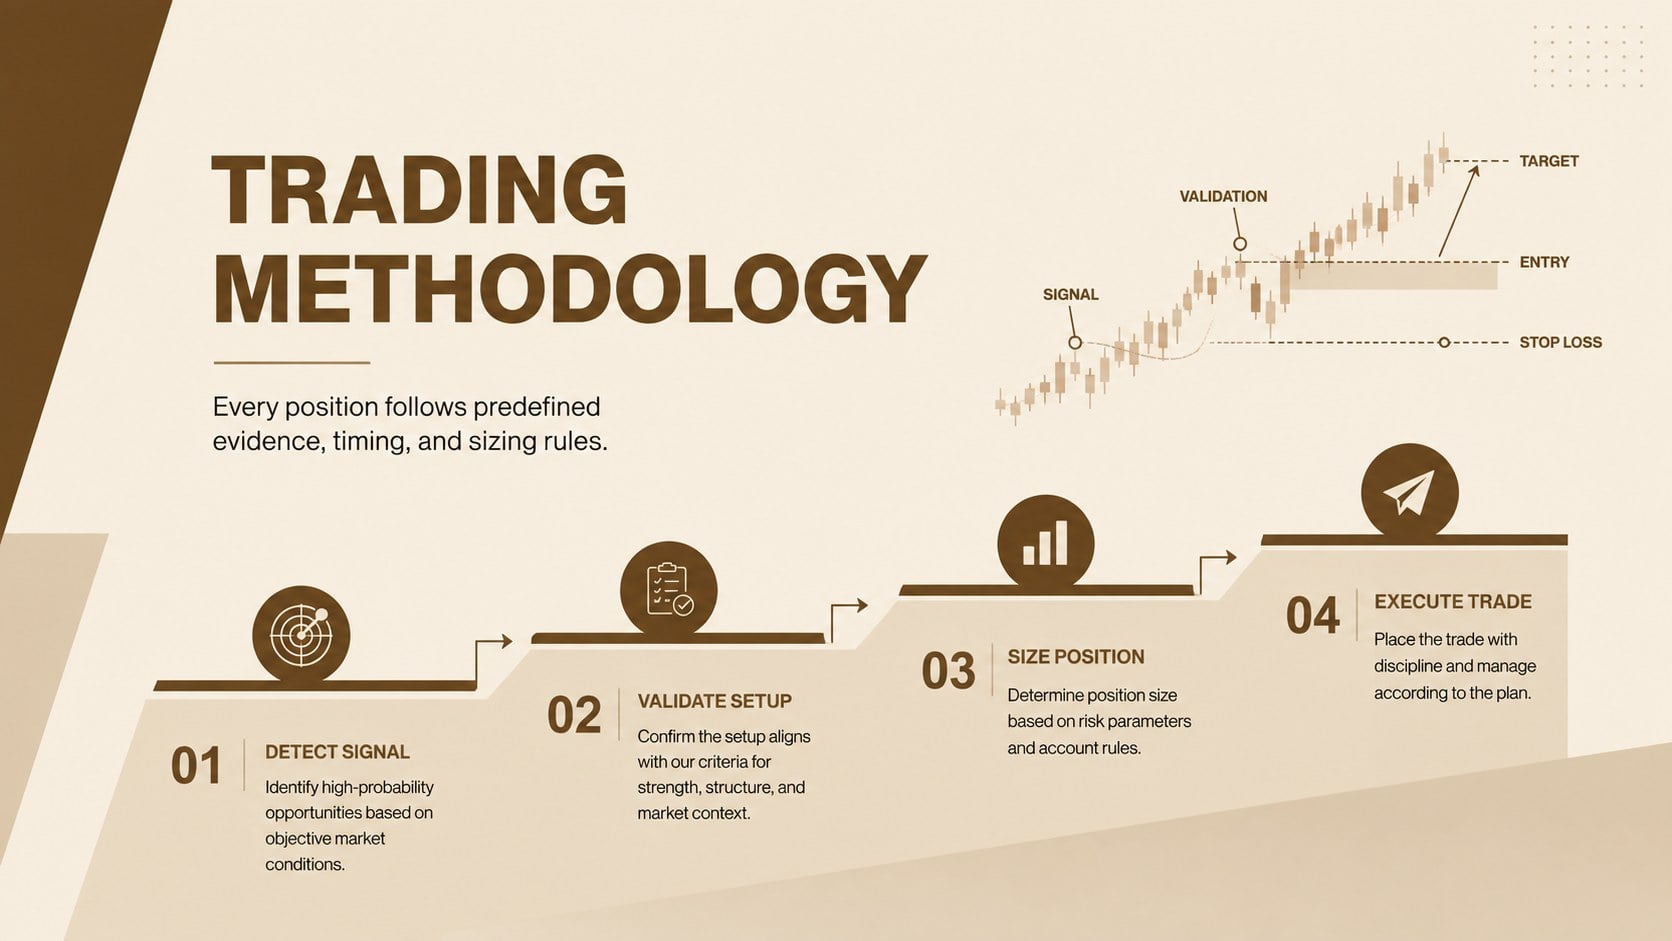
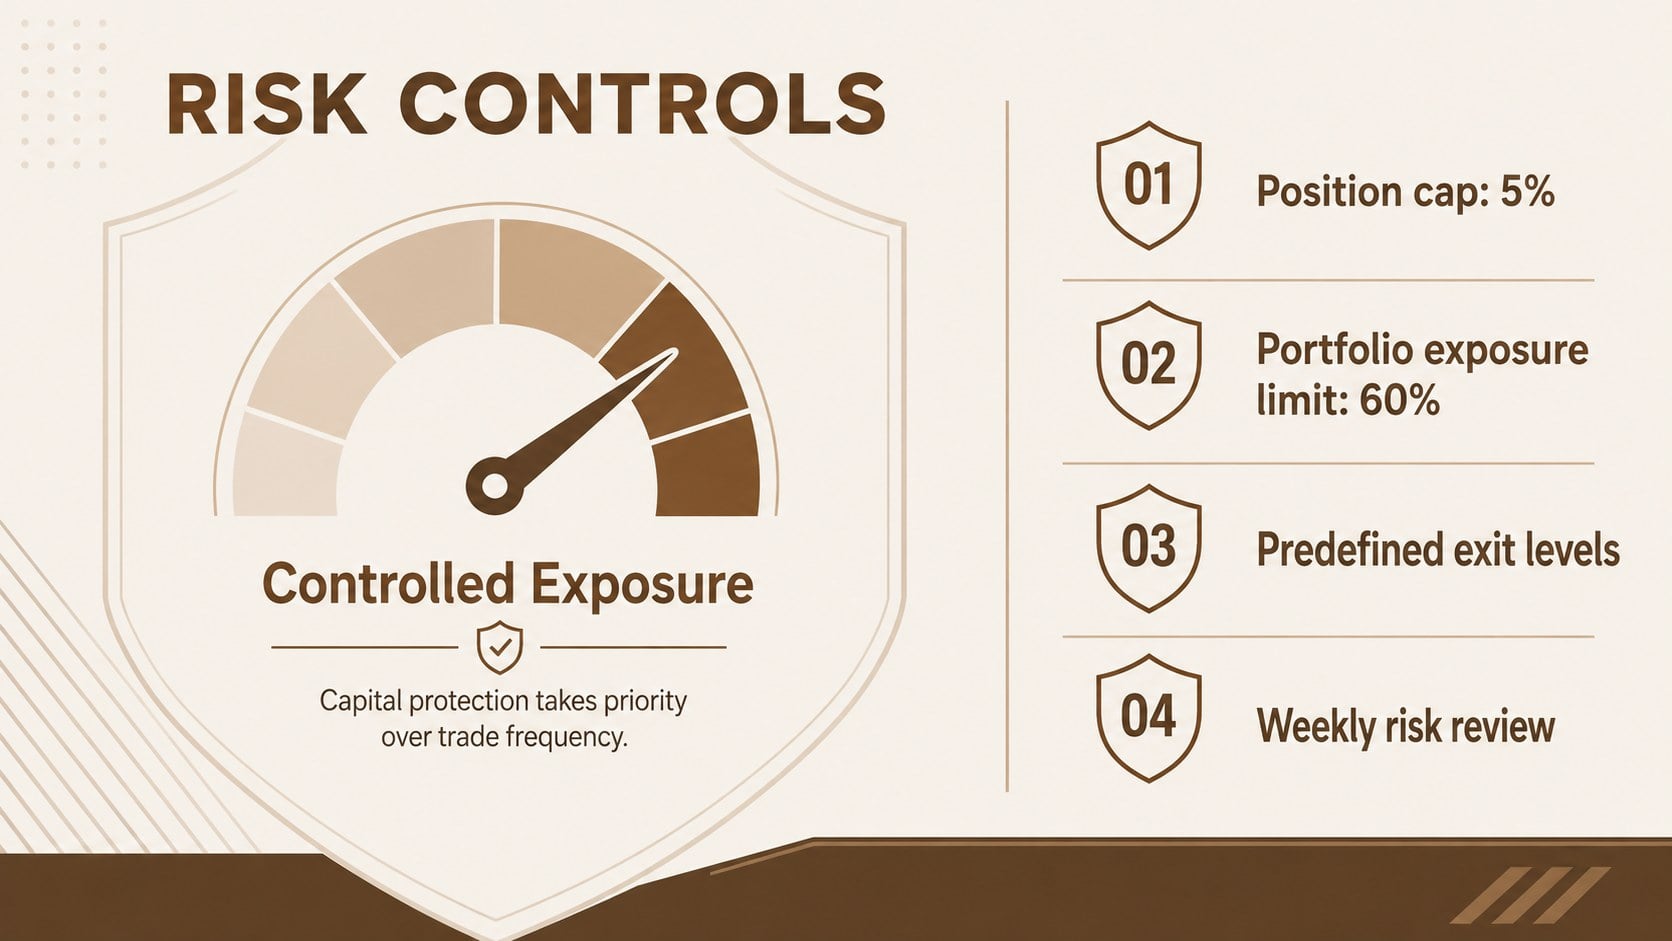
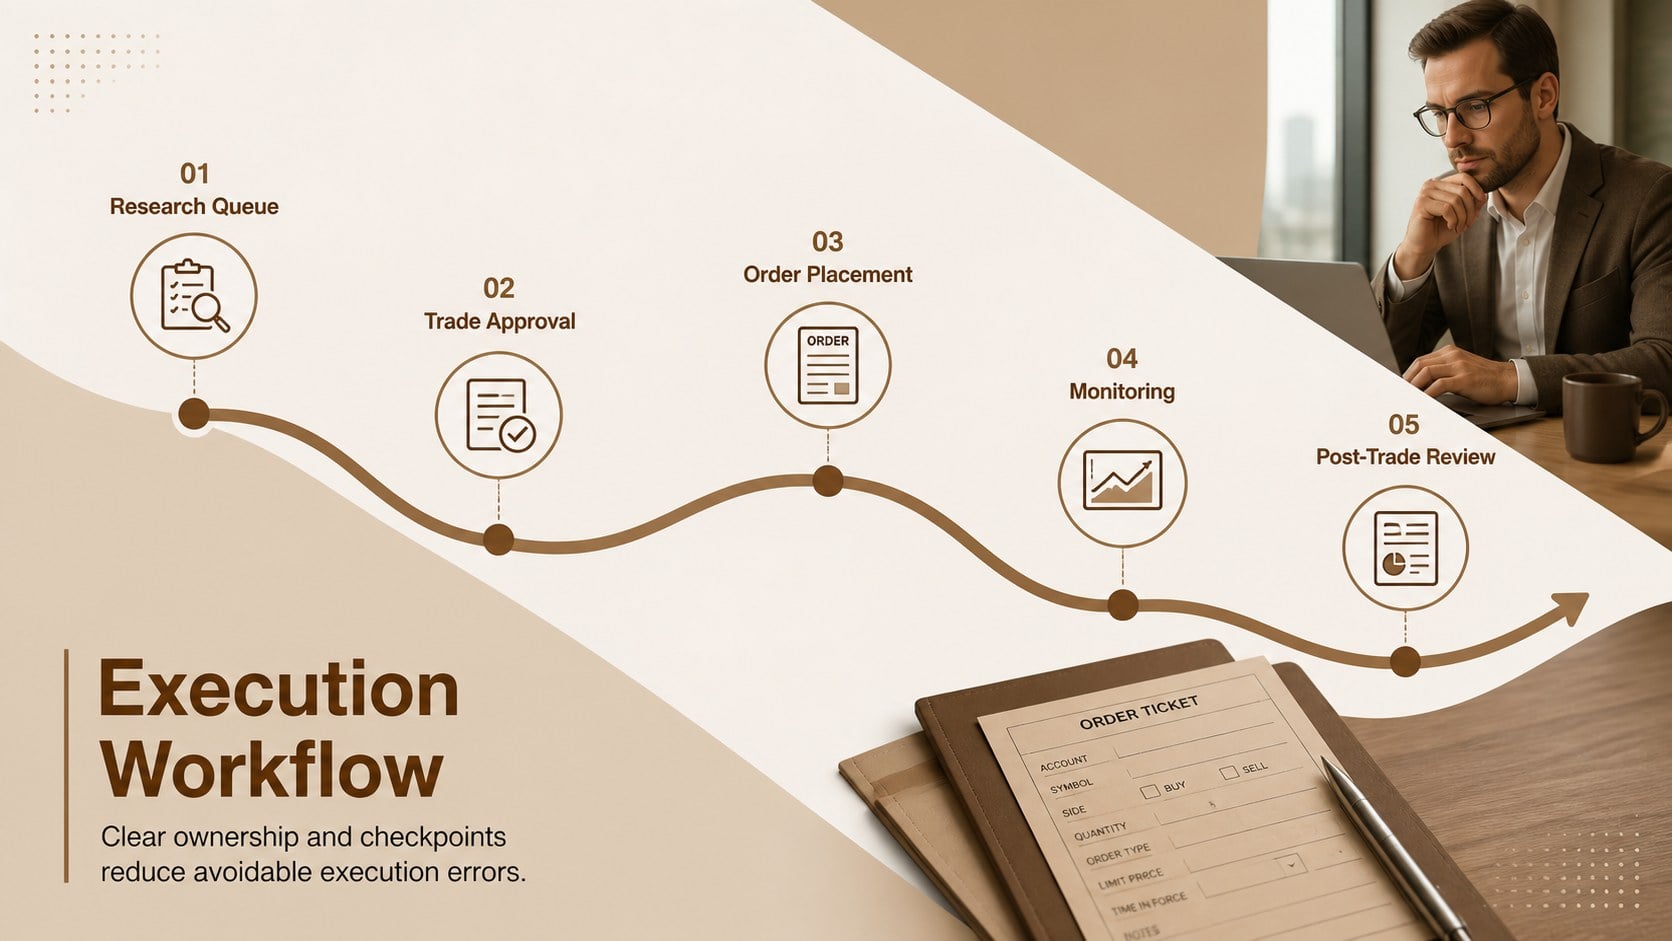
The 16-slide deck covers an executive thesis, target market, competitive positioning, asset focus, trading methodology, risk limits, execution workflow, technology needs, revenue model, financial projections, milestones, and next steps. Dedicated stock market risk management slides make exposure rules and safeguards easier to explain, while the equity trading forecast template provides a clear framework for presenting scenarios, assumptions, and performance targets. Charts, tables, timelines, and process diagrams can all be adapted to match your own research and operating model.
Use this trading desk strategy presentation for an internal planning session, a brokerage proposal, a partner briefing, or an investor discussion. Every slide is editable in PowerPoint and Google Slides, allowing you to replace sample figures, adjust colors, revise typography, and reorganize sections. The result is a focused deck that helps decision-makers understand how the strategy works, where its edge comes from, and how financial and operational risks will be managed.
Perfect for: trading desk planning session; brokerage investor presentation; portfolio strategy review; market entry proposal; risk committee briefing; financial partner meeting.
Frequently asked questions
Can I edit the trading figures and market assumptions? Yes. All sample figures, labels, tables, and chart values can be replaced with your own market research and projections. You can also add or remove sections to reflect your trading model.
Practical details
Yes. All sample figures, labels, tables, and chart values can be replaced with your own market research and projections. You can also add or remove sections to reflect your trading model.
The deck is designed for PowerPoint and Google Slides. Layouts, text, colors, and visual elements remain editable on both platforms.
Yes. You can replace the brown tones with your firm's colors while retaining the minimal visual hierarchy. For consistent results, update the background, accent, chart, and text colors together.
Yes. It includes space for the market thesis, competitive edge, operating model, risk controls, projections, and milestones that investors commonly expect. Replace the sample content with verified data and clearly state the assumptions behind every forecast.
Keep exploring
15Build an engaging World UFO Day session with this flying saucer history lesson deck, featuring retro green-and-brown slides for PowerPoint and Google Slides.
 15
Plan a lively animal-learning journey with this jungle zoo adventure lesson deck, ready to customize in PowerPoint and Google Slides for young learners.
 16
Turn environmental research into a clear story with a Watercolor Ecology Presentation Theme for PowerPoint and Google Slides in calming green and blue.
 16
Build focused fashion, literature, and humanities presentations with the Red Triangle Editorial Theme, editable in PowerPoint and Google Slides.
 15
Turn streaming stats, favorite tracks, and concert highlights into a bold annual listening recap slide deck for PowerPoint and Google Slides.
 15
Turn highlights, milestones, and favorite moments into a colorful year in review slide deck with bold 3D graphics for PowerPoint and Google Slides.
 3
Build a credible endorsement with Standout Colleague Recommendation Letter Slides, featuring colorful prompts for skills, achievements, and team impact.
 4
Build clear beginner sessions with an ice hockey fundamentals training deck for coaches, PE teachers, and clubs, ready for PowerPoint and Google Slides.