
 15
15presentation
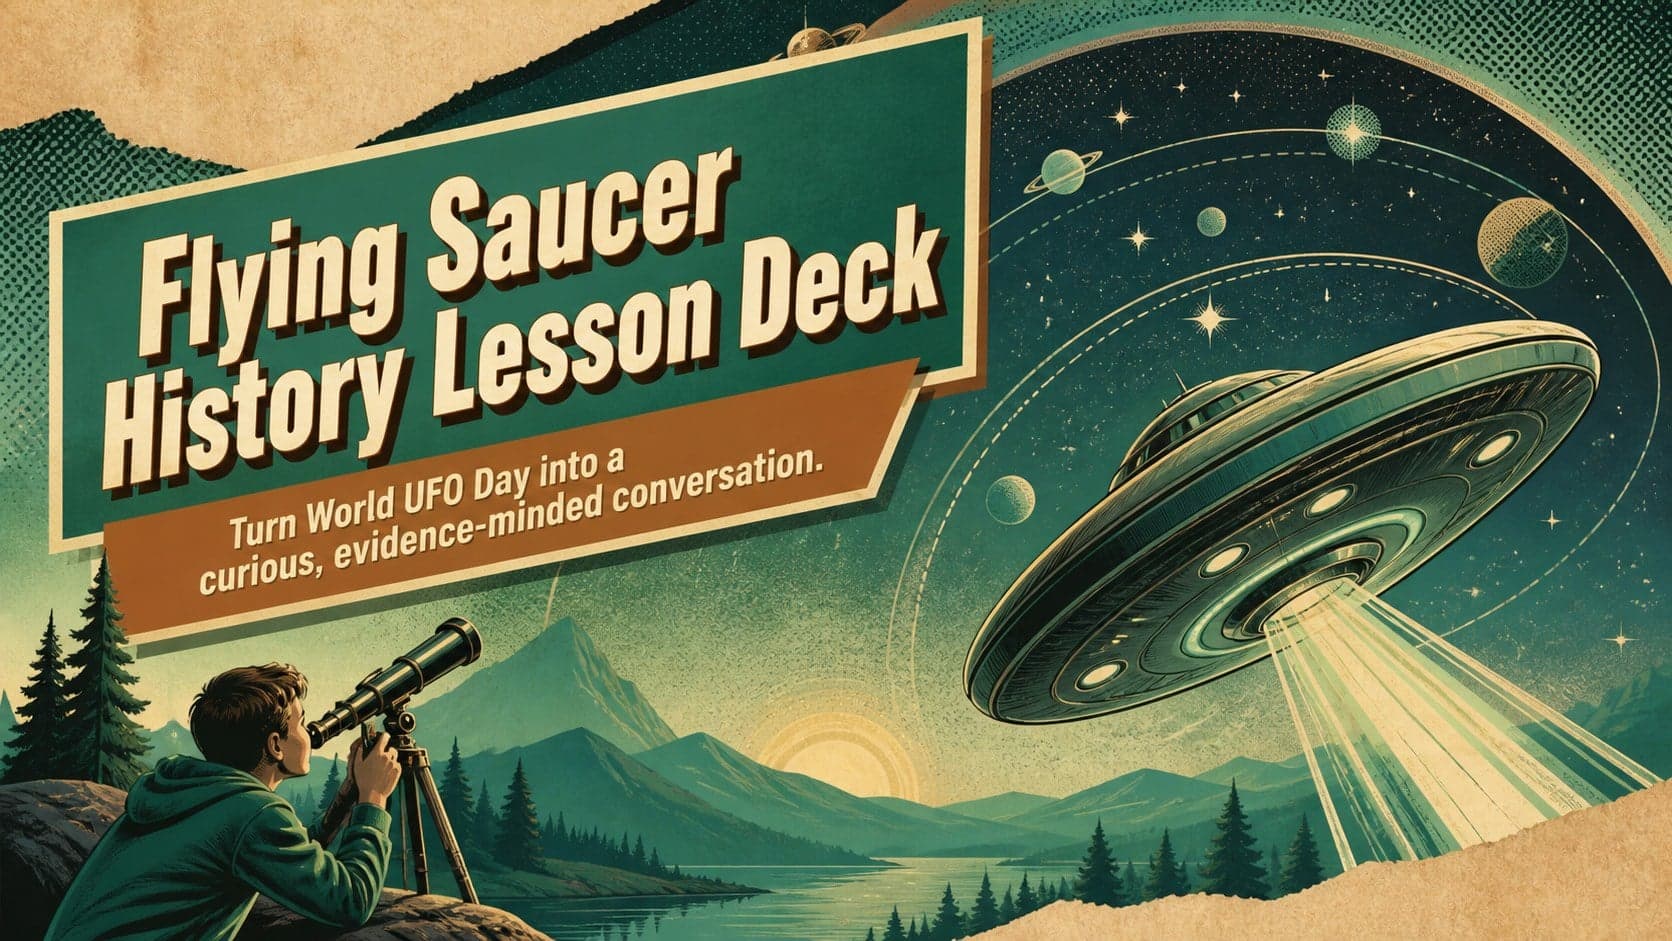
Flying Saucer History Lesson Deck
Build an engaging World UFO Day session with this flying saucer history lesson deck, featuring retro green-and-brown slides for PowerPoint and Google Slides.
Google SlidesPowerPoint
presentation · English
Turn streaming stats, favorite tracks, and concert highlights into a bold annual listening recap slide deck for PowerPoint and Google Slides.

Design notes
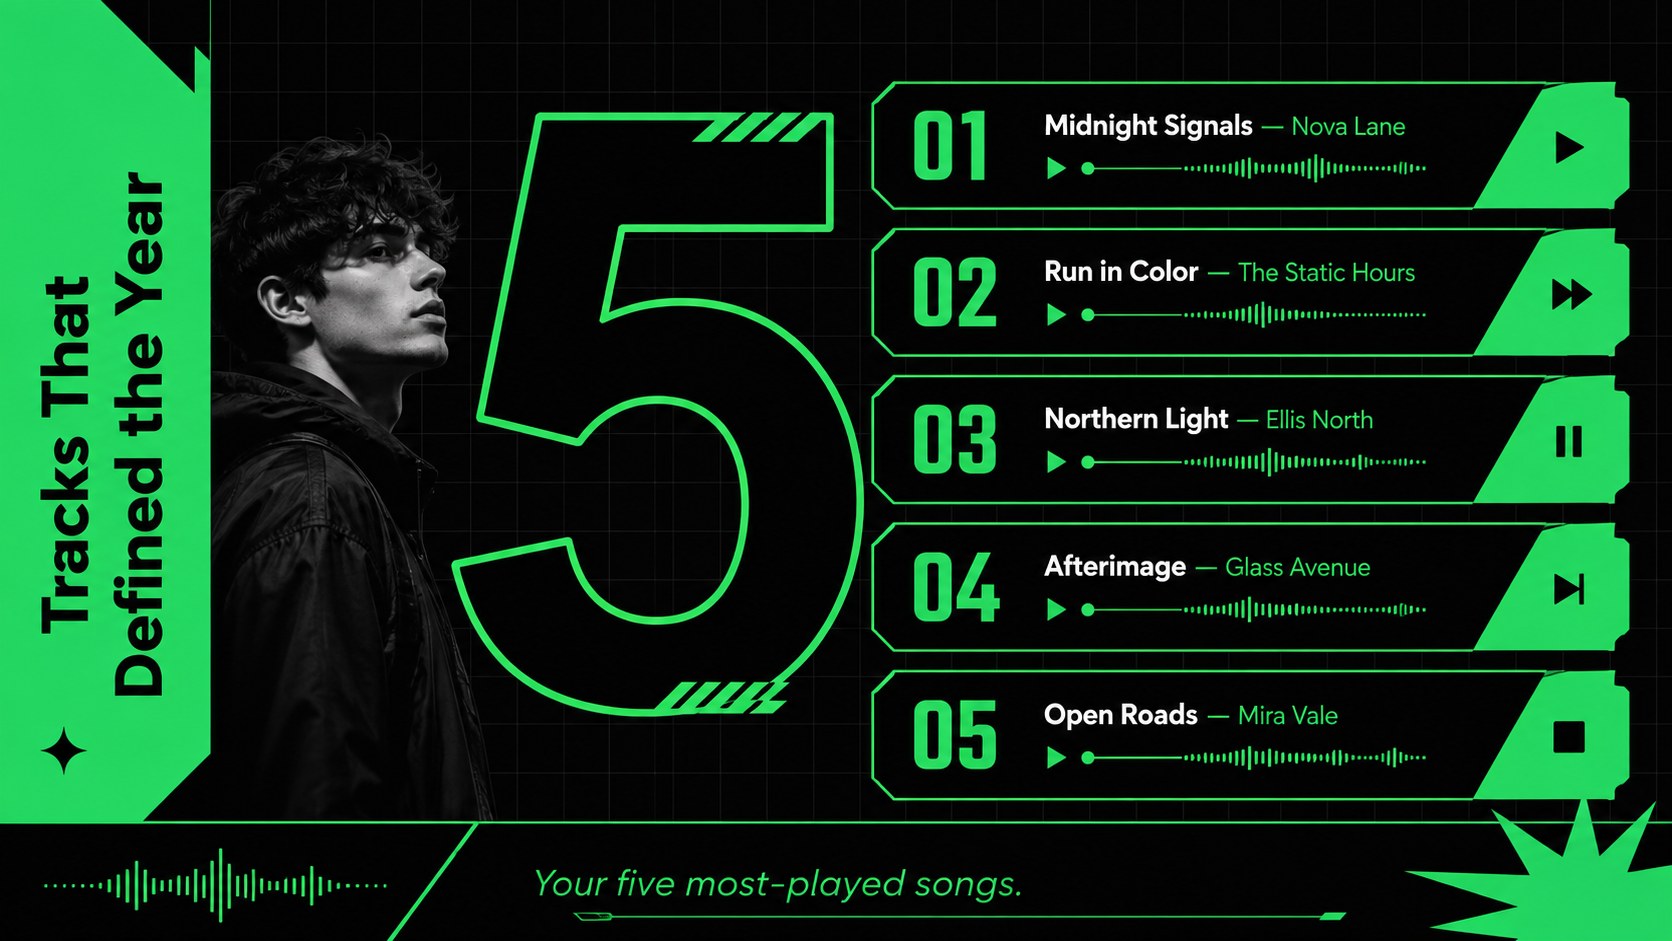
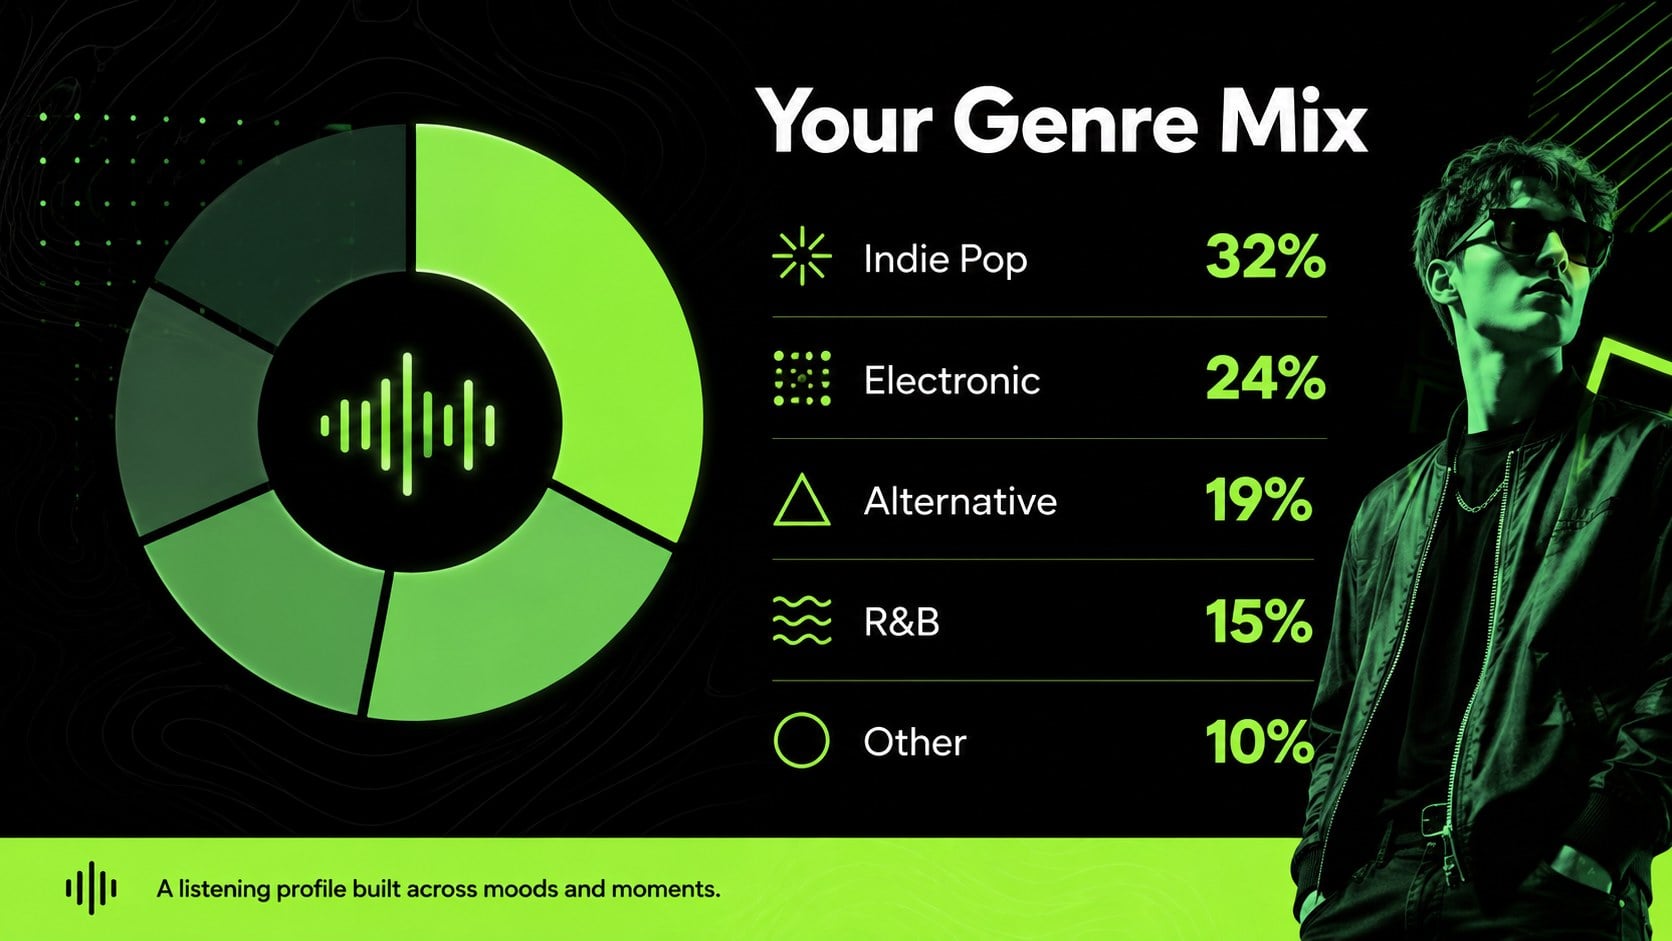
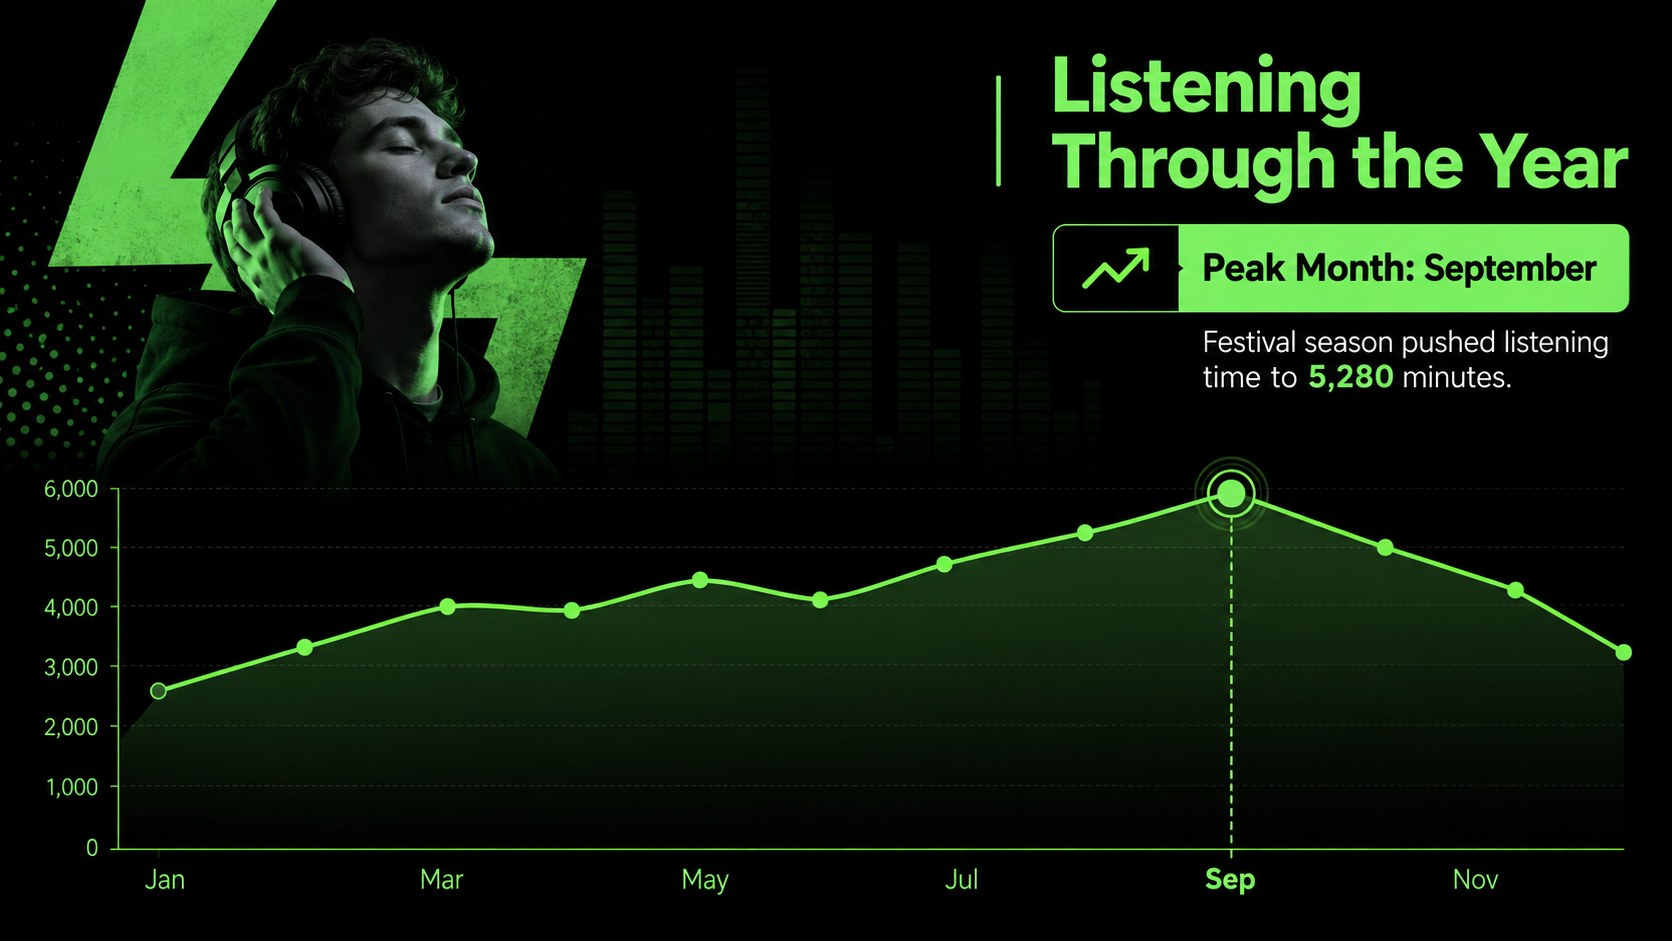
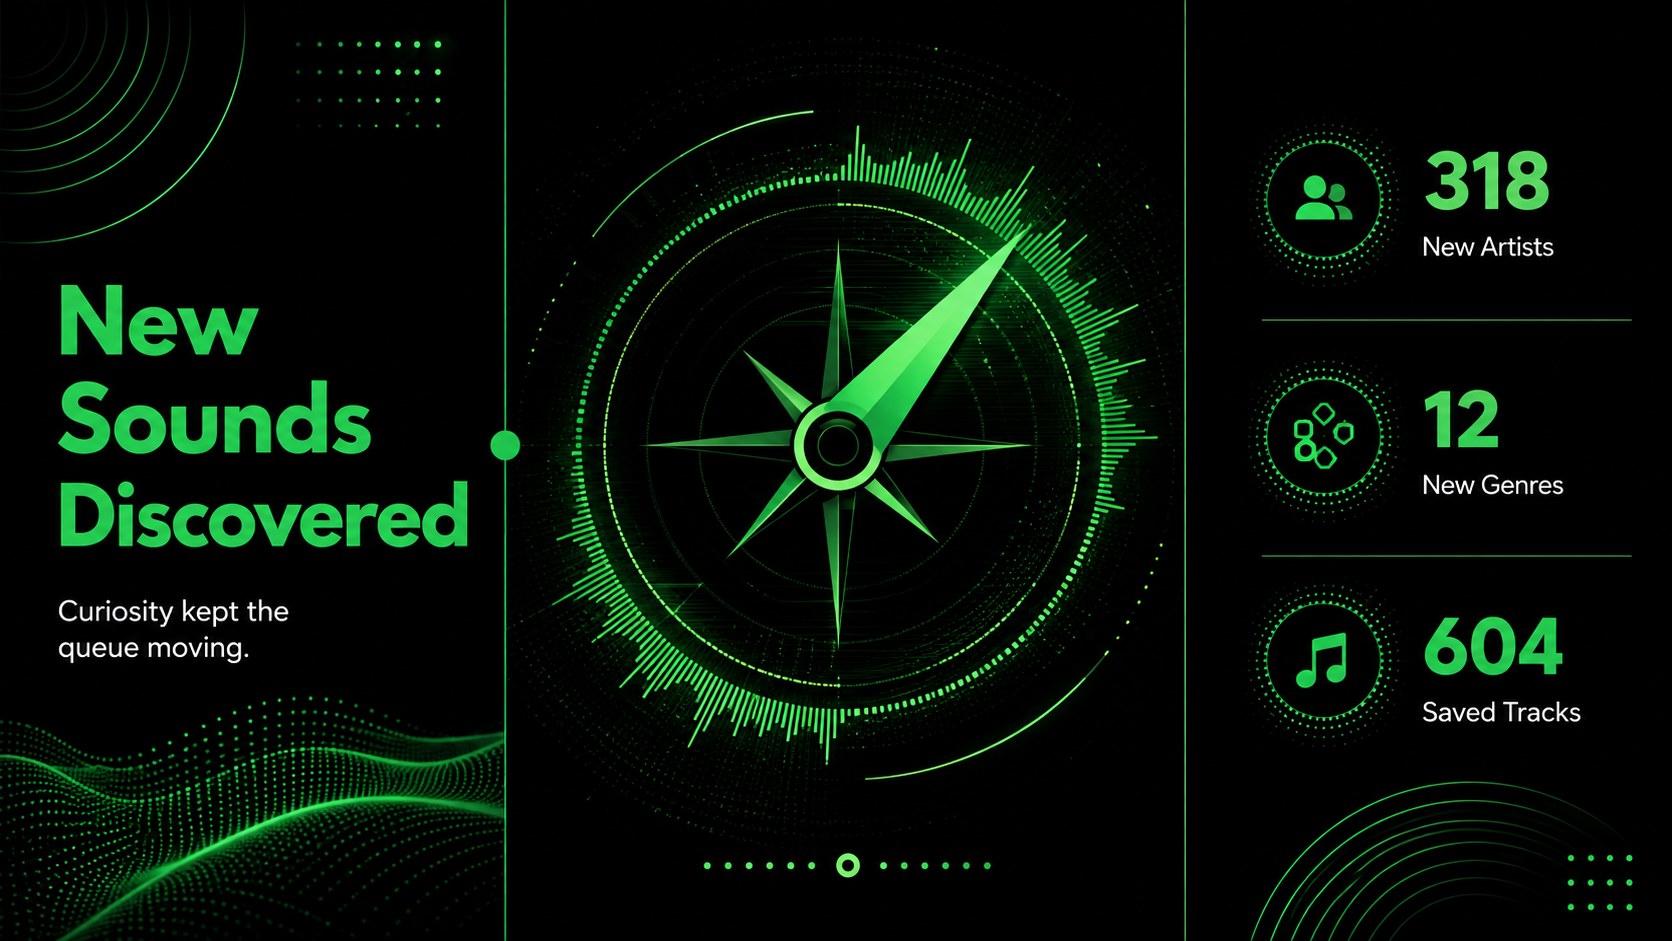
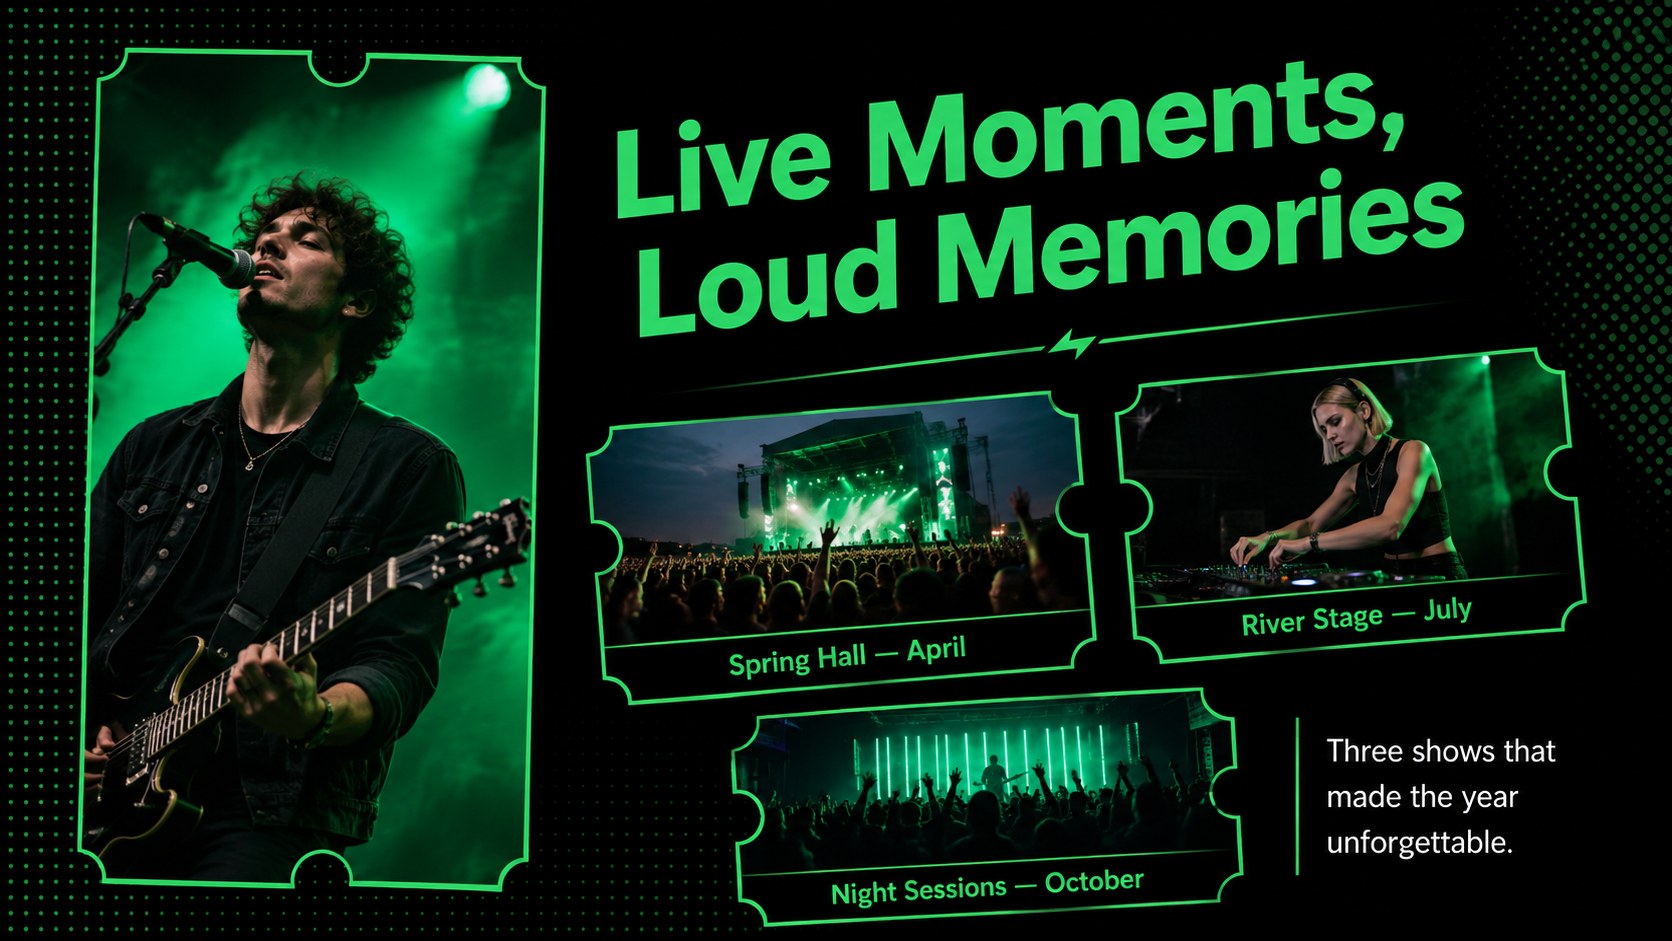
Build a memorable story around the music that defined your year with this annual listening recap slide deck. Its modern black and electric green design gives streaming figures, favorite releases, and standout moments a confident visual rhythm. Use it for a personal music statistics presentation, a community listening recap, or an engaging update for artists and music teams.
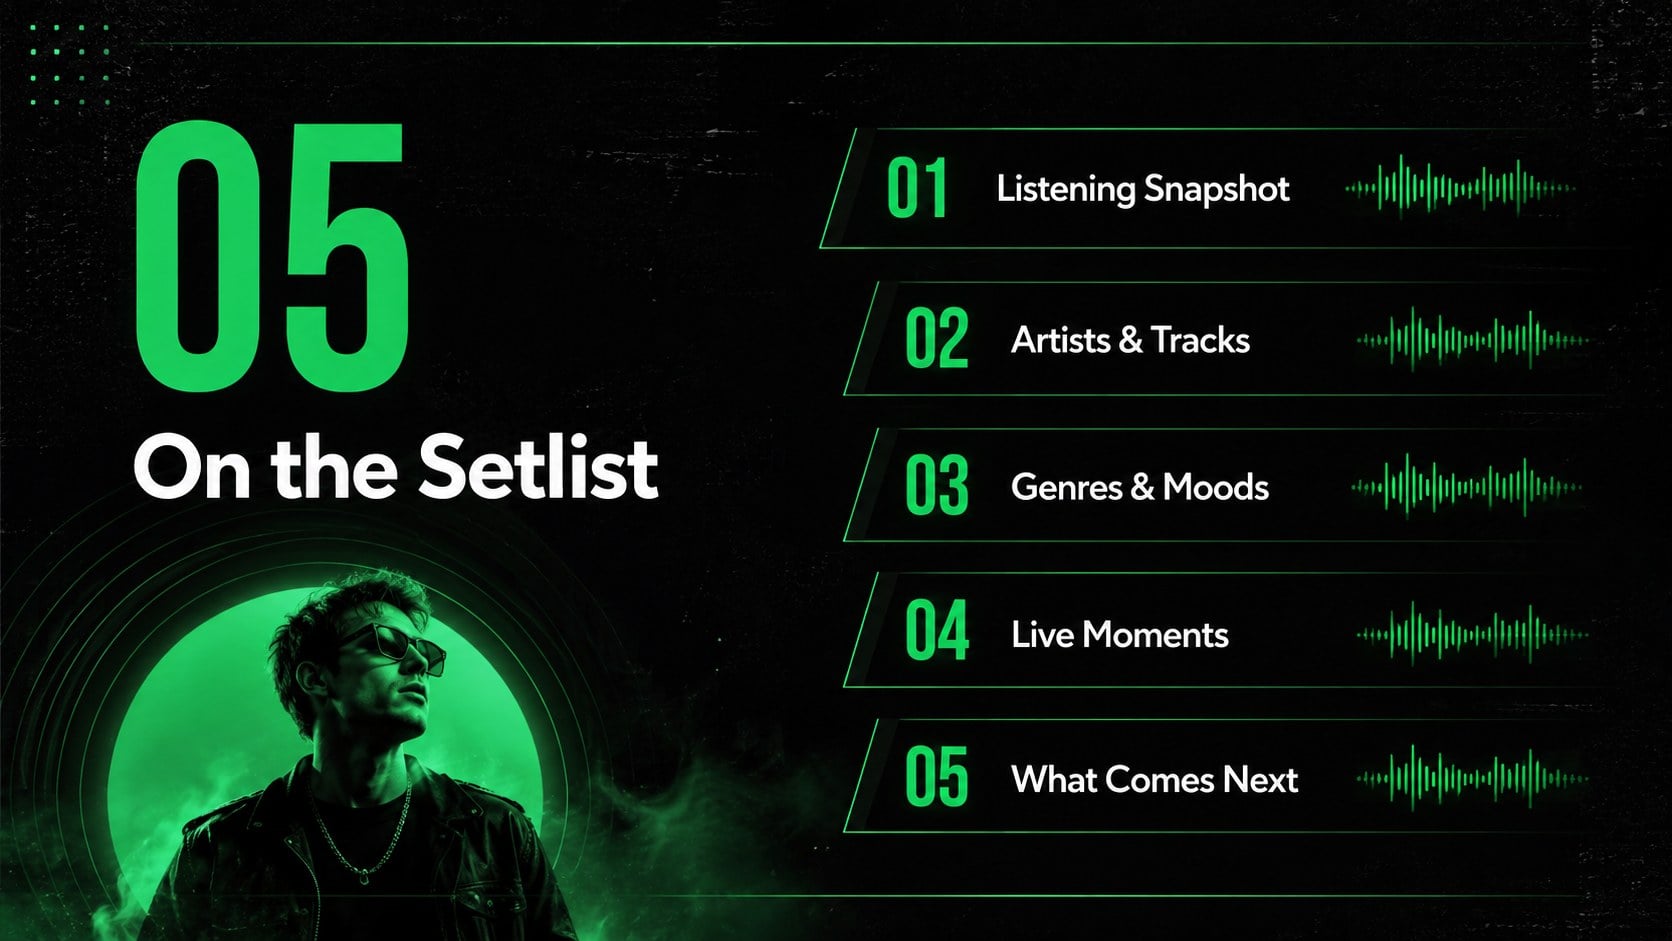
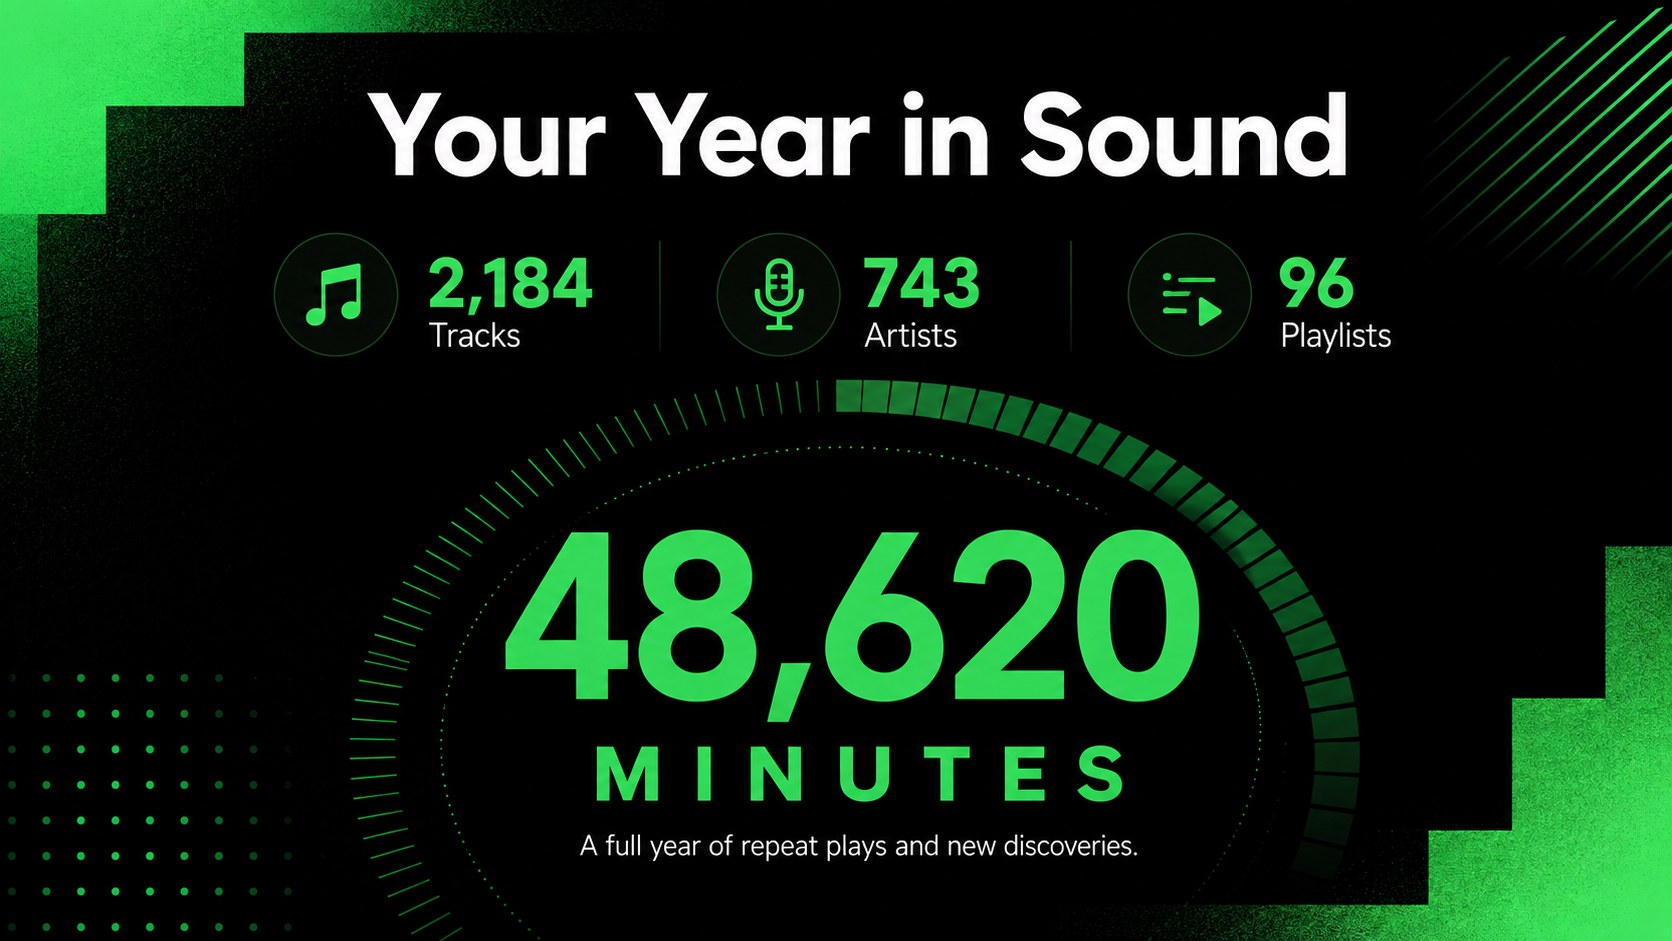
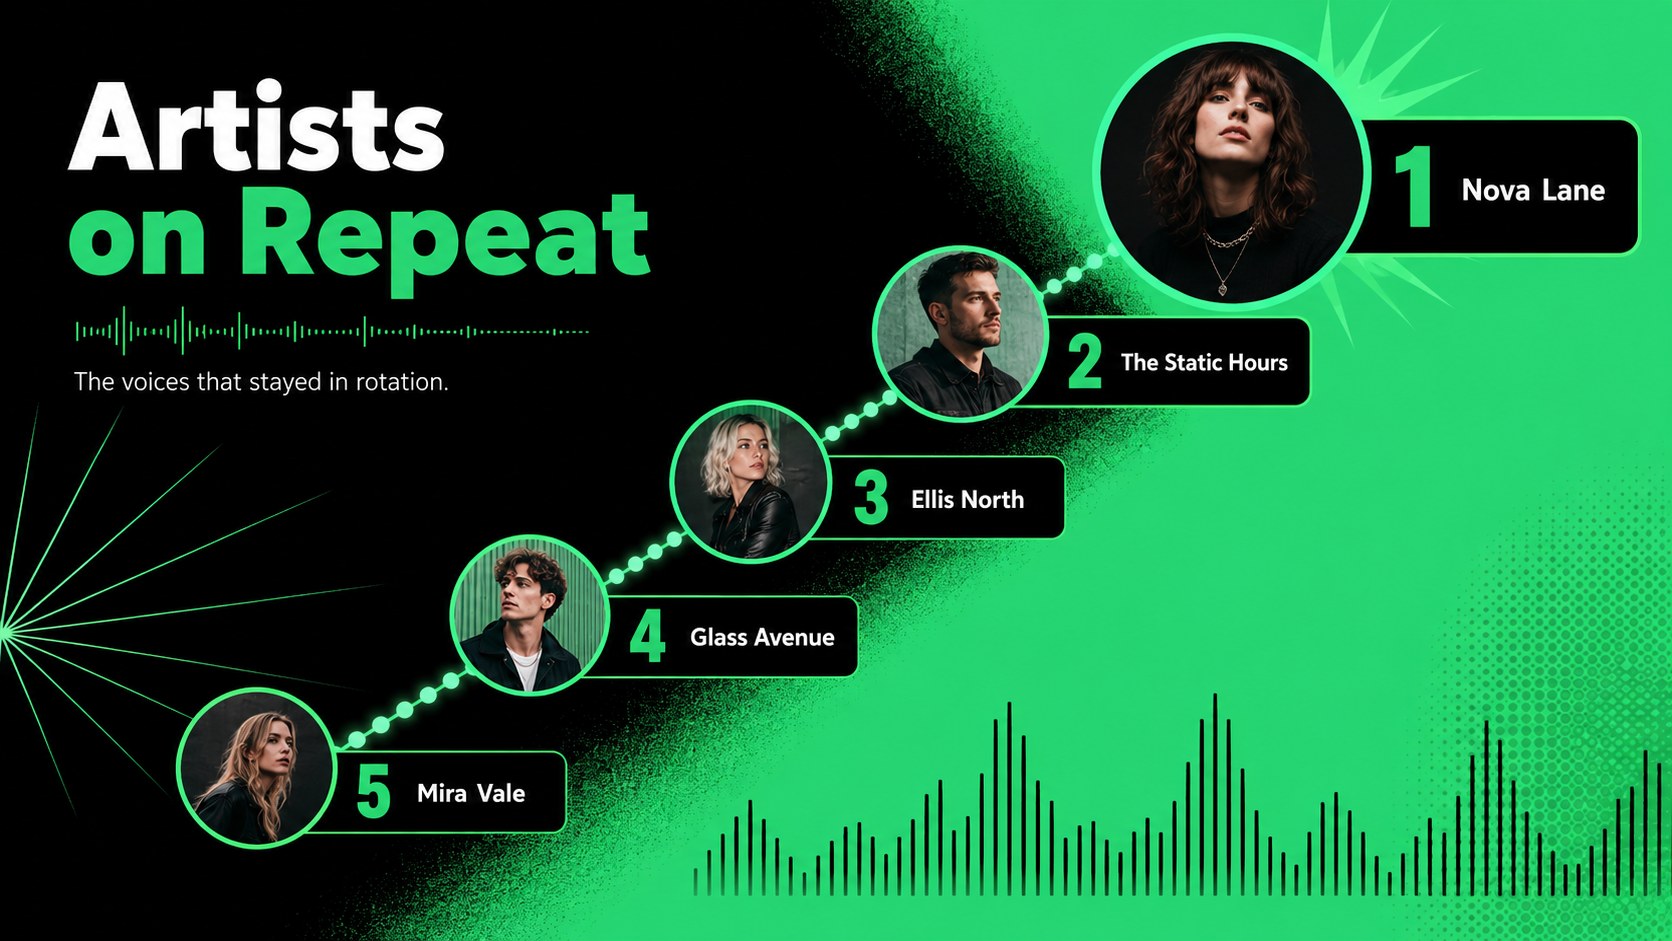
The 15-slide sequence includes layouts for top artists, most-played tracks, favorite genres, listening time, monthly trends, live events, new discoveries, memorable lyrics, and next-year predictions. Ranking pages, bold number treatments, charts, timelines, image frames, and short editorial layouts help turn raw listening data into a clear narrative. Every element can be adapted in PowerPoint or Google Slides, including text, colors, images, shapes, and data displays.
This end of year playlist recap template works well for music fans, content creators, fan clubs, student groups, independent artists, labels, and event organizers. Present a concert highlights slideshow, publish a social recap, or summarize audience listening habits without building a deck from scratch. The abstract geometric styling remains playful and energetic while keeping statistics easy to scan, making the template suitable for informal celebrations and polished professional reports alike.
Perfect for: personal listening recap; artist audience report; fan club year review; concert season highlights; playlist performance summary.
Frequently asked questions
Can I edit this music recap deck in PowerPoint? Yes. The text, colors, images, rankings, charts, and decorative shapes can be edited in PowerPoint to match your listening data and preferred visual style.
Practical details
Yes. The text, colors, images, rankings, charts, and decorative shapes can be edited in PowerPoint to match your listening data and preferred visual style.
Yes. Upload or open the deck in Google Slides to customize it in your browser, collaborate with others, and present or share the finished recap.
Replace the sample figures with data from your preferred music service or personal records. Update the chart labels, ranking order, percentages, and listening-time totals while keeping the supplied layout structure.
Yes. You can recolor the backgrounds, typography, charts, and geometric accents to suit an artist identity, event theme, or personal brand while preserving the modern high-contrast design.
Keep exploring
15Build an engaging World UFO Day session with this flying saucer history lesson deck, featuring retro green-and-brown slides for PowerPoint and Google Slides.
 15
15Plan a lively animal-learning journey with this jungle zoo adventure lesson deck, ready to customize in PowerPoint and Google Slides for young learners.
 16
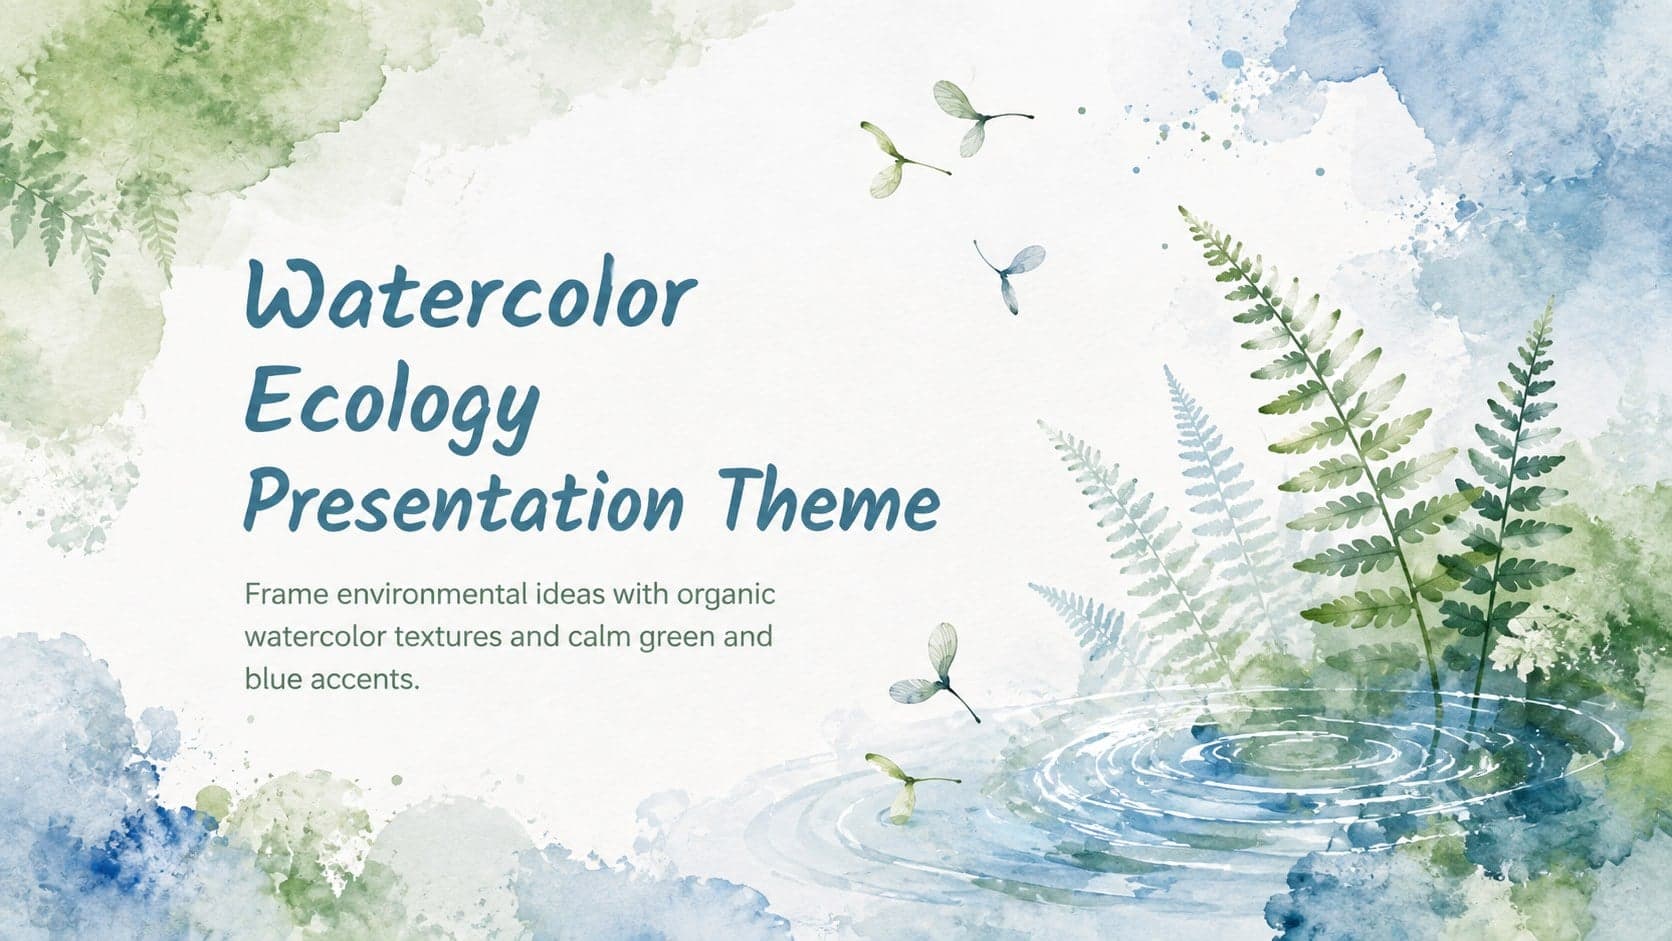
16Turn environmental research into a clear story with a Watercolor Ecology Presentation Theme for PowerPoint and Google Slides in calming green and blue.
 16
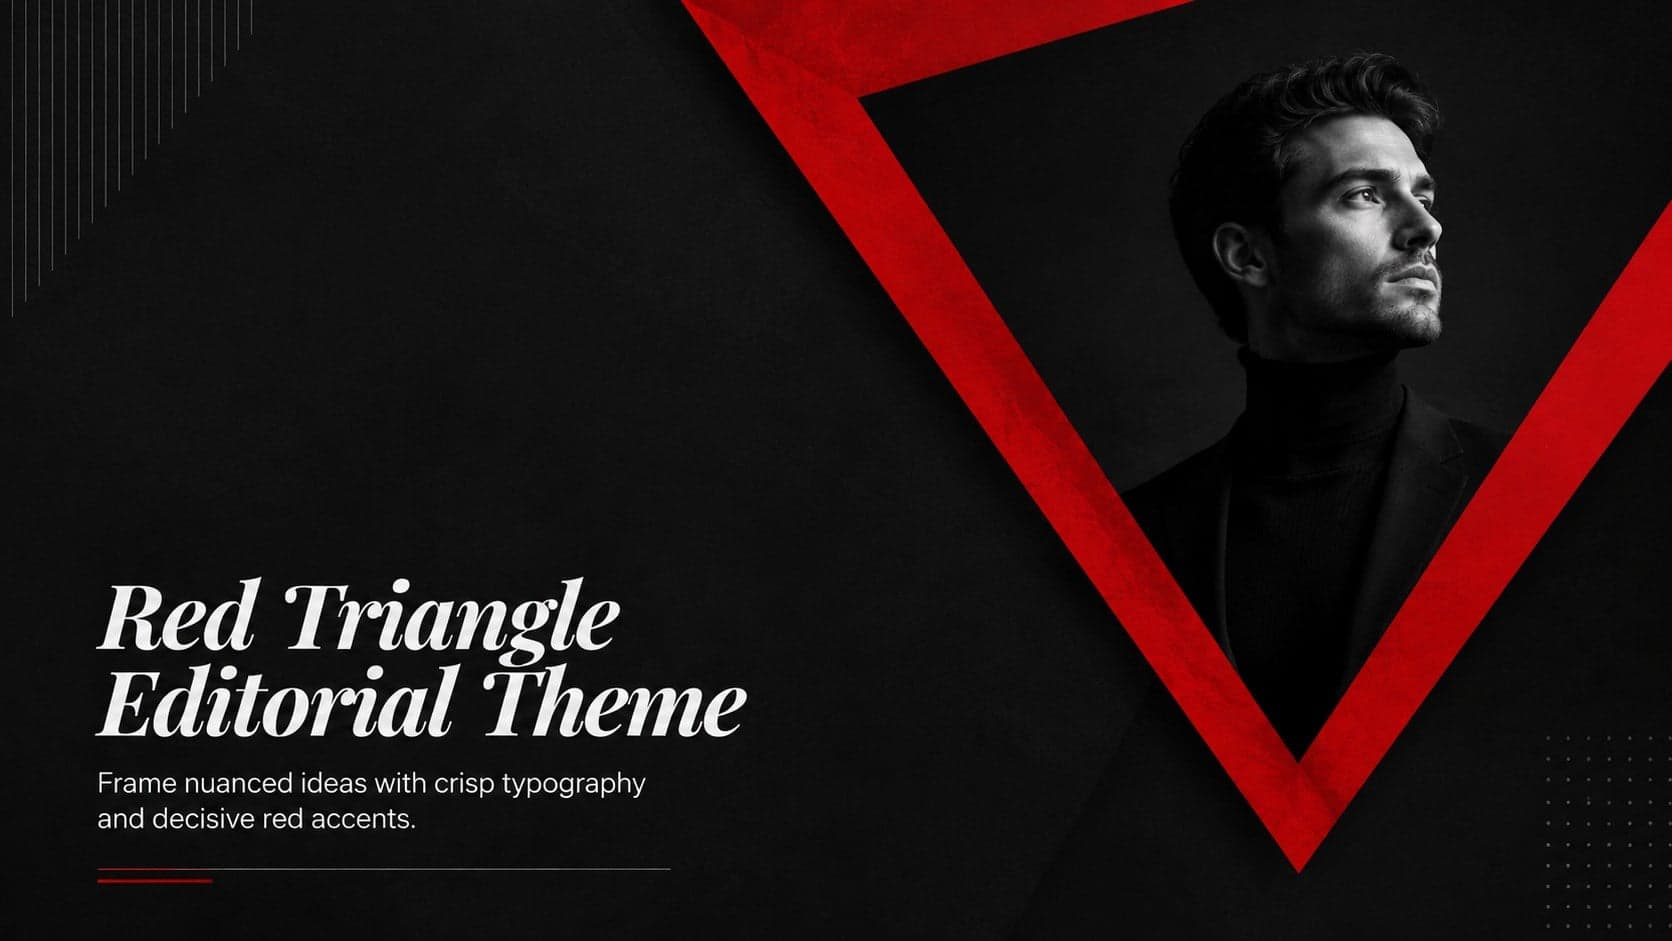
16Build focused fashion, literature, and humanities presentations with the Red Triangle Editorial Theme, editable in PowerPoint and Google Slides.
 15
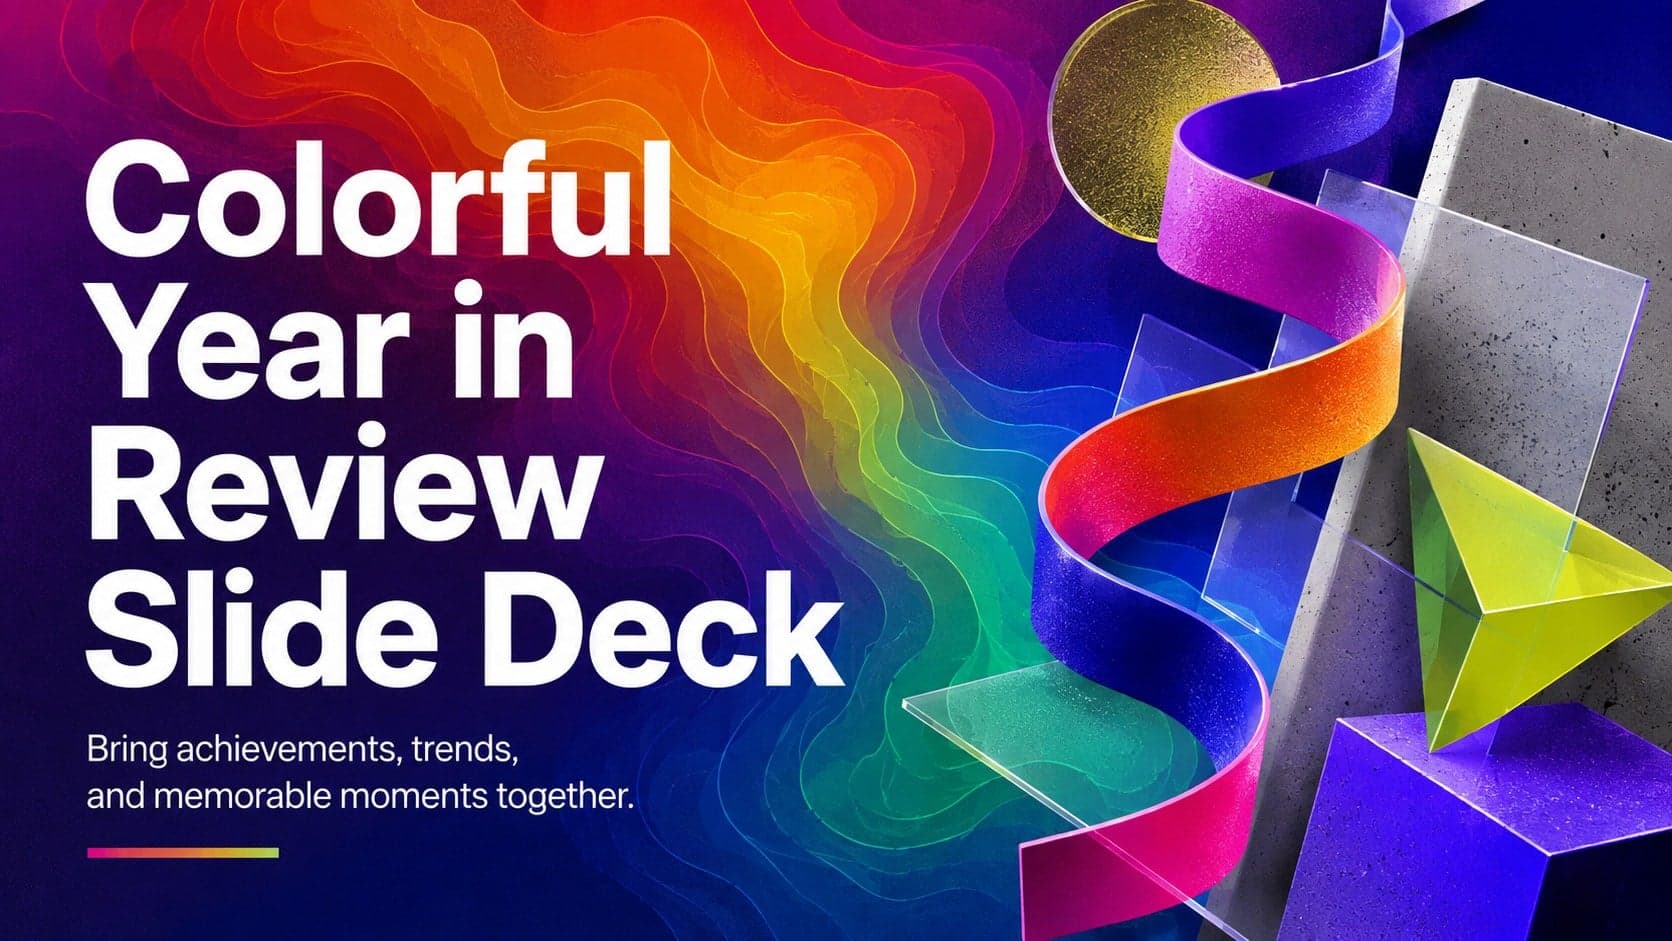
15Turn highlights, milestones, and favorite moments into a colorful year in review slide deck with bold 3D graphics for PowerPoint and Google Slides.
 3
3Build a credible endorsement with Standout Colleague Recommendation Letter Slides, featuring colorful prompts for skills, achievements, and team impact.
 4
4Build clear beginner sessions with an ice hockey fundamentals training deck for coaches, PE teachers, and clubs, ready for PowerPoint and Google Slides.
 14
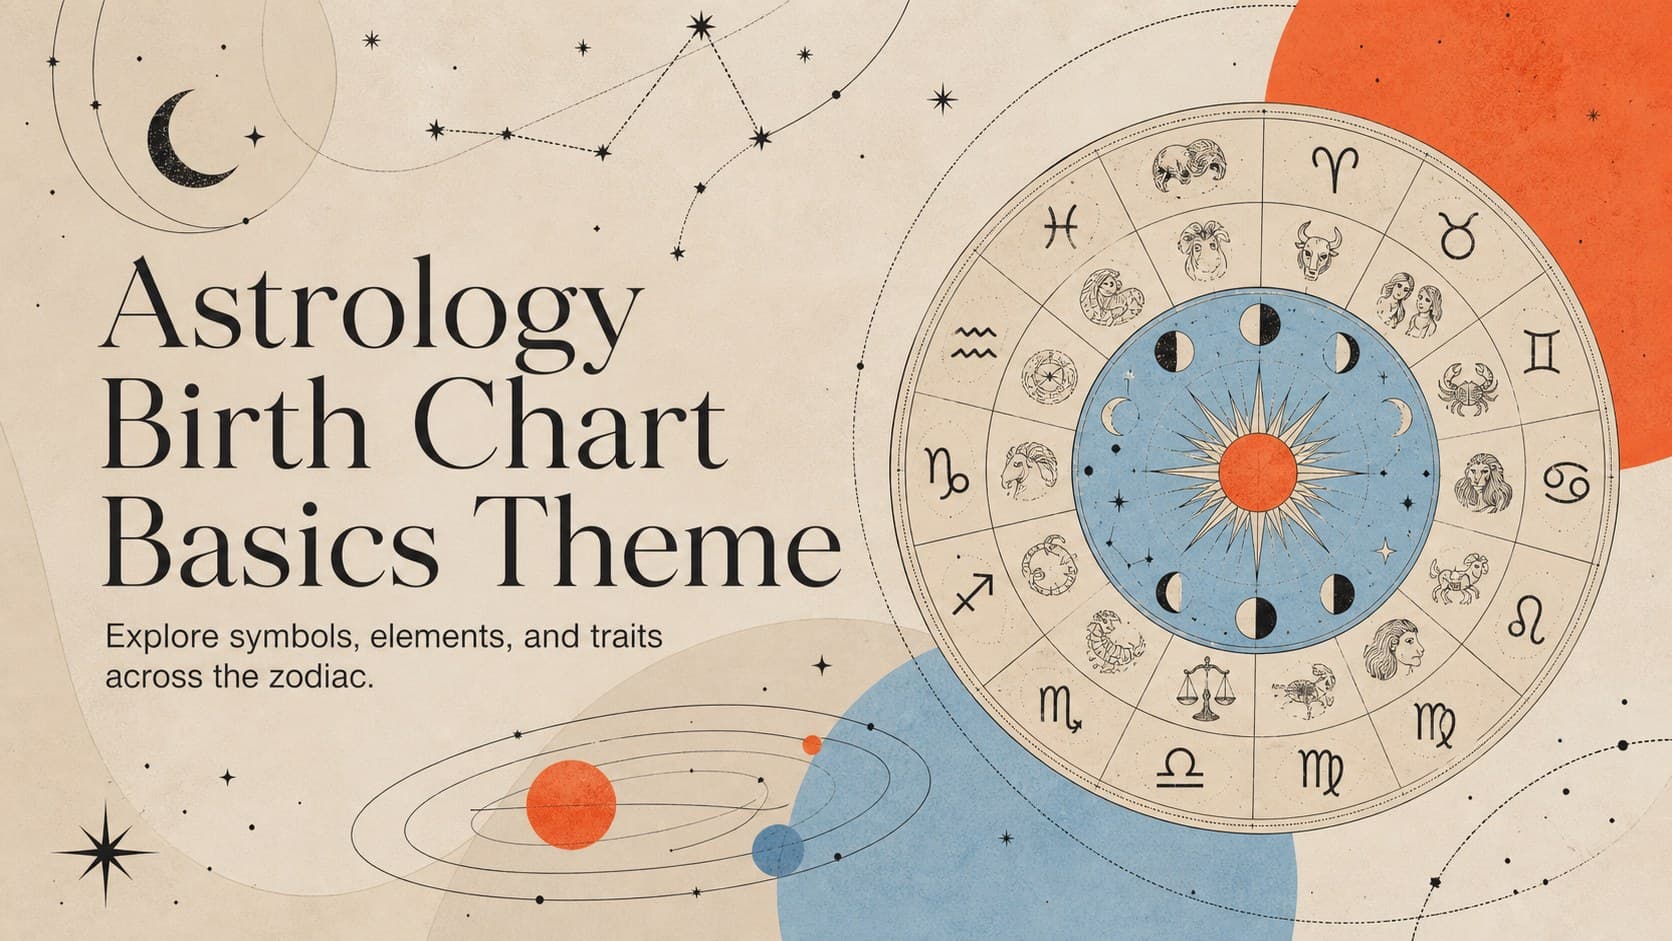
14Teach the zodiac with an astrology birth chart basics theme featuring 14 editable, illustrated slides for PowerPoint and Google Slides in cosmic colors.