
 4
document
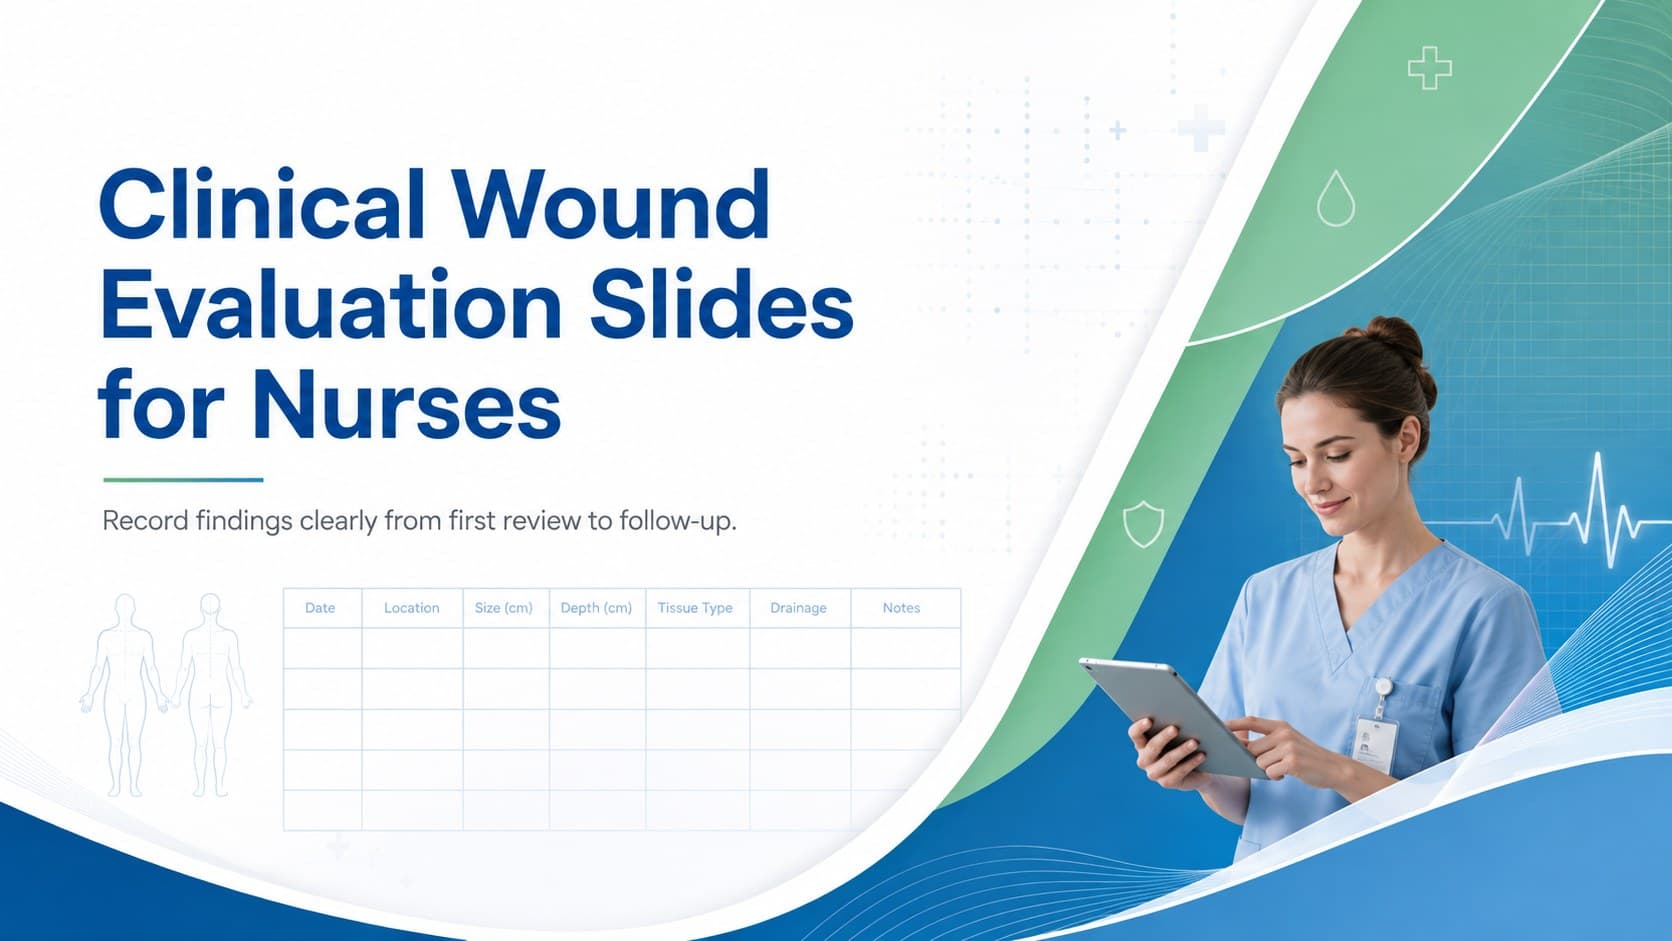
Clinical Wound Evaluation Slides for Nurses
Document wound findings, treatment decisions, and healing progress with clinical wound evaluation slides for nurses in PowerPoint and Google Slides.
Google Docs
document · English
Turn methods, observations, and results into a polished scientific experiment report deck for classroom labs, research reviews, and team presentations.

Design notes
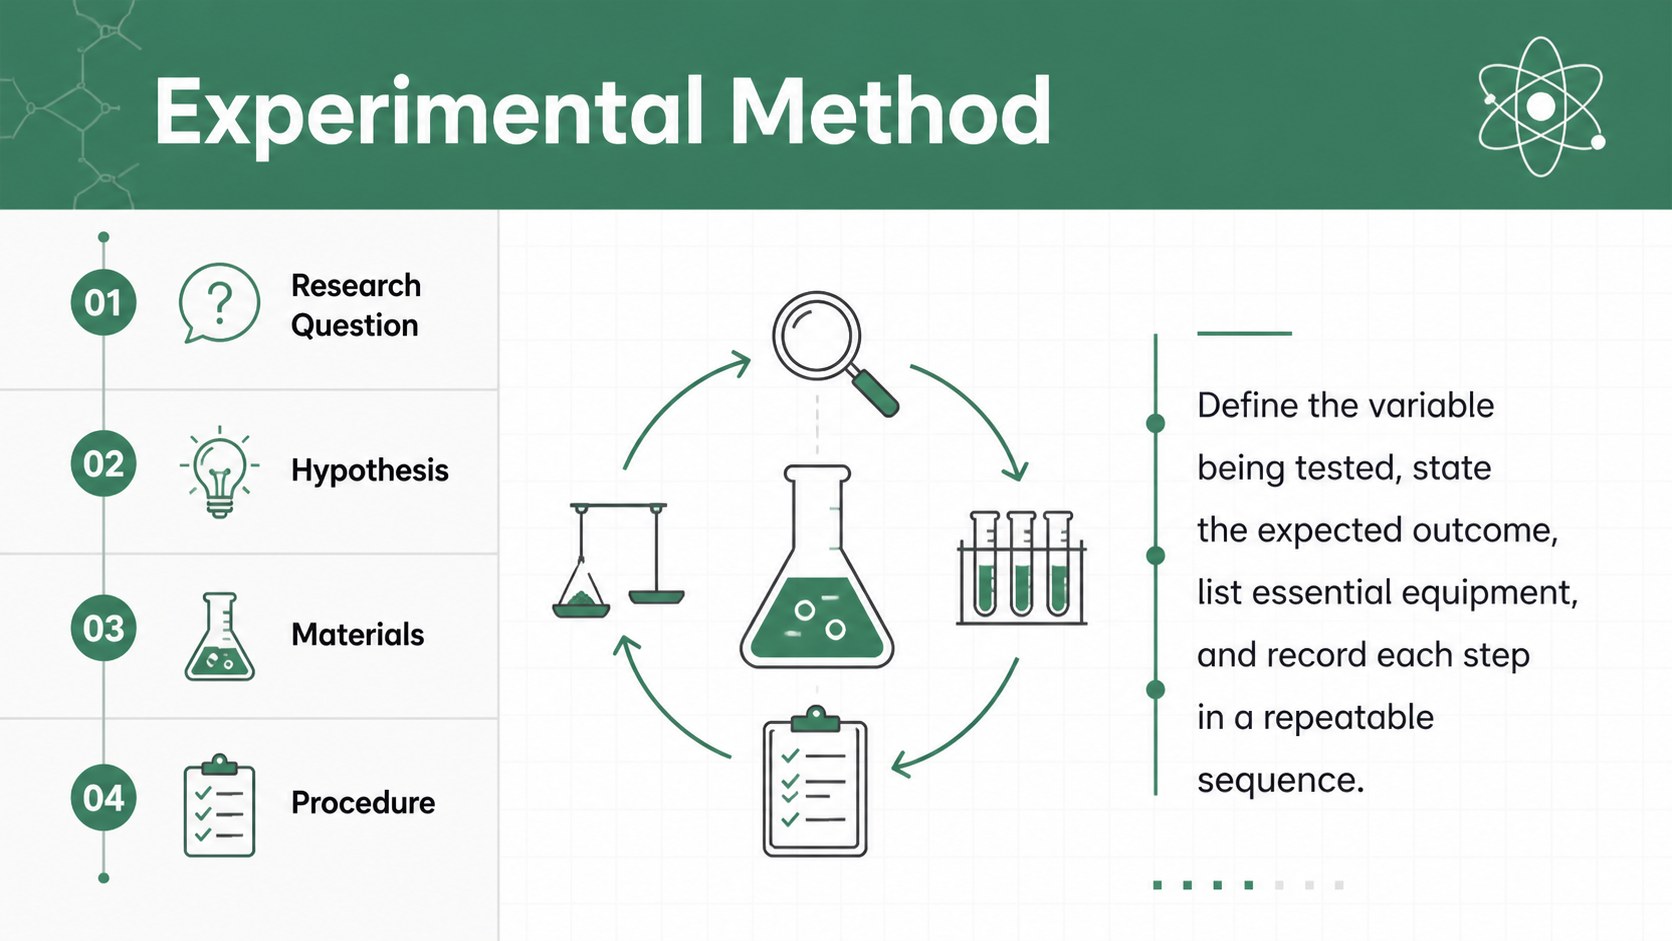
Turn raw observations into a clear story with this scientific experiment report deck. Designed for organized scientific communication, it provides a polished framework for explaining the purpose of an experiment, documenting procedures, presenting evidence, and summarizing conclusions. The modern visual system combines white space with black and grey details, green accents, and subtle gradients for a focused, professional appearance.
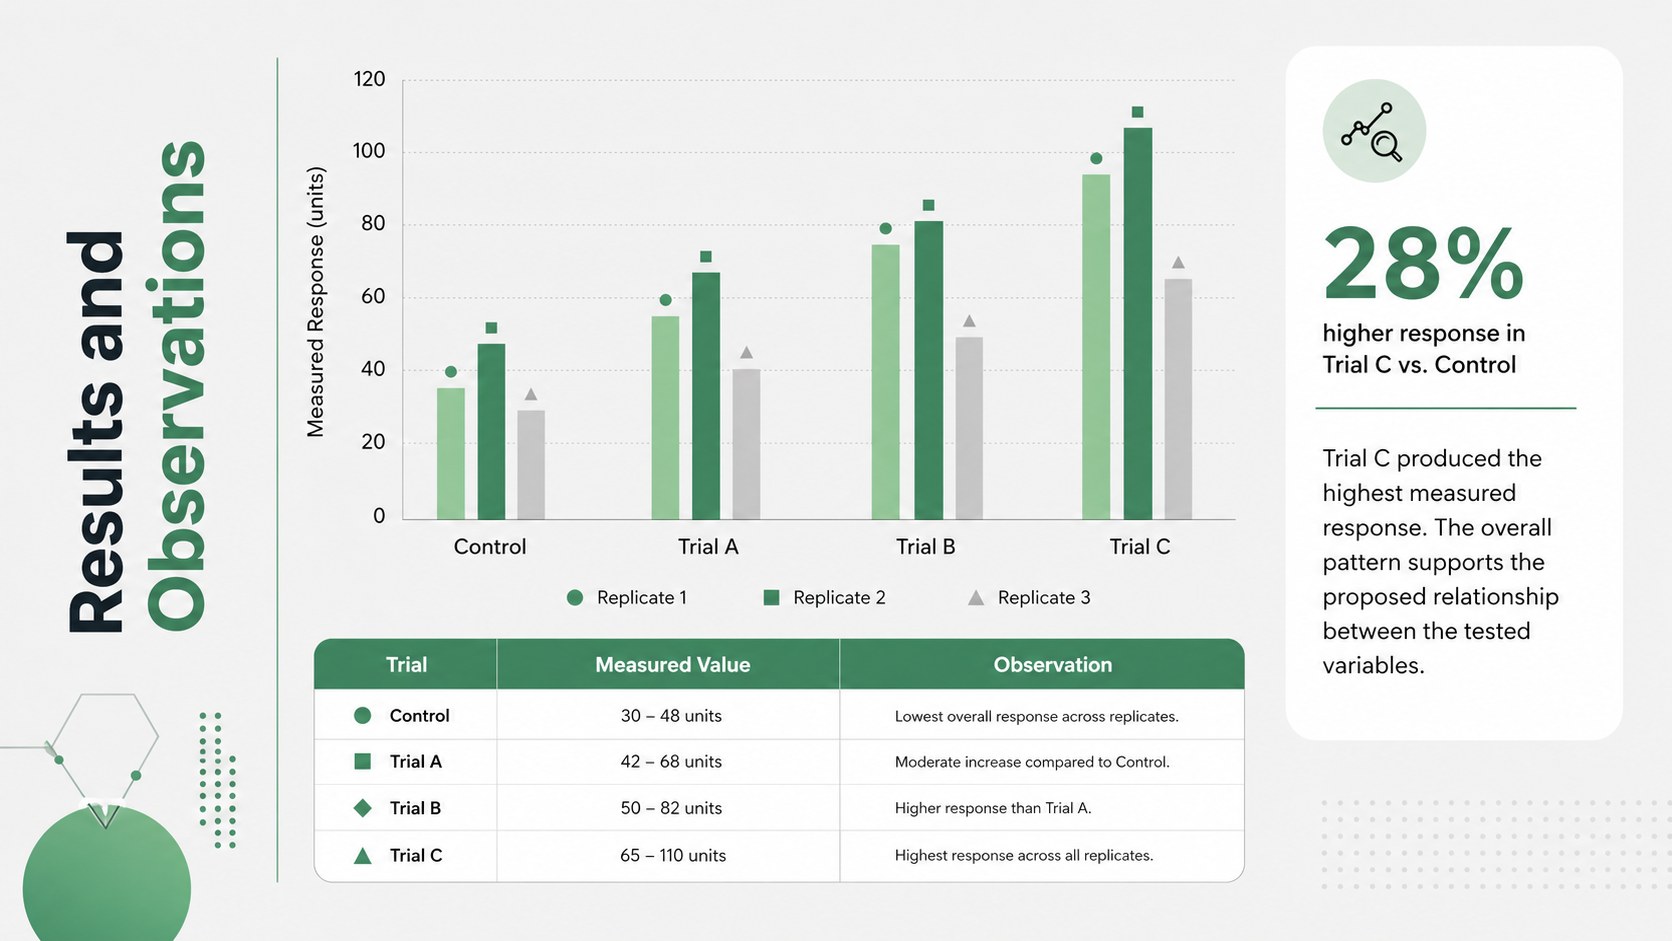
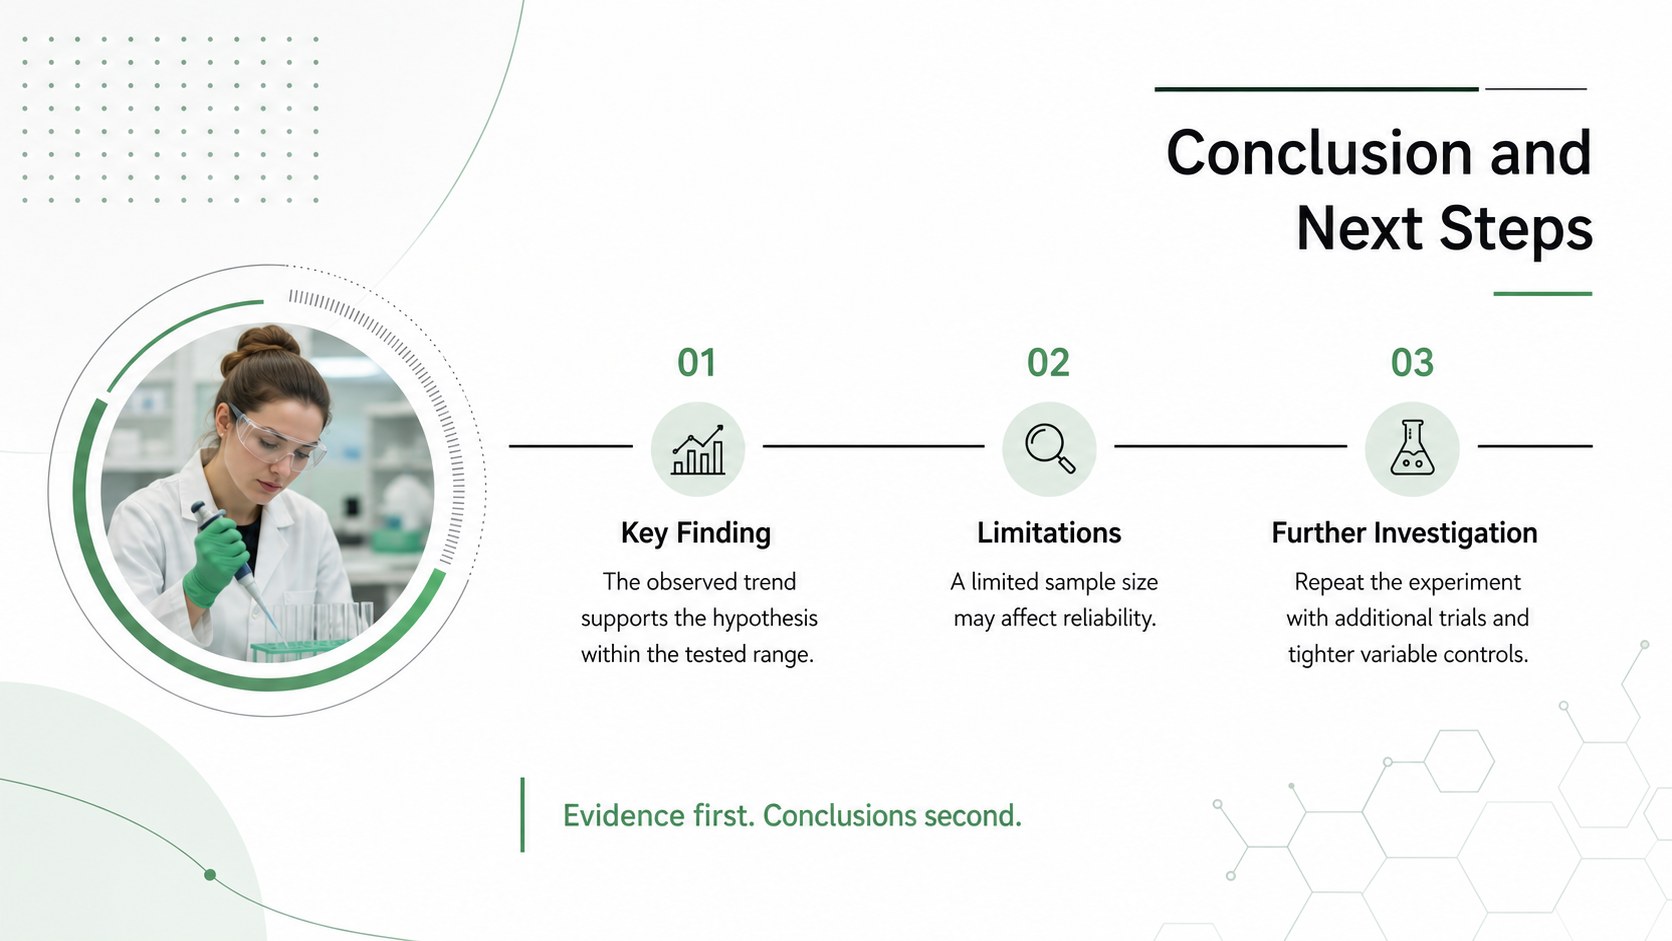
The deck includes layouts for a title page, research question, hypothesis, materials, experimental method, observations, data analysis, results, limitations, and final conclusions. Tables, charts, image spaces, and concise text sections help transform notes into a laboratory findings presentation template that audiences can follow. Every element can be edited in PowerPoint or Google Slides, including colors, typography, diagrams, and data displays.
Use it for a student experiment results presentation, a science fair experiment report, a university practical assessment, or an internal research review. It suits secondary school learners, university students, science educators, laboratory assistants, and professional researchers who need a consistent reporting structure. Add your own measurements, photographs, charts, and citations to create a presentation that reflects the experiment accurately while keeping complex findings readable.
Perfect for: school laboratory assessment; science fair presentation; university practical report; research team review; experiment results briefing.
Frequently asked questions
Can I edit this deck in PowerPoint and Google Slides? Yes. The layouts, text, colors, charts, and graphic elements can be customized in both PowerPoint and Google Slides. Replace the sample content with your own experiment details and findings.
Practical details
Yes. The layouts, text, colors, charts, and graphic elements can be customized in both PowerPoint and Google Slides. Replace the sample content with your own experiment details and findings.
Update the terminology, data displays, diagrams, and images to match biology, chemistry, physics, environmental science, or another discipline. The green, white, black, and grey palette can also be adjusted to suit your institution or project.
Include measured values, relevant units, charts or tables, significant observations, and a brief interpretation of the evidence. Clearly distinguish recorded results from conclusions or assumptions.
Yes. Use the image areas for apparatus, samples, procedures, or outcomes, and add source details in the designated text sections. Keep captions concise and use a consistent citation style throughout.
Keep exploring
4Document wound findings, treatment decisions, and healing progress with clinical wound evaluation slides for nurses in PowerPoint and Google Slides.
 4
Turn recurring updates into clear decisions with a weekly operations status briefing for PowerPoint and Google Slides, covering progress, risks, and priorities.
 4
Turn recurring check-ins into focused decisions with a weekly leadership update deck for KPIs, priorities, blockers, owners, and next actions.
 4
Use veterinary surgery consent form slides to explain procedures, anesthesia, risks, costs, and emergency decisions clearly before client approval.
 4
Organize objectives, activities, and daily notes with this weekly classroom planner for teachers, editable in PowerPoint and Google Slides for easy prep.
 4
Create colorful vocabulary assessment slides for lively word checks, review games, and classroom practice in PowerPoint or Google Slides. Easy to personalize.
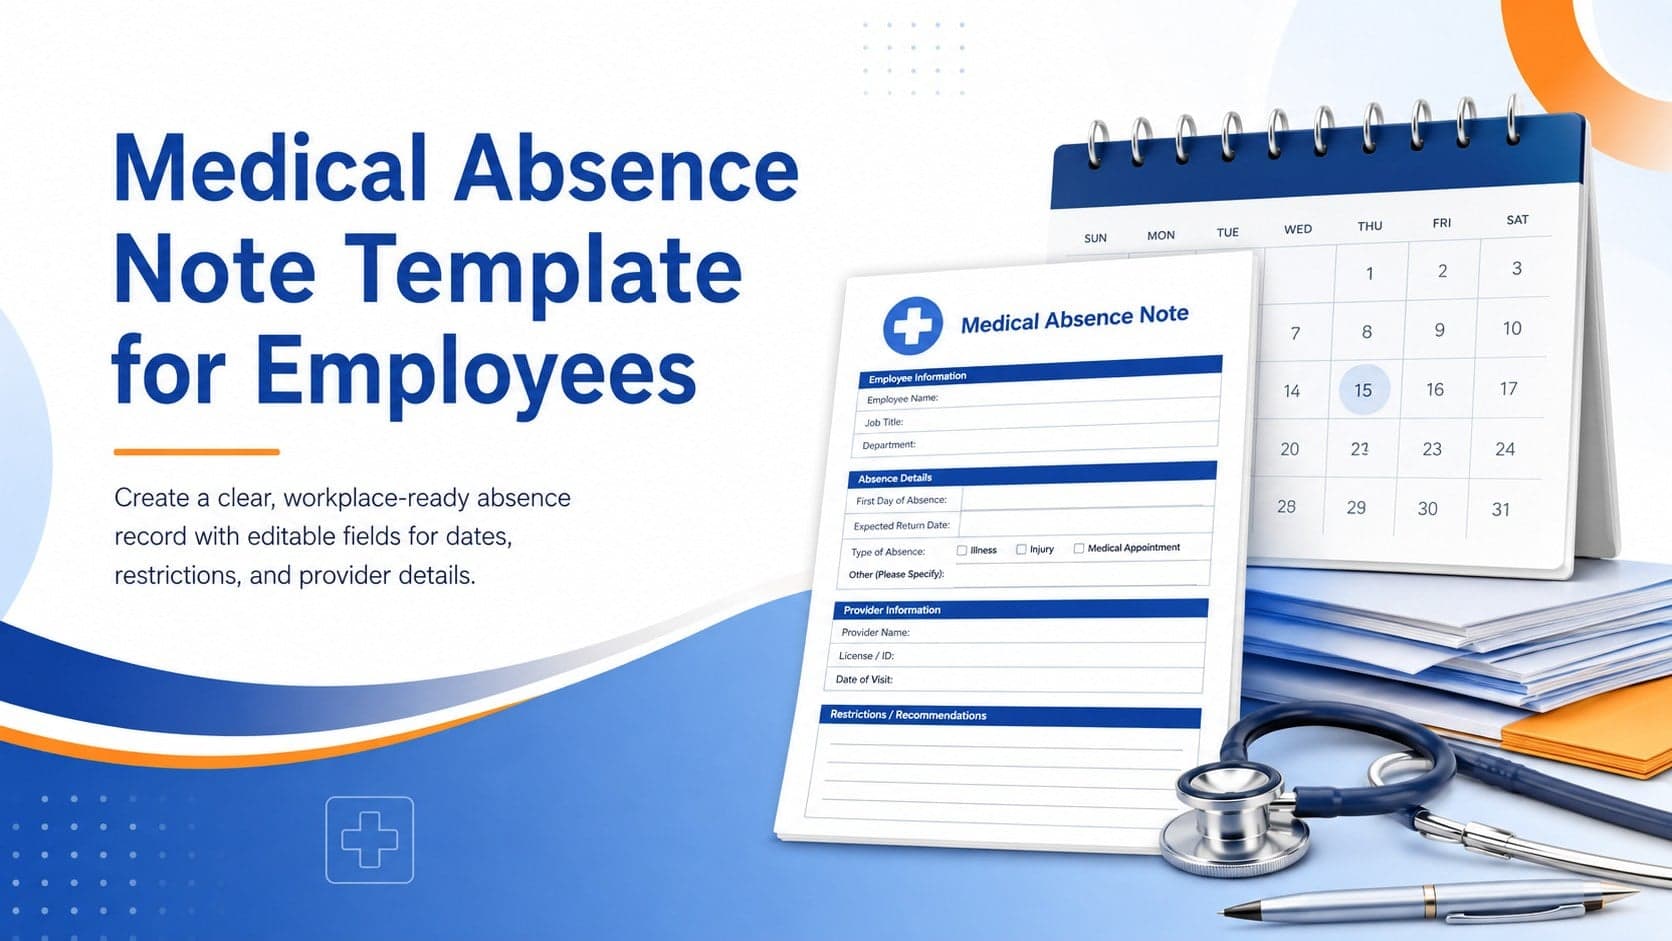 4
Prepare a clear medical absence note template for employee records, with editable fields and polished blue-orange slides for PowerPoint and Google Slides.
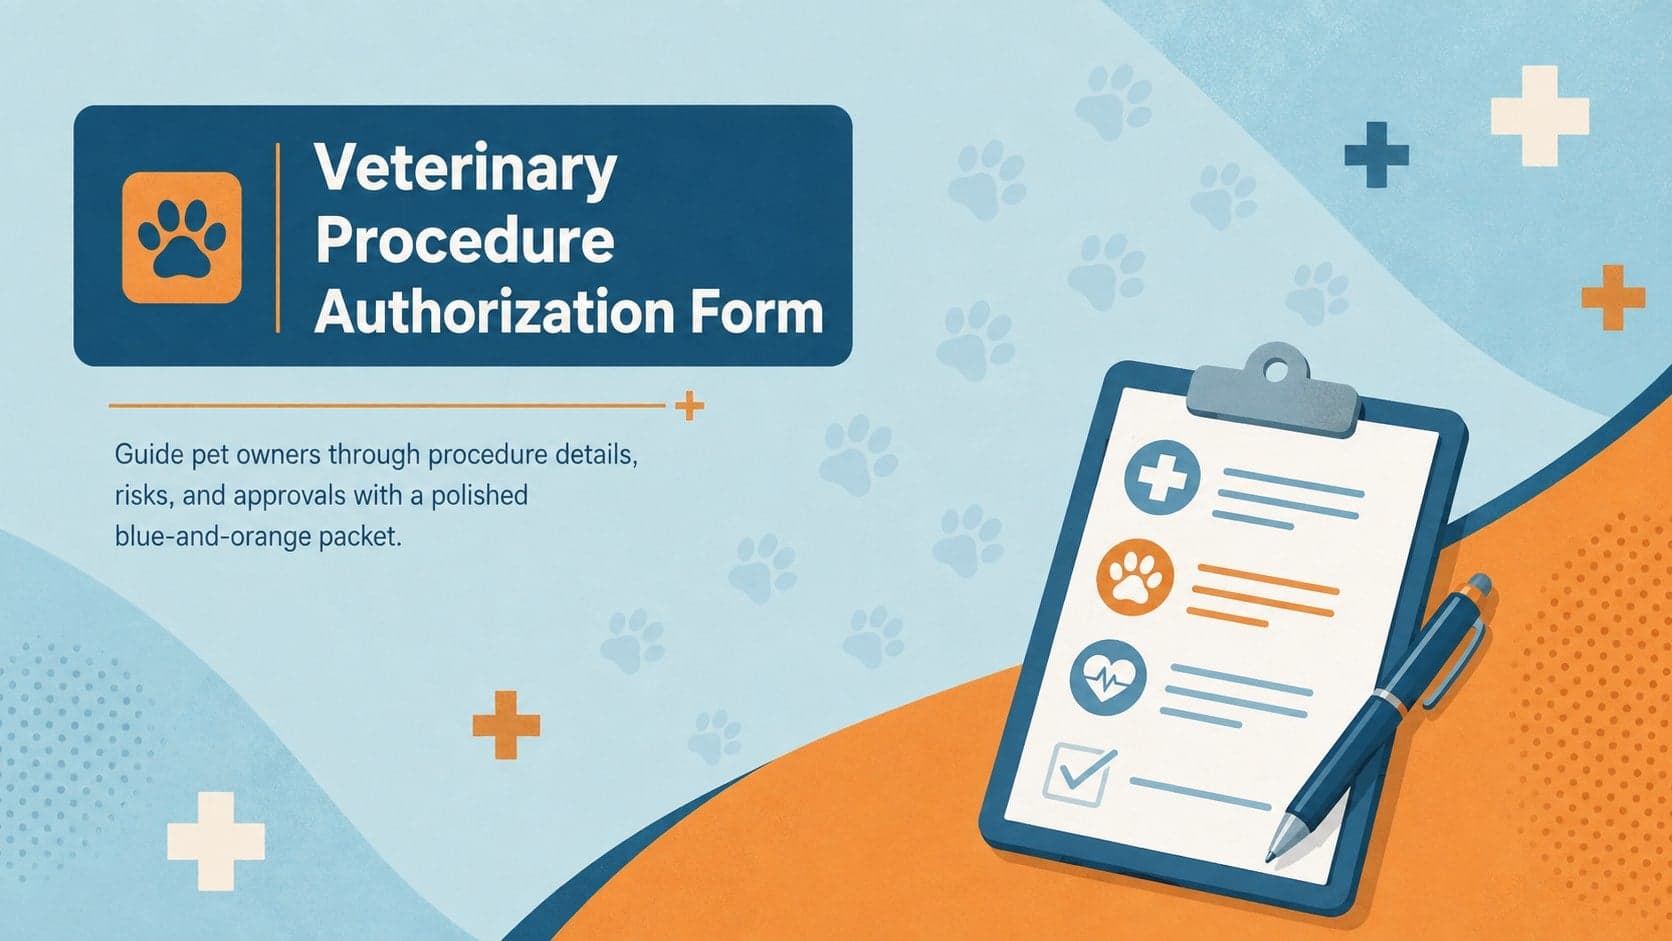 4
Prepare pet owners for treatment with a veterinary procedure authorization form covering risks, medication, contacts, and approval details.