
 15
presentation
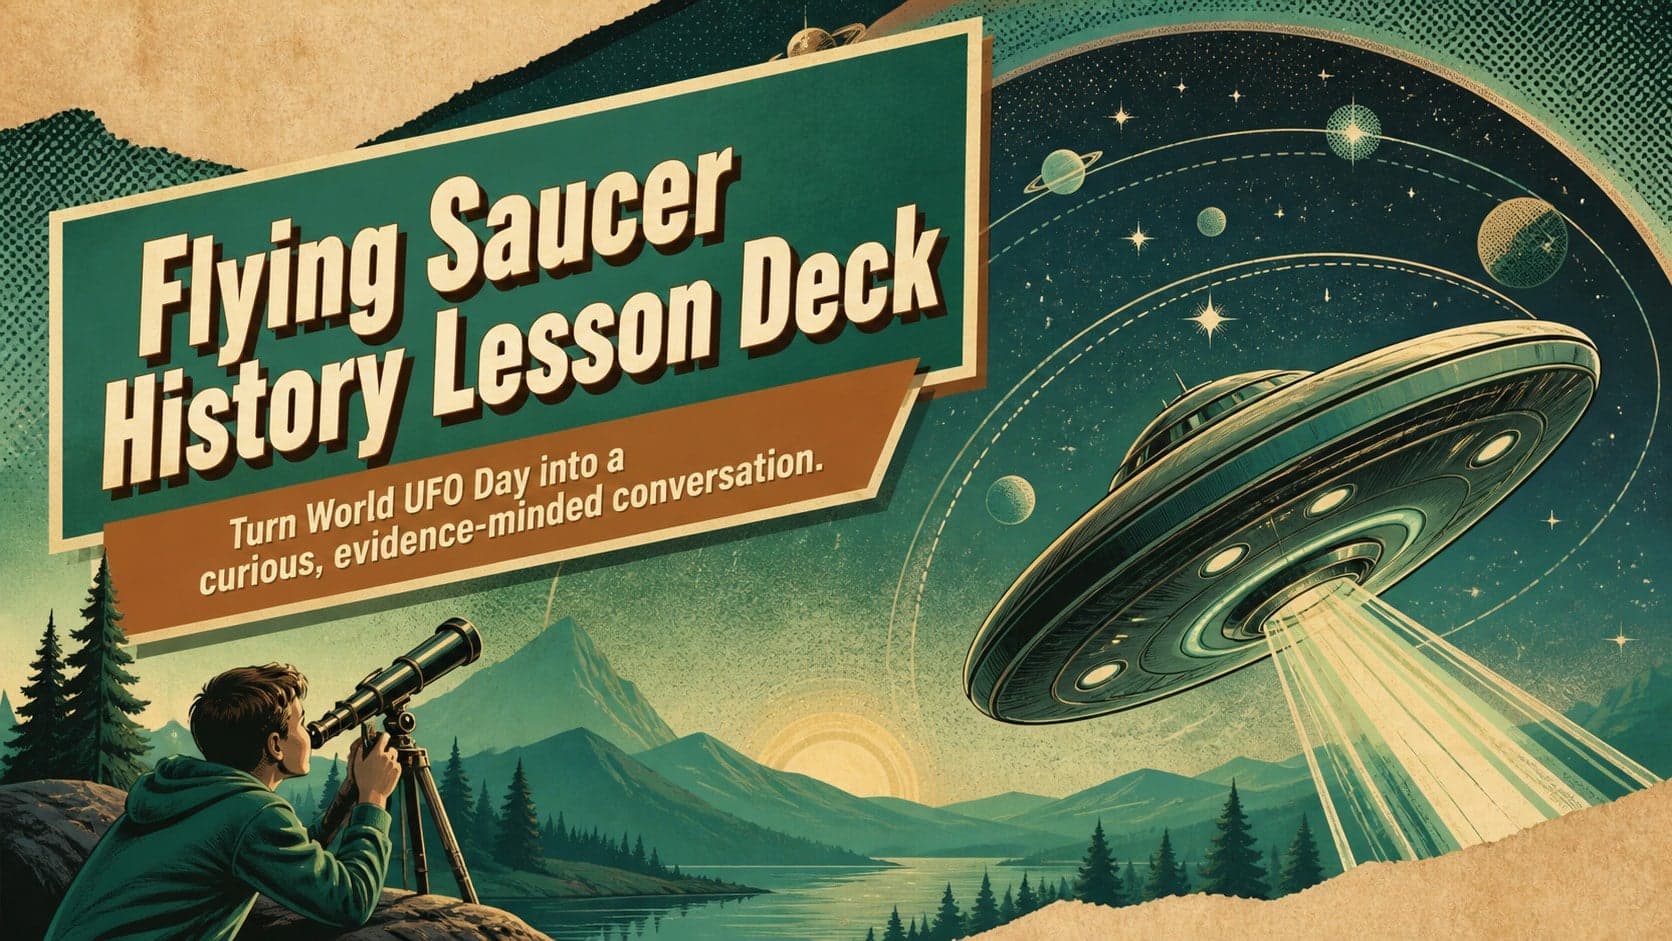
Flying Saucer History Lesson Deck
Build an engaging World UFO Day session with this flying saucer history lesson deck, featuring retro green-and-brown slides for PowerPoint and Google Slides.
Google SlidesPowerPoint
presentation · English
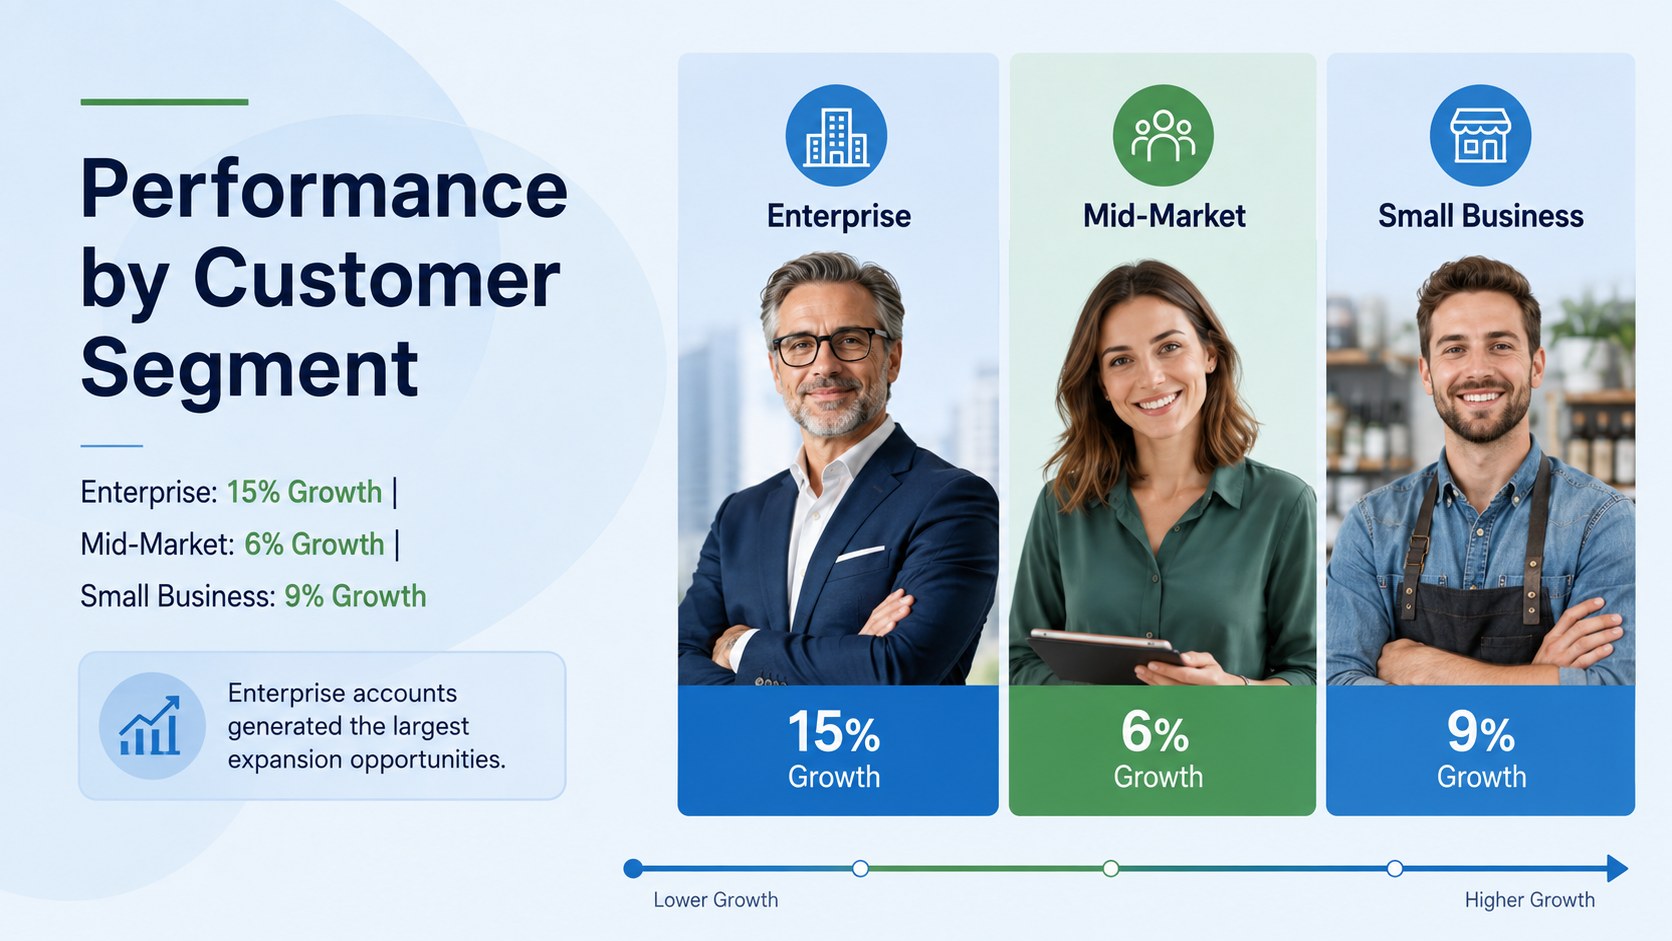
Build a clear quarterly sales insights presentation for leadership with editable blue-and-green charts that reveal wins, risks, and practical next steps.

Design notes
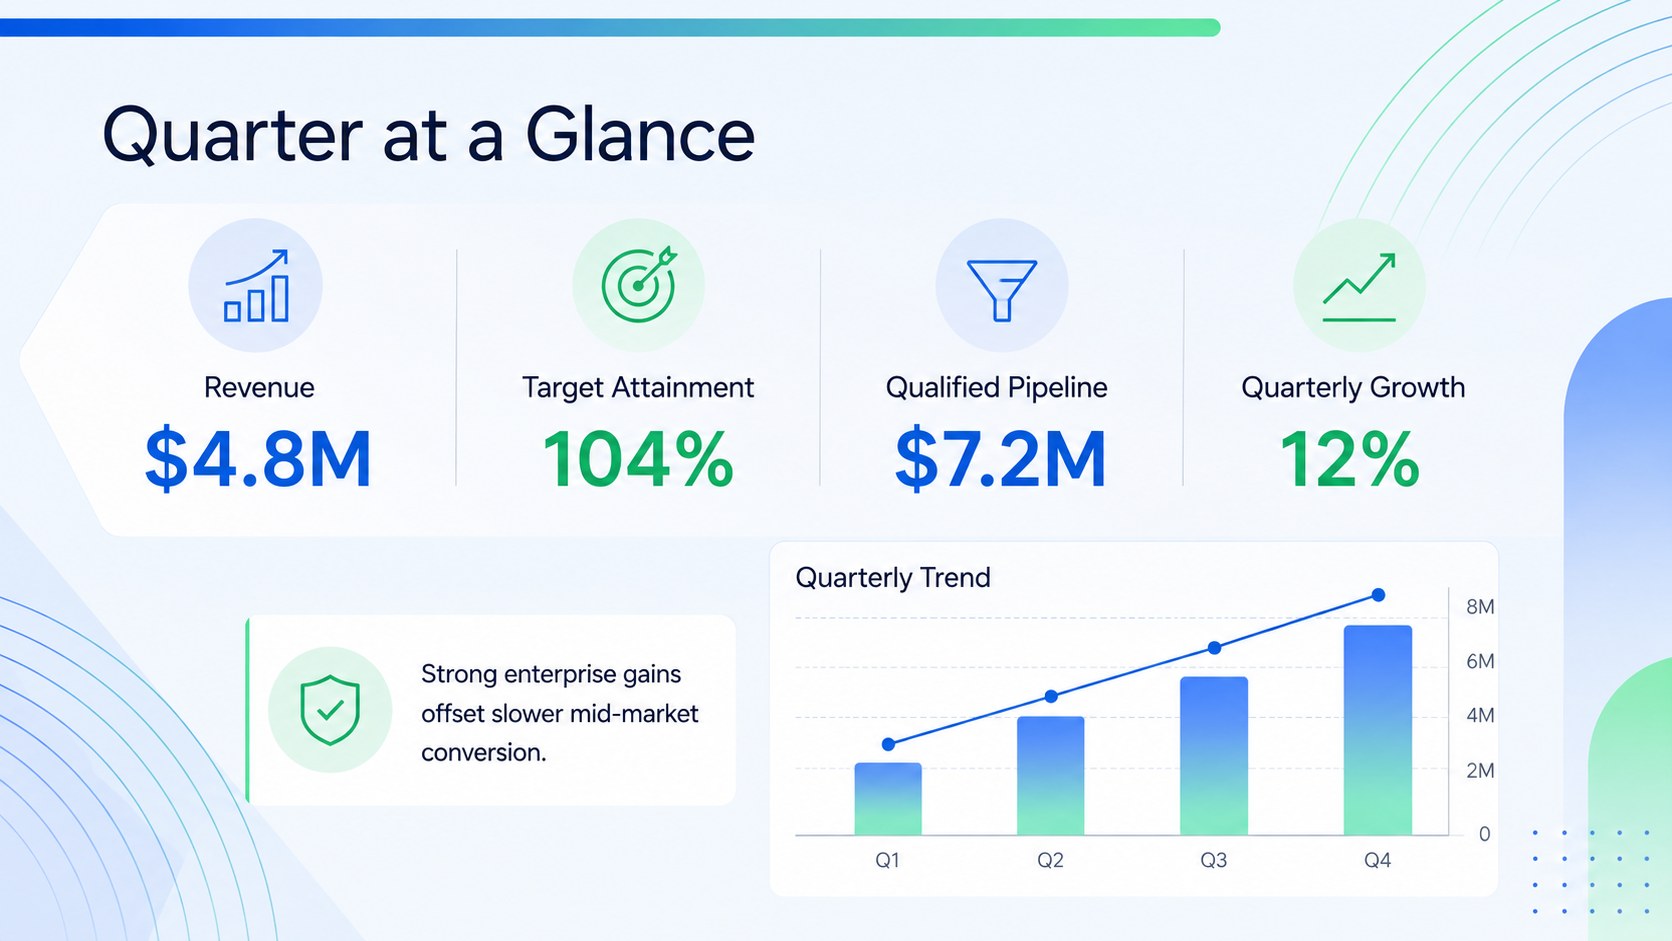
Turn complex commercial data into an actionable story with this quarterly sales insights presentation. Designed for structured business reviews, the deck helps teams communicate performance clearly without overwhelming stakeholders. Its crisp blue, green, and white palette combines gradient accents with professional layouts that keep attention on the numbers.
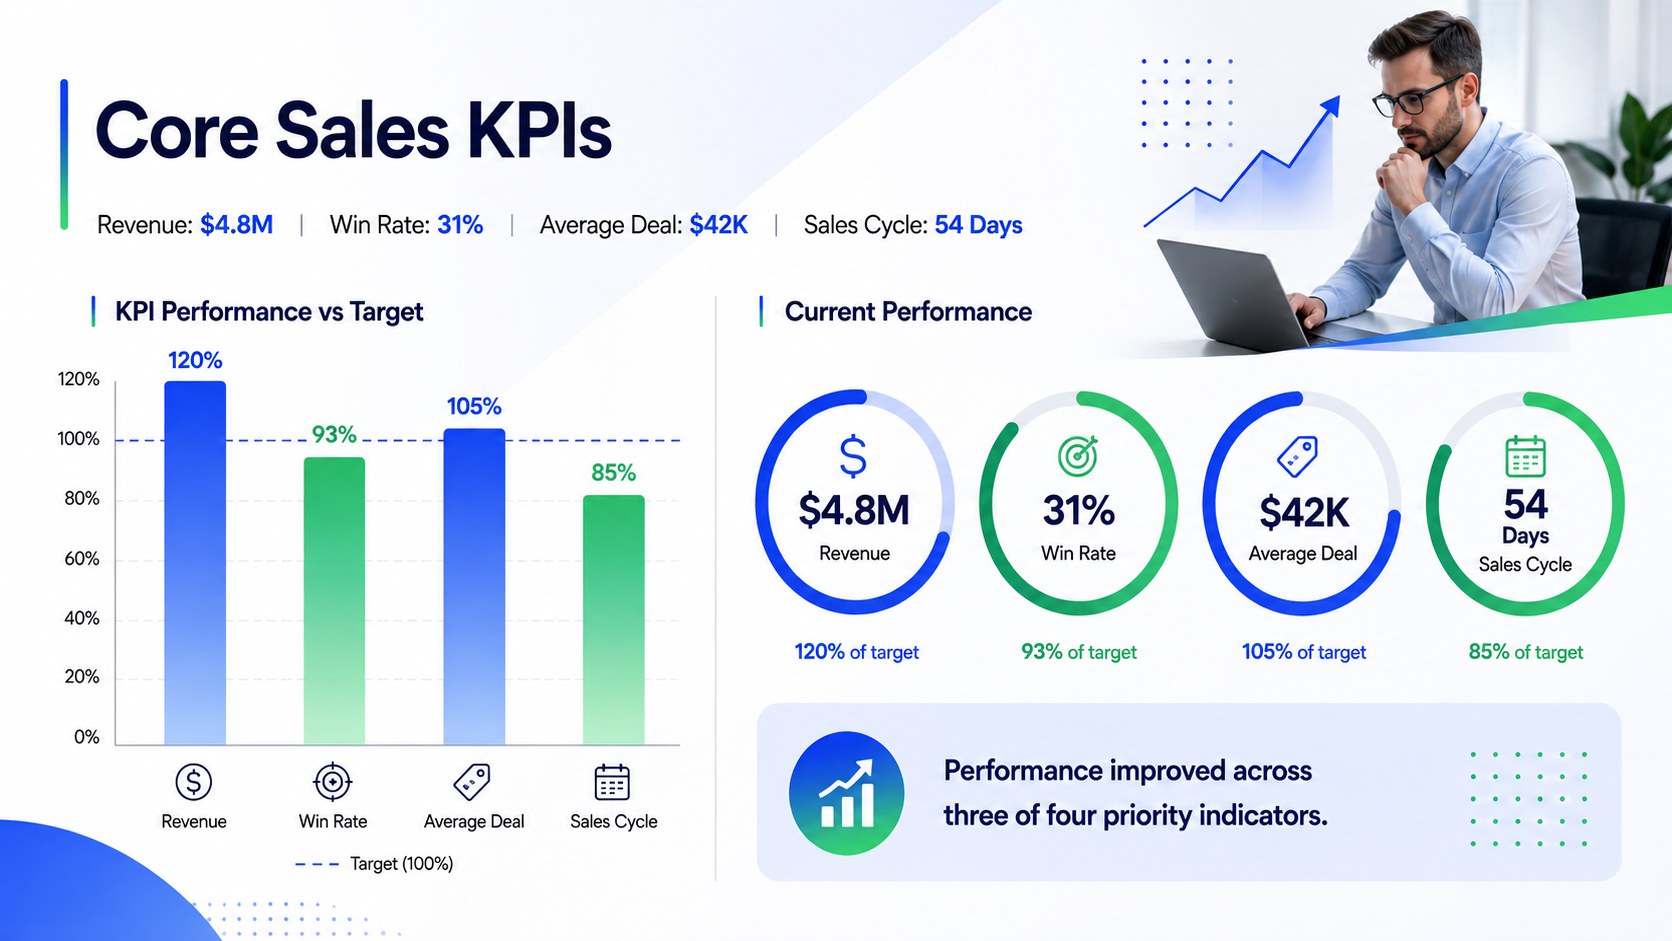
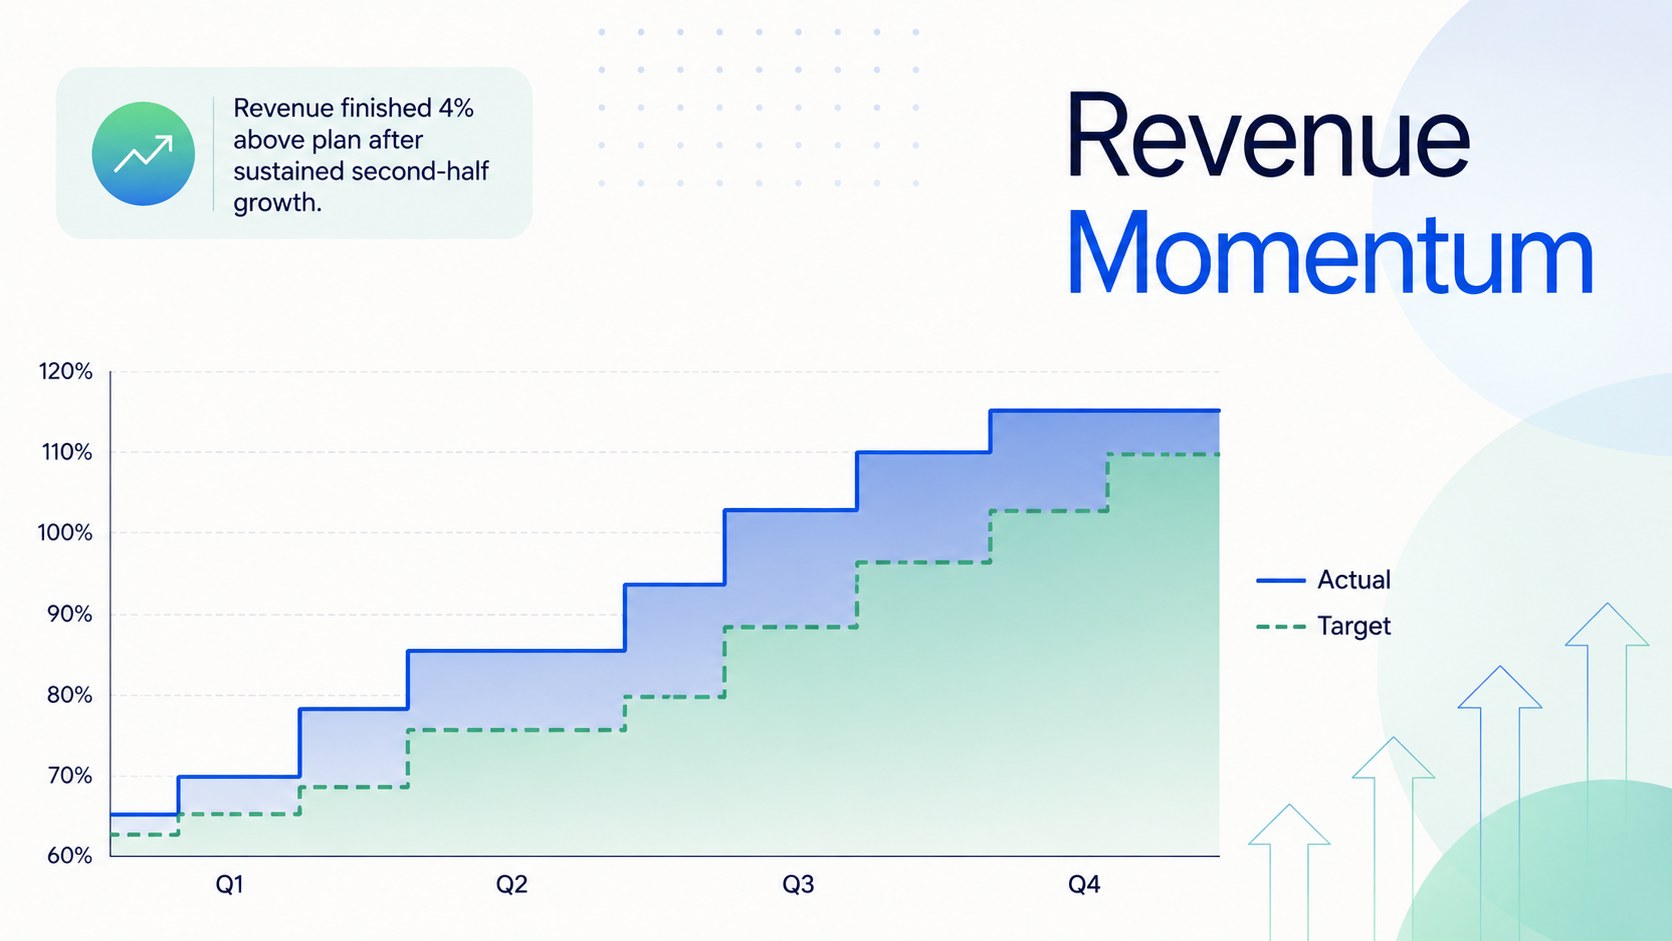
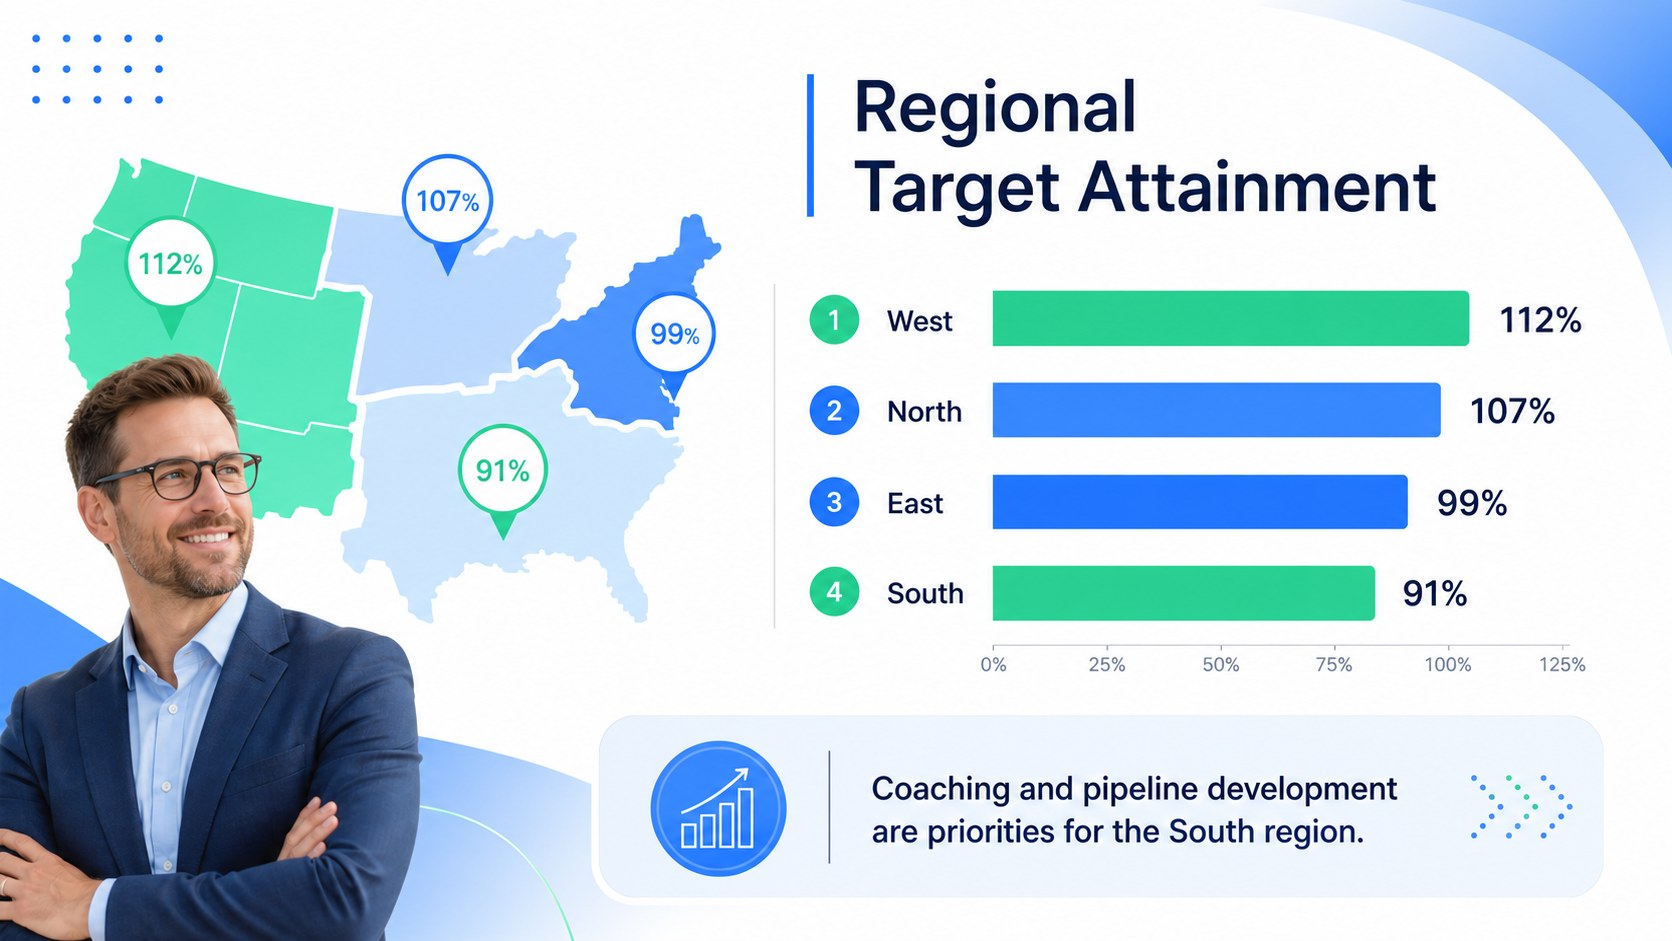
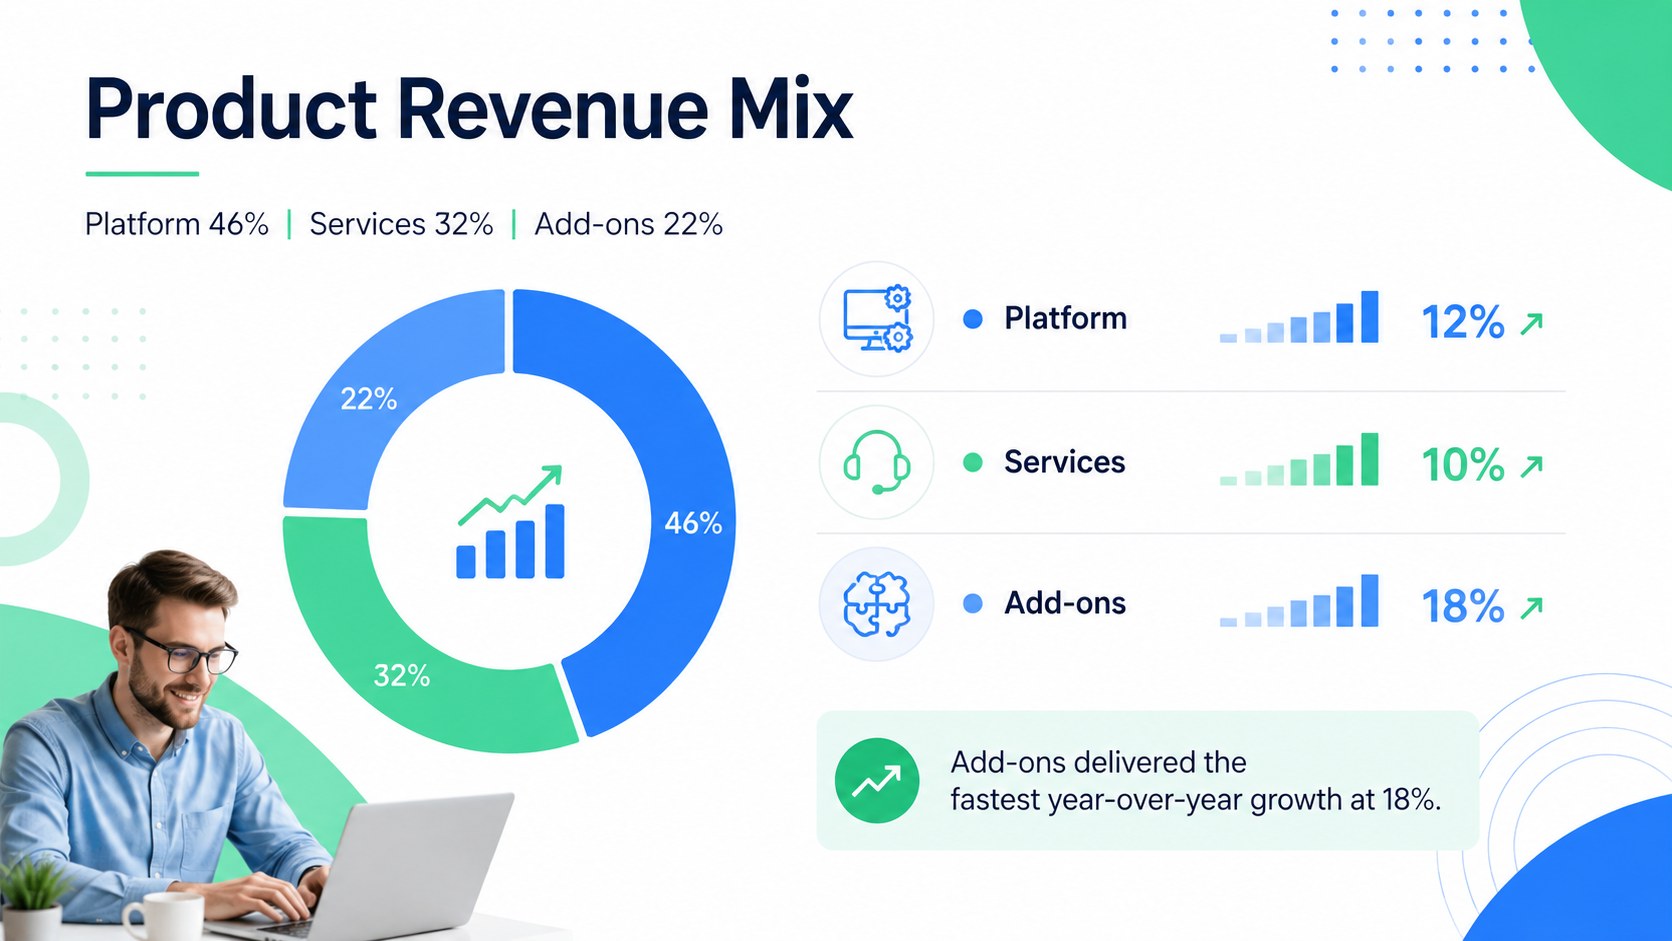
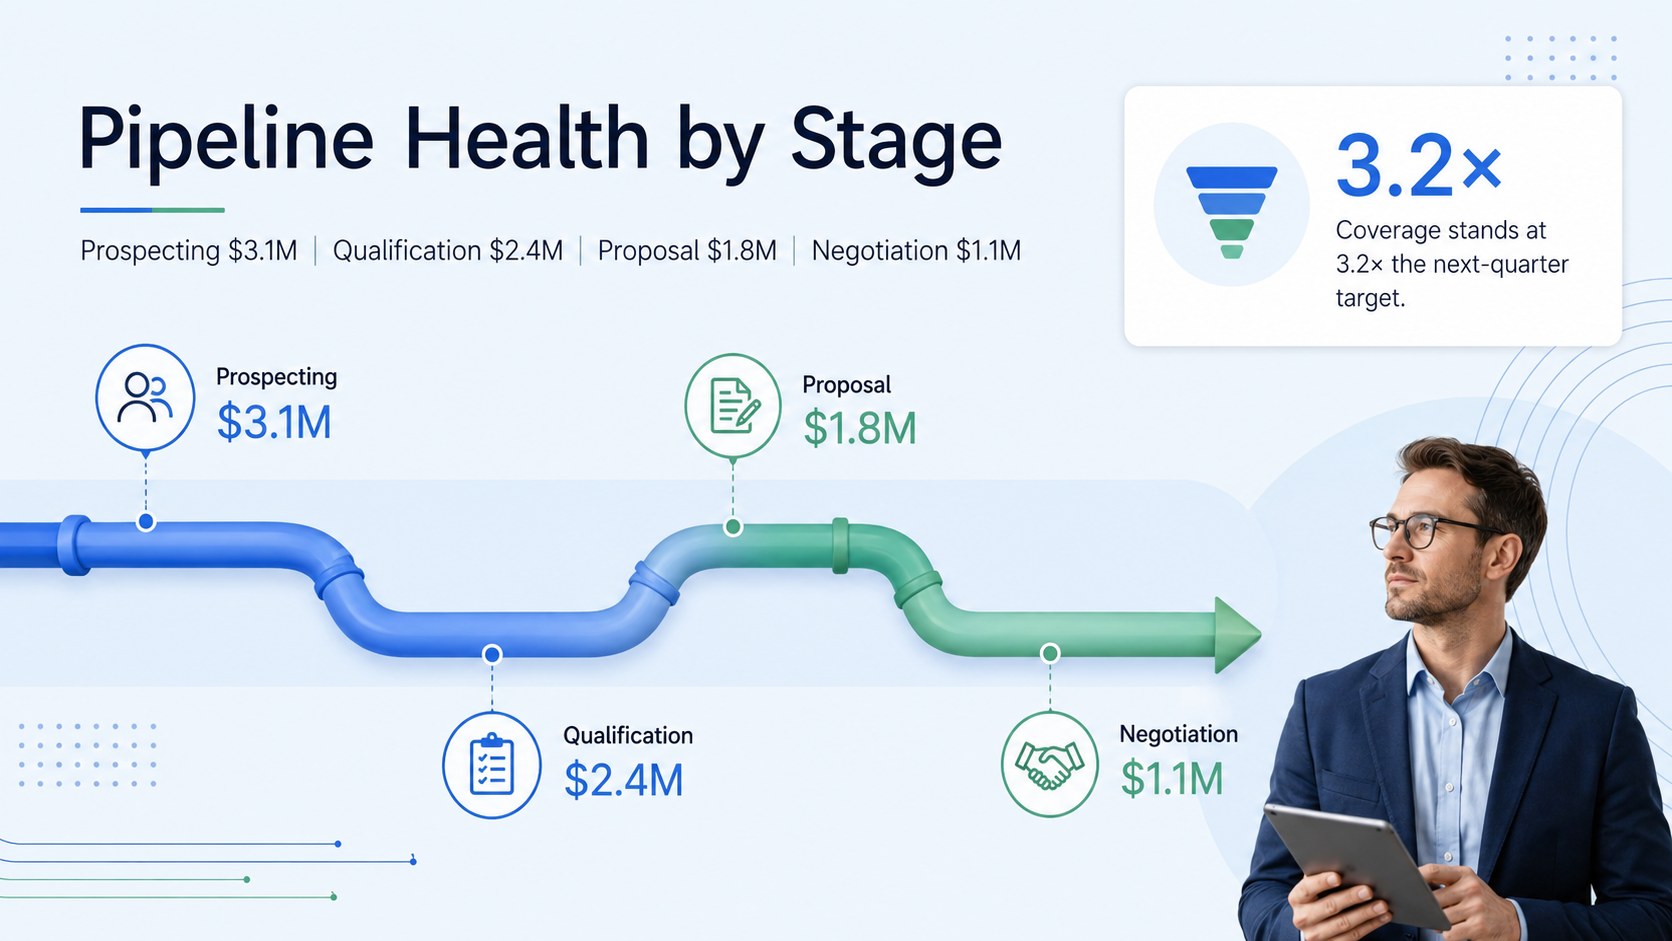
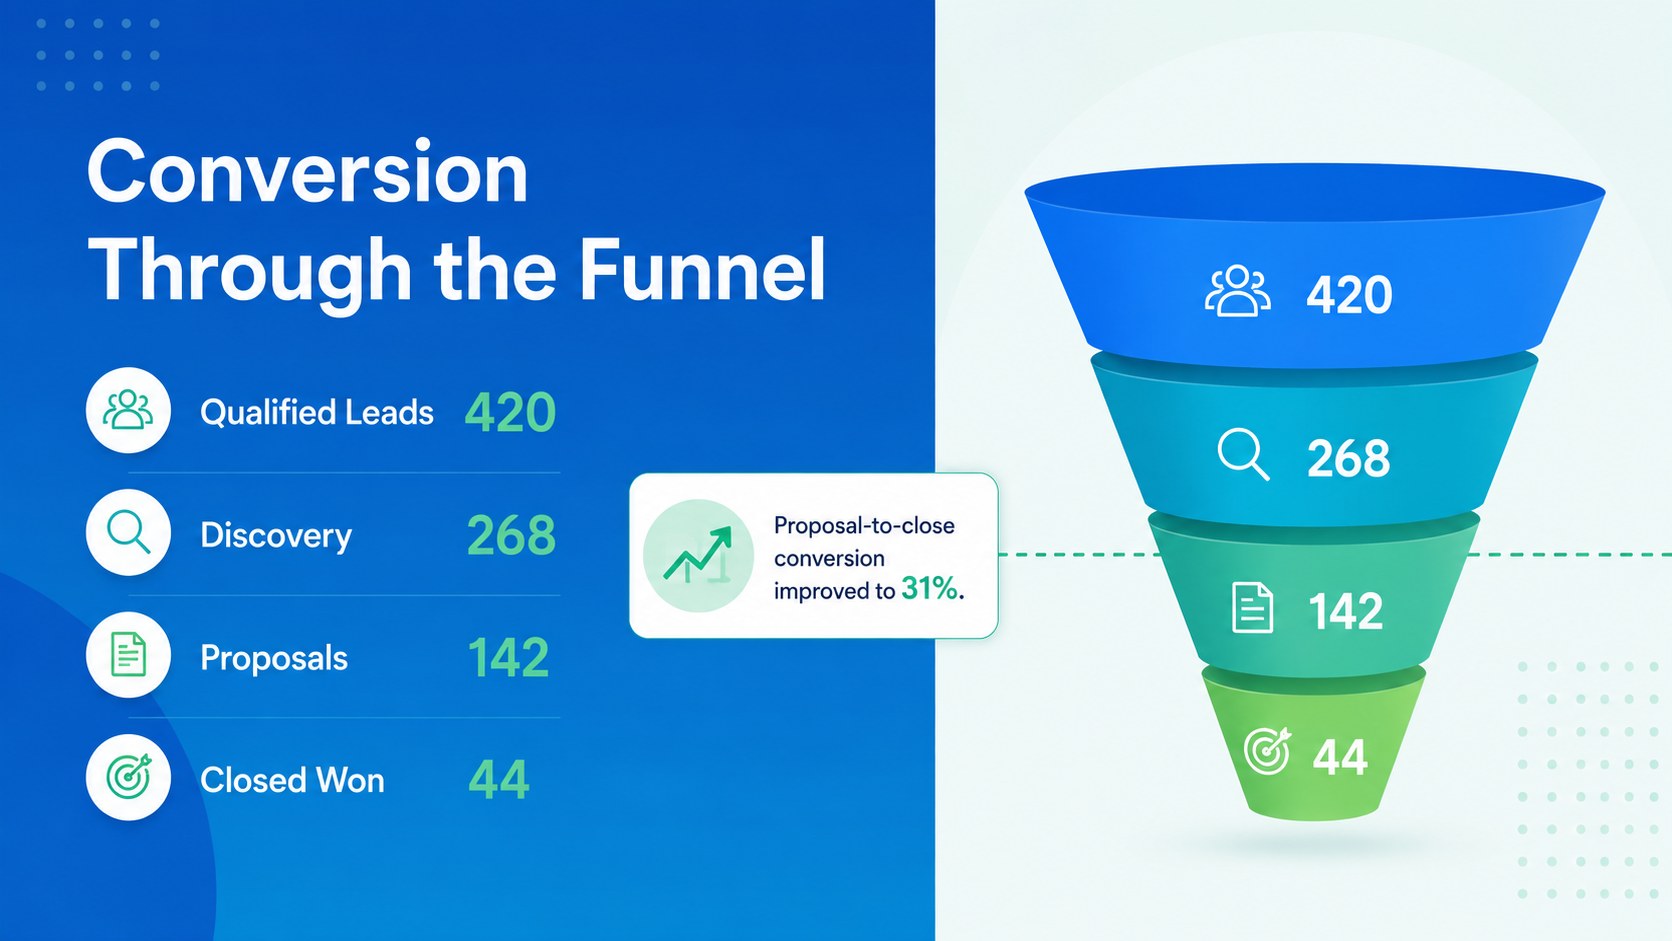
Inside, you will find adaptable layouts for an executive summary, revenue trends, KPI scorecards, regional comparisons, product mix, pipeline health, conversion rates, customer segments, team performance, forecasts, and recommended actions. Use the sales KPI dashboard slides to highlight essential metrics, or build a regional revenue analysis template that makes market differences easy to compare. A dedicated forecast section also supports forward-looking planning and resource decisions.
This executive sales update template is suited to sales directors, revenue operations teams, account leaders, business owners, and analysts preparing monthly or quarterly meetings. Every 16:9 slide can be edited in PowerPoint or Google Slides, including text, colors, charts, tables, and visual hierarchy. Replace the sample figures with current data, adjust the layouts to fit your reporting process, and reuse selected pages for leadership briefings, board updates, or team planning sessions.
Perfect for: quarterly revenue review; executive sales briefing; regional performance comparison; pipeline health meeting; sales forecast planning; team KPI assessment.
Frequently asked questions
Can I edit the charts and performance figures? Yes. Replace the sample values with your own sales data and customize chart labels, colors, tables, and KPI summaries. The layouts are structured to accommodate both quarterly totals and period-over-period comparisons.
Practical details
Yes. Replace the sample values with your own sales data and customize chart labels, colors, tables, and KPI summaries. The layouts are structured to accommodate both quarterly totals and period-over-period comparisons.
The template is designed for Microsoft PowerPoint and Google Slides. Formatting may vary slightly between platforms, so review chart alignment and font availability before presenting.
Yes. Change the reporting period in the headings and reuse the KPI, pipeline, regional, and forecast layouts for monthly reviews. Slides can also be removed or reordered to match a shorter reporting cycle.
Update the theme colors, typography, icons, and chart series while preserving the existing information hierarchy. The blue, green, and white palette can be adjusted to align with your organization’s internal presentation standards.
Keep exploring
15Build an engaging World UFO Day session with this flying saucer history lesson deck, featuring retro green-and-brown slides for PowerPoint and Google Slides.
 15
Plan a lively animal-learning journey with this jungle zoo adventure lesson deck, ready to customize in PowerPoint and Google Slides for young learners.
 16
Turn environmental research into a clear story with a Watercolor Ecology Presentation Theme for PowerPoint and Google Slides in calming green and blue.
 16
Build focused fashion, literature, and humanities presentations with the Red Triangle Editorial Theme, editable in PowerPoint and Google Slides.
 15
Turn streaming stats, favorite tracks, and concert highlights into a bold annual listening recap slide deck for PowerPoint and Google Slides.
 15
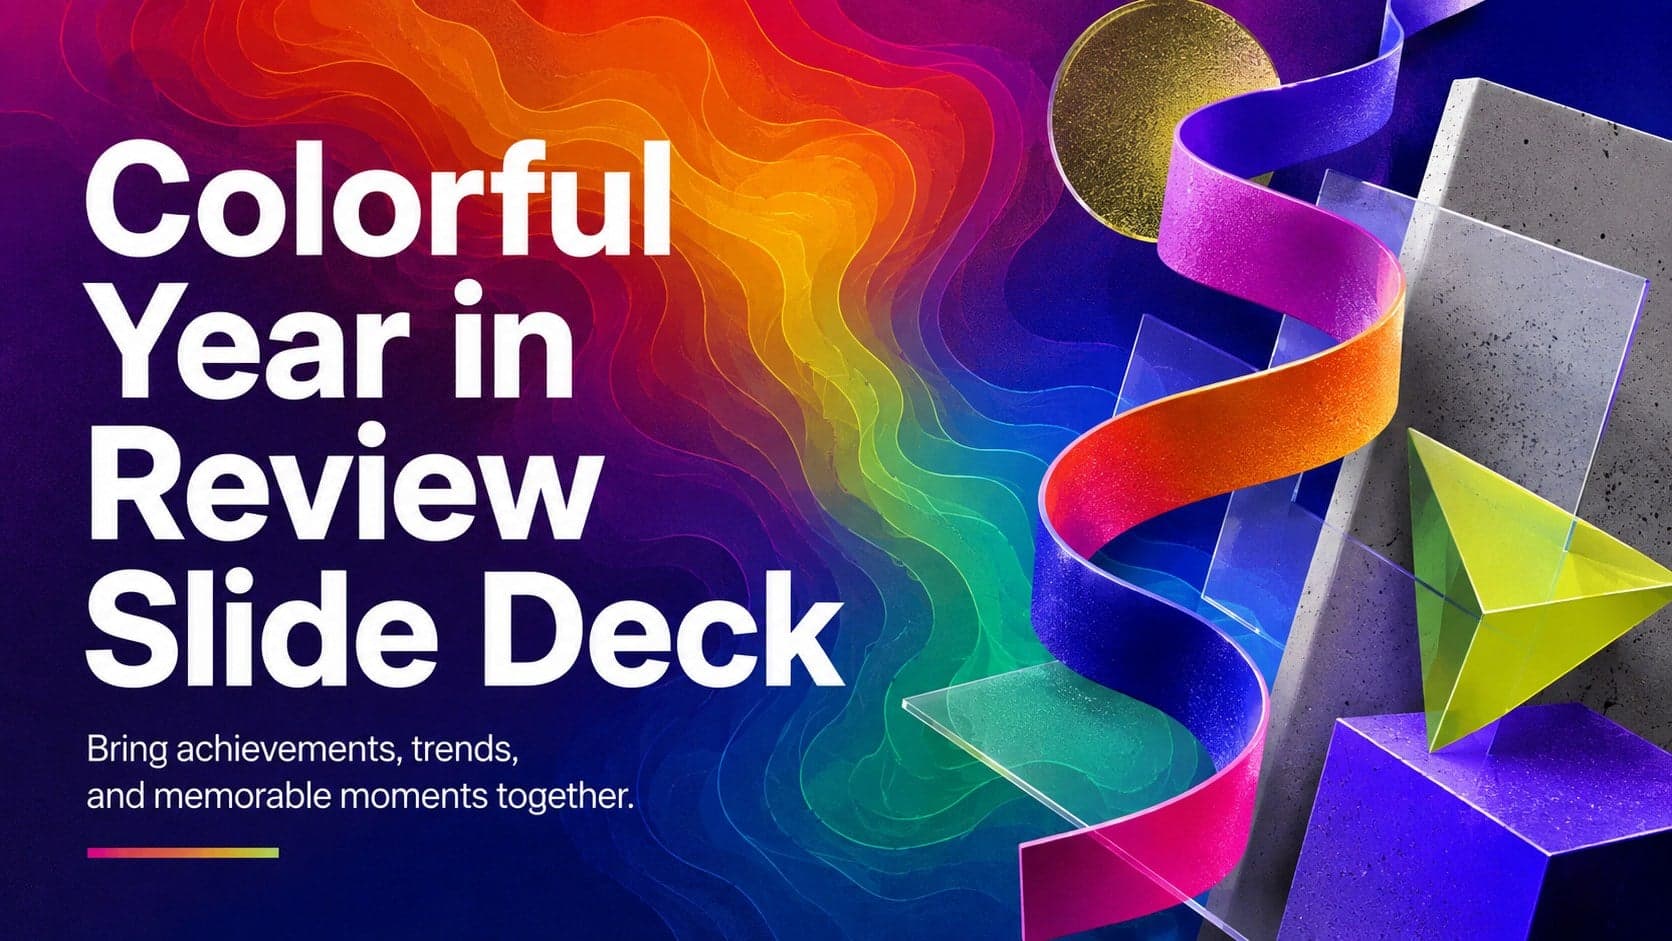
Turn highlights, milestones, and favorite moments into a colorful year in review slide deck with bold 3D graphics for PowerPoint and Google Slides.
 3
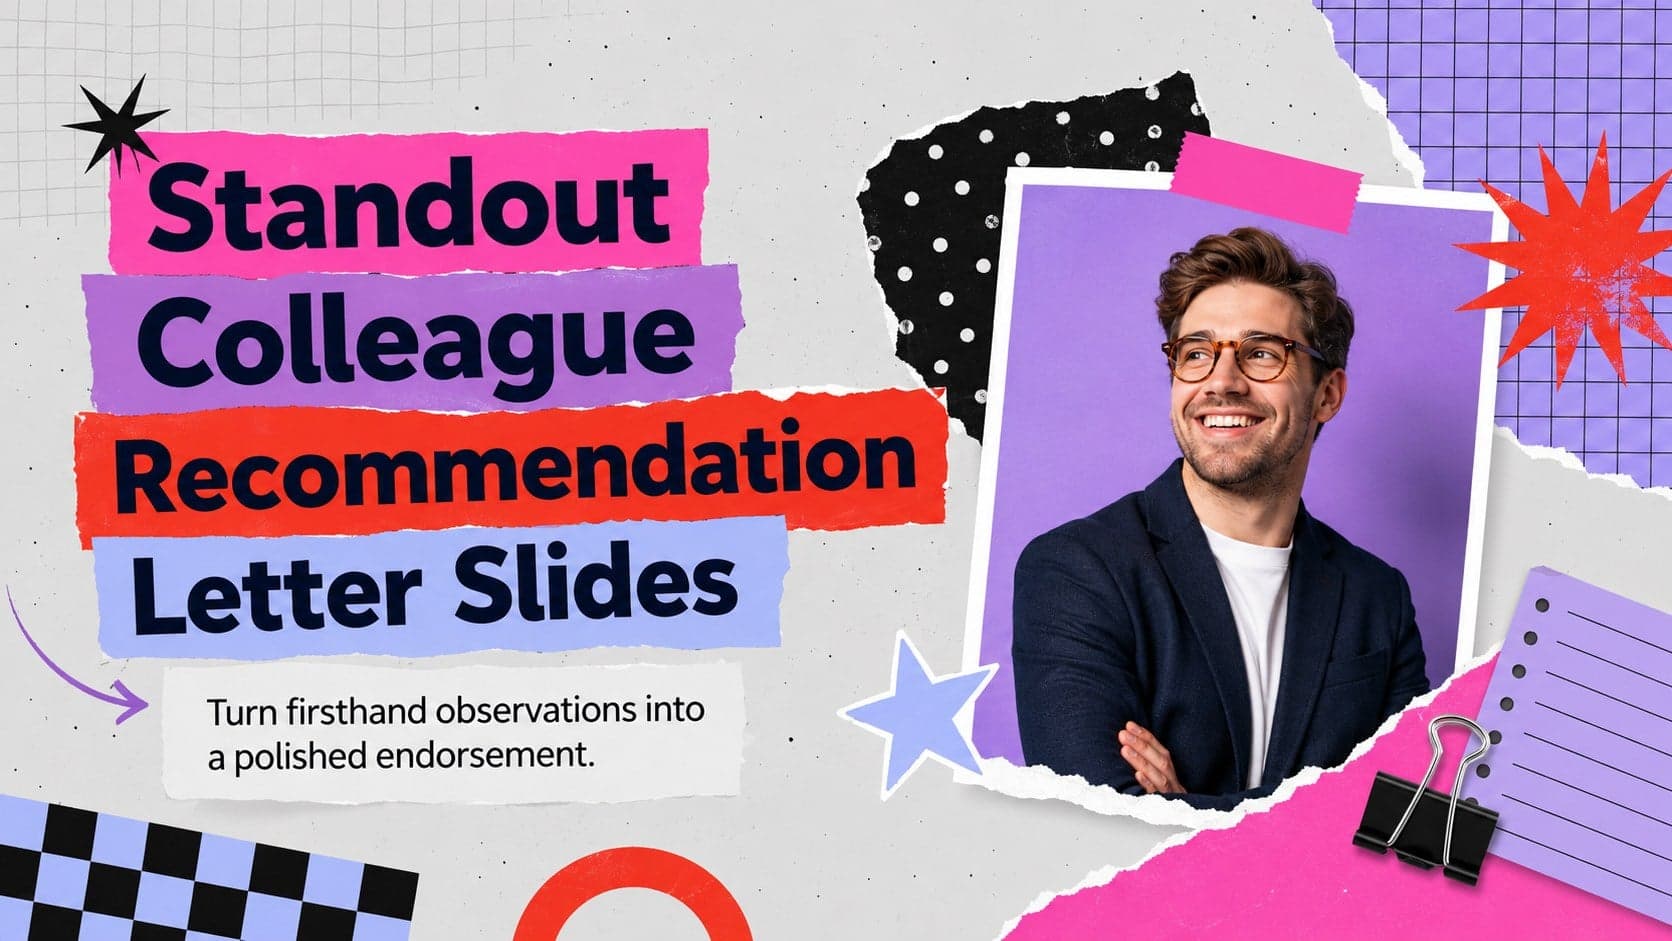
Build a credible endorsement with Standout Colleague Recommendation Letter Slides, featuring colorful prompts for skills, achievements, and team impact.
 4
Build clear beginner sessions with an ice hockey fundamentals training deck for coaches, PE teachers, and clubs, ready for PowerPoint and Google Slides.