
 15
presentation
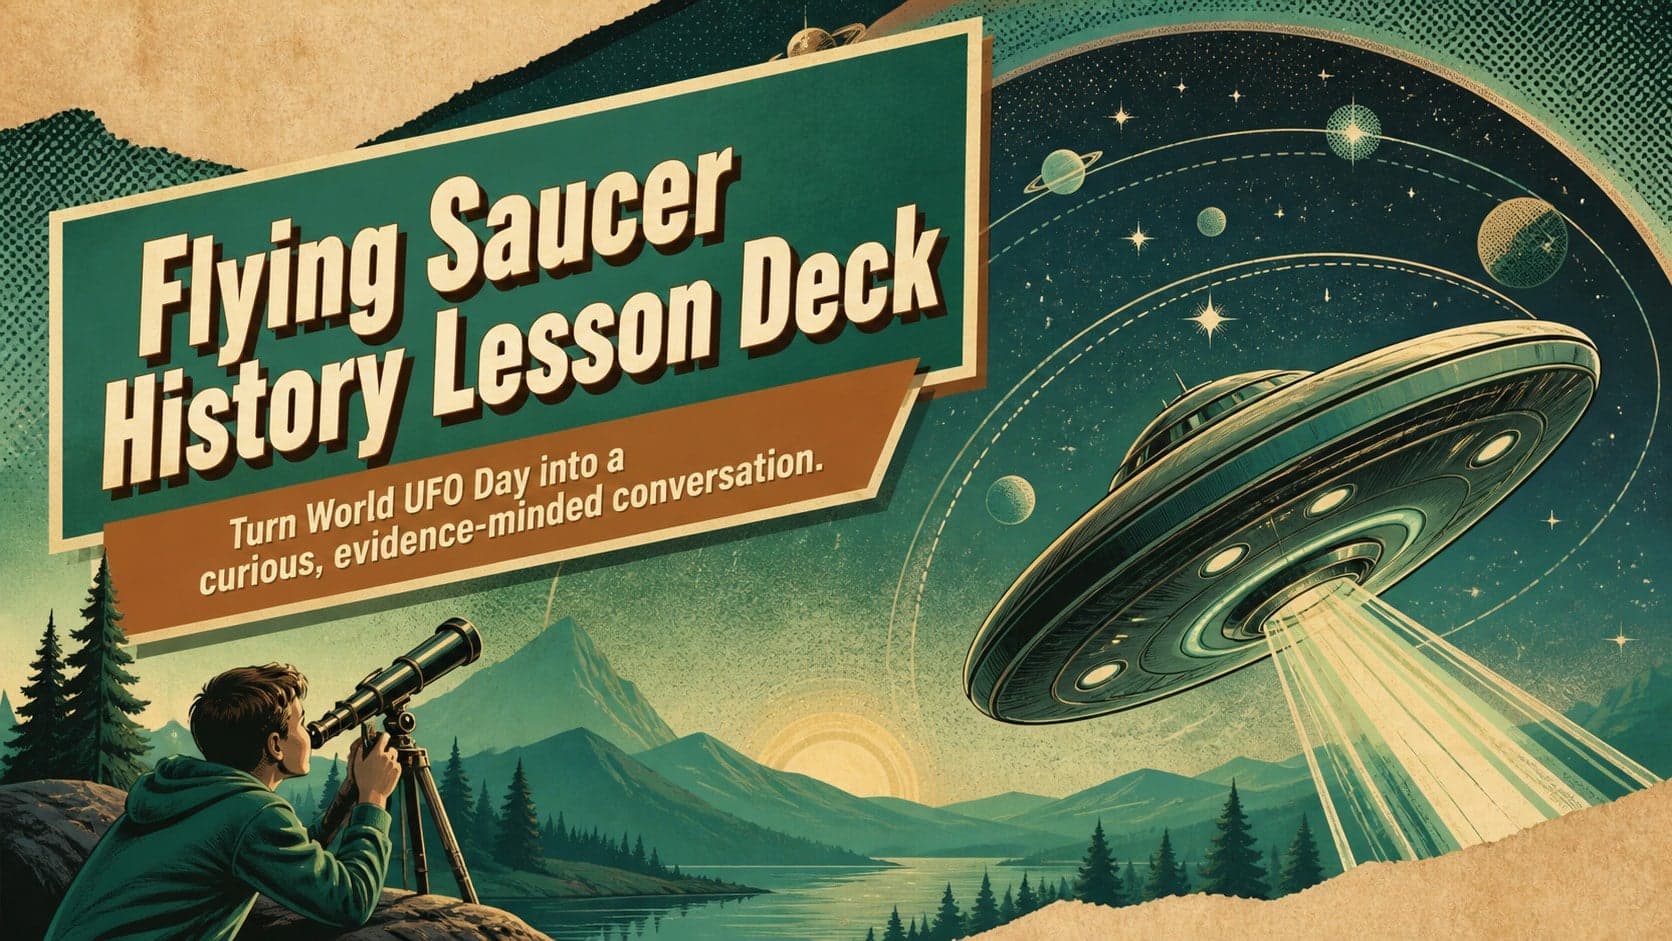
Flying Saucer History Lesson Deck
Build an engaging World UFO Day session with this flying saucer history lesson deck, featuring retro green-and-brown slides for PowerPoint and Google Slides.
Google SlidesPowerPoint
presentation · English
Make ratios easier to visualize with proportional reasoning math slides featuring editable examples, colorful graphs, and guided classroom practice.
Design notes
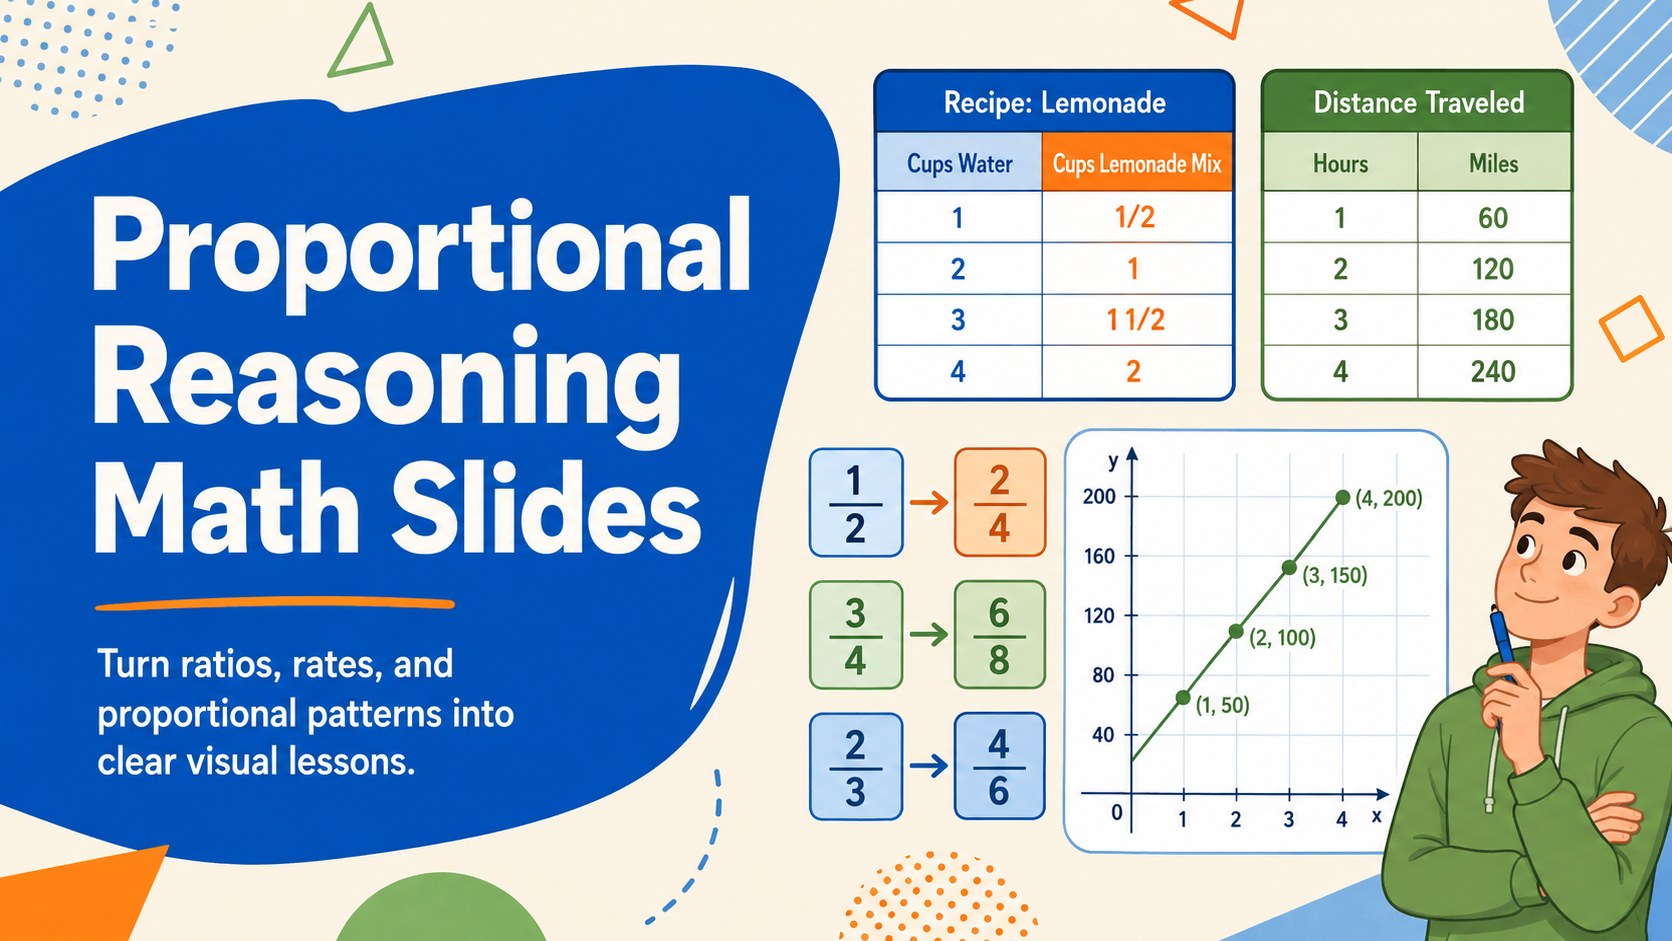
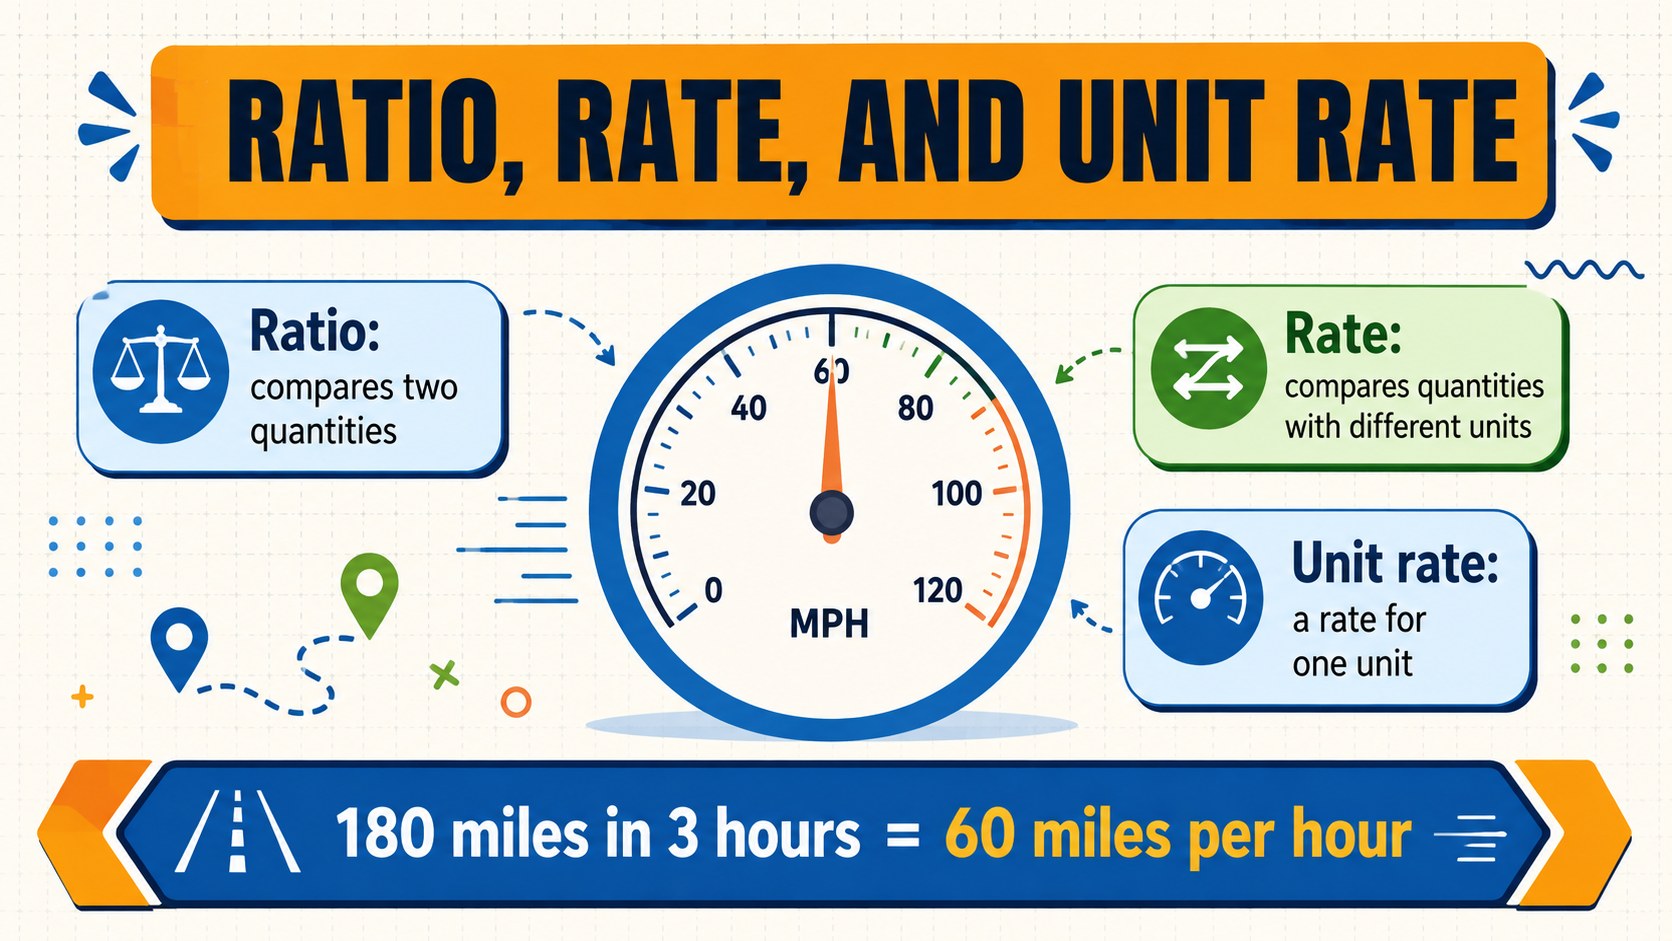
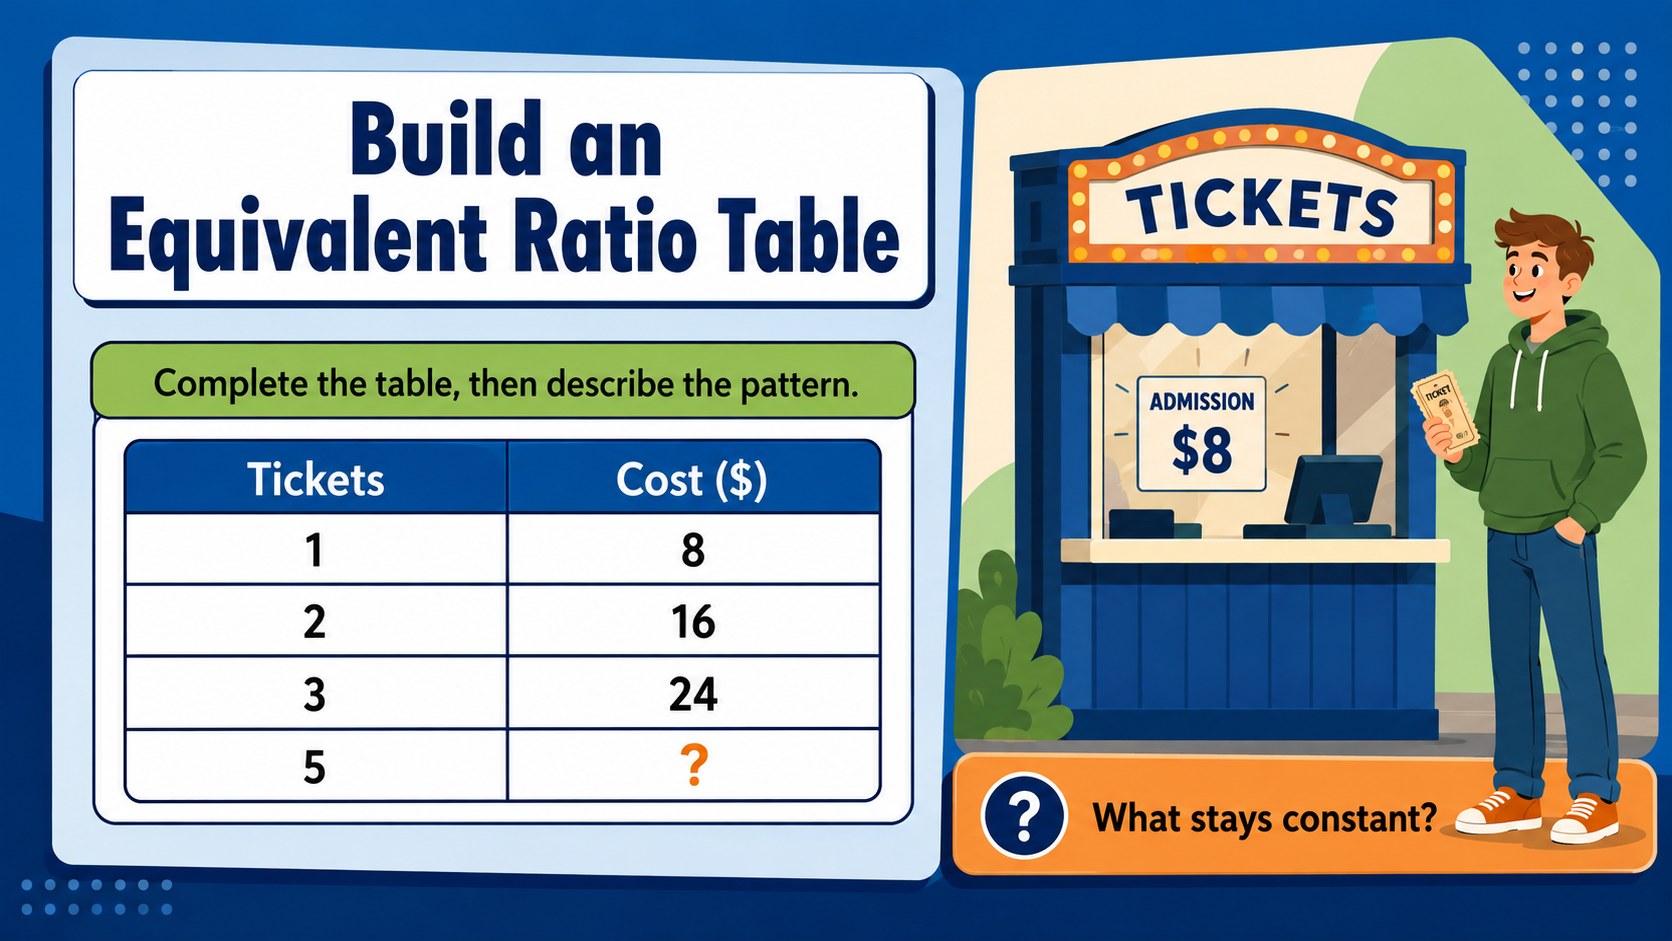
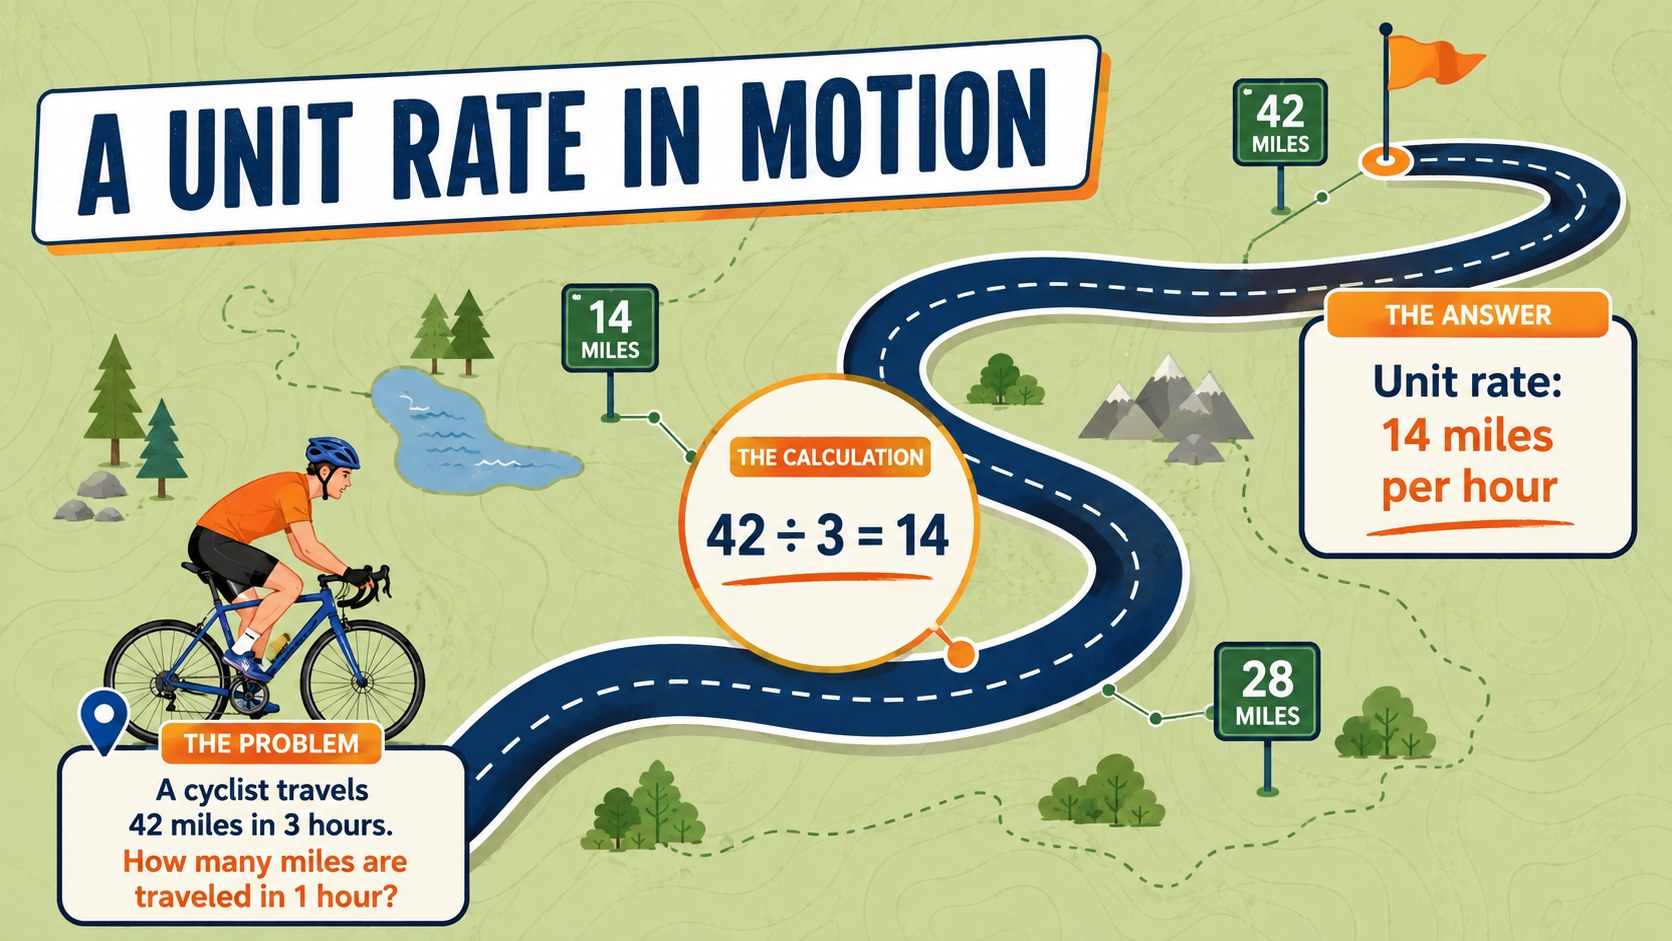
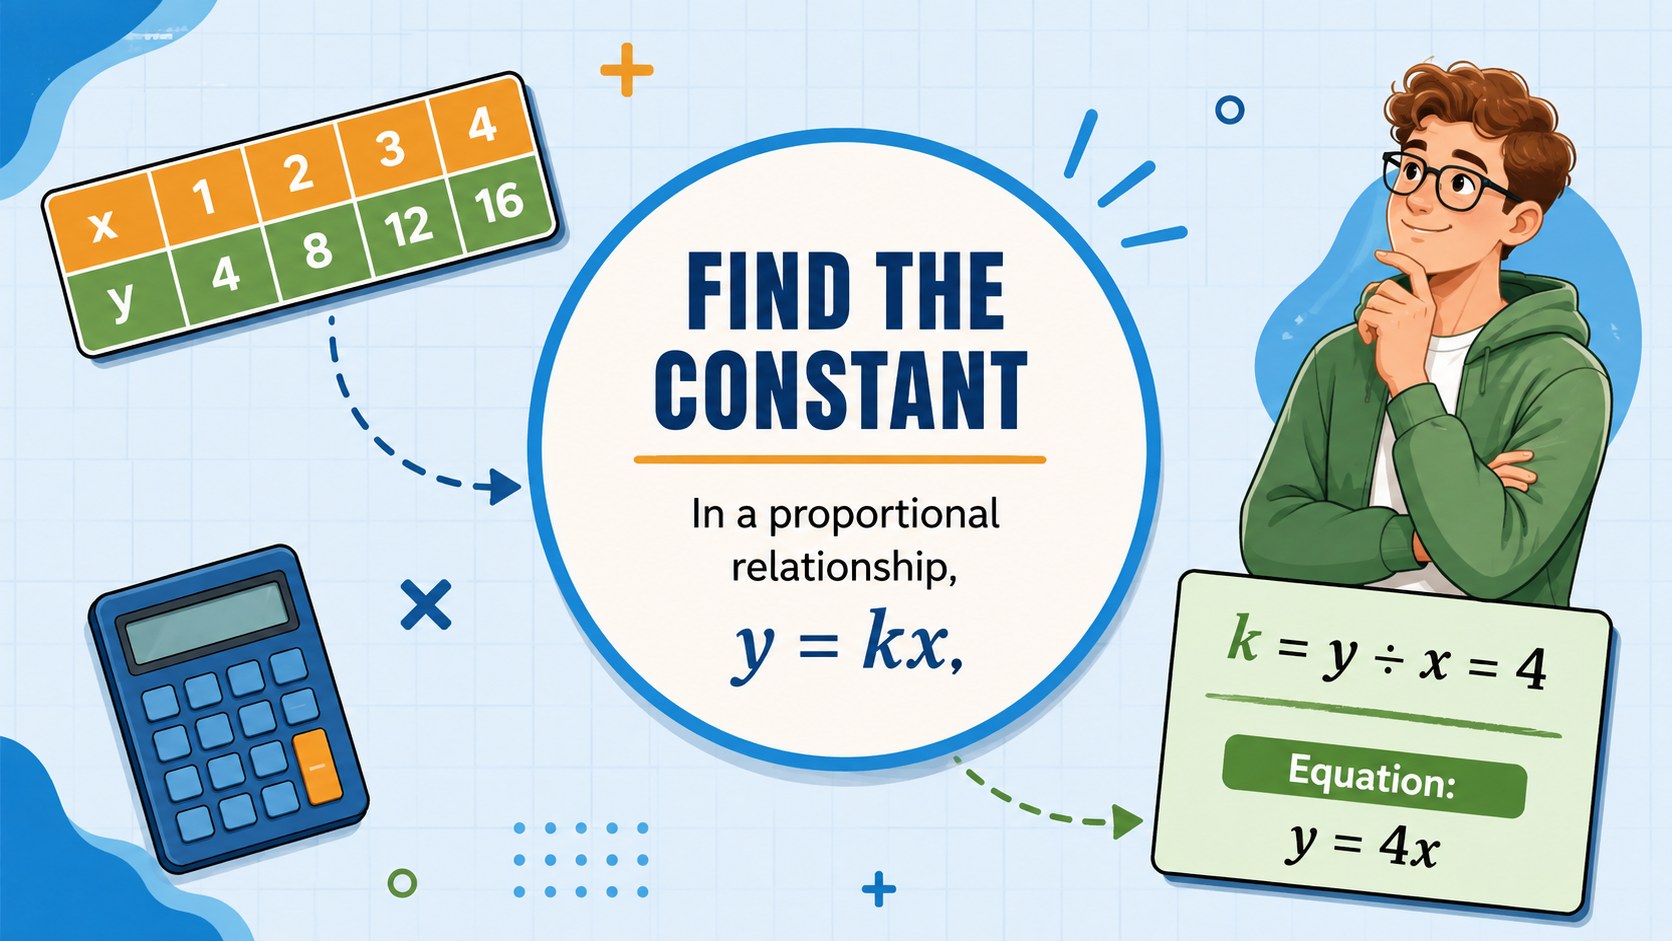
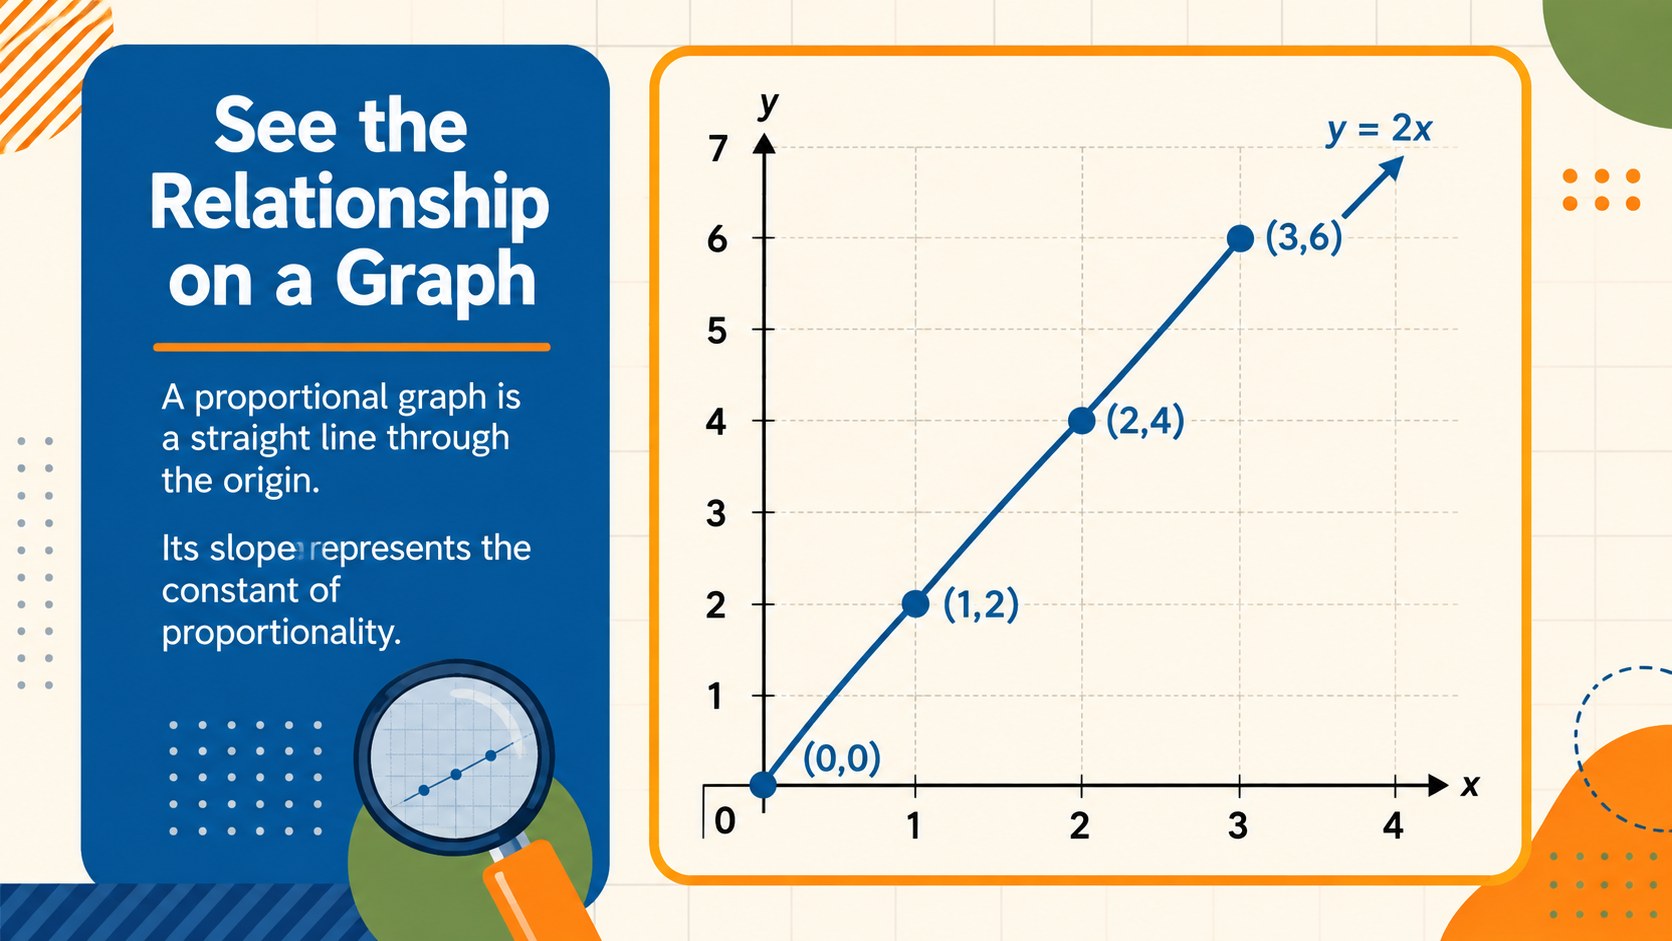
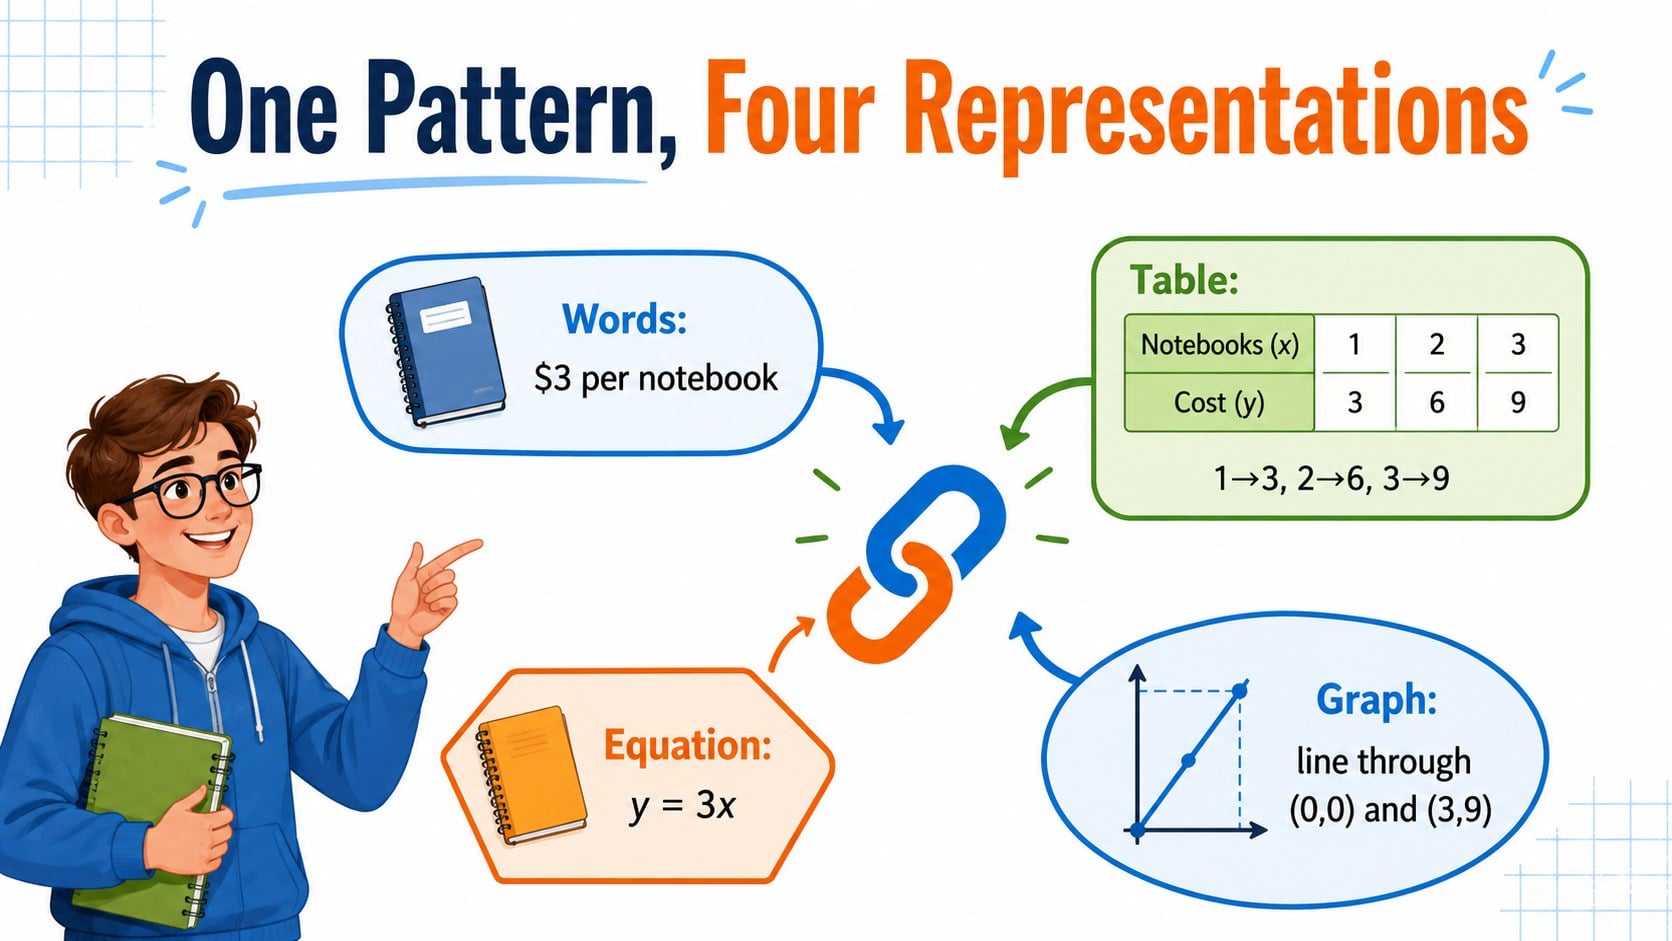
Help students connect ratios, rates, tables, equations, and graphs with these proportional reasoning math slides. Designed for secondary math instruction, the deck uses a lively blue, orange, and green palette, bold typography, playful grid details, and original classroom illustrations to make abstract relationships easier to see and discuss.
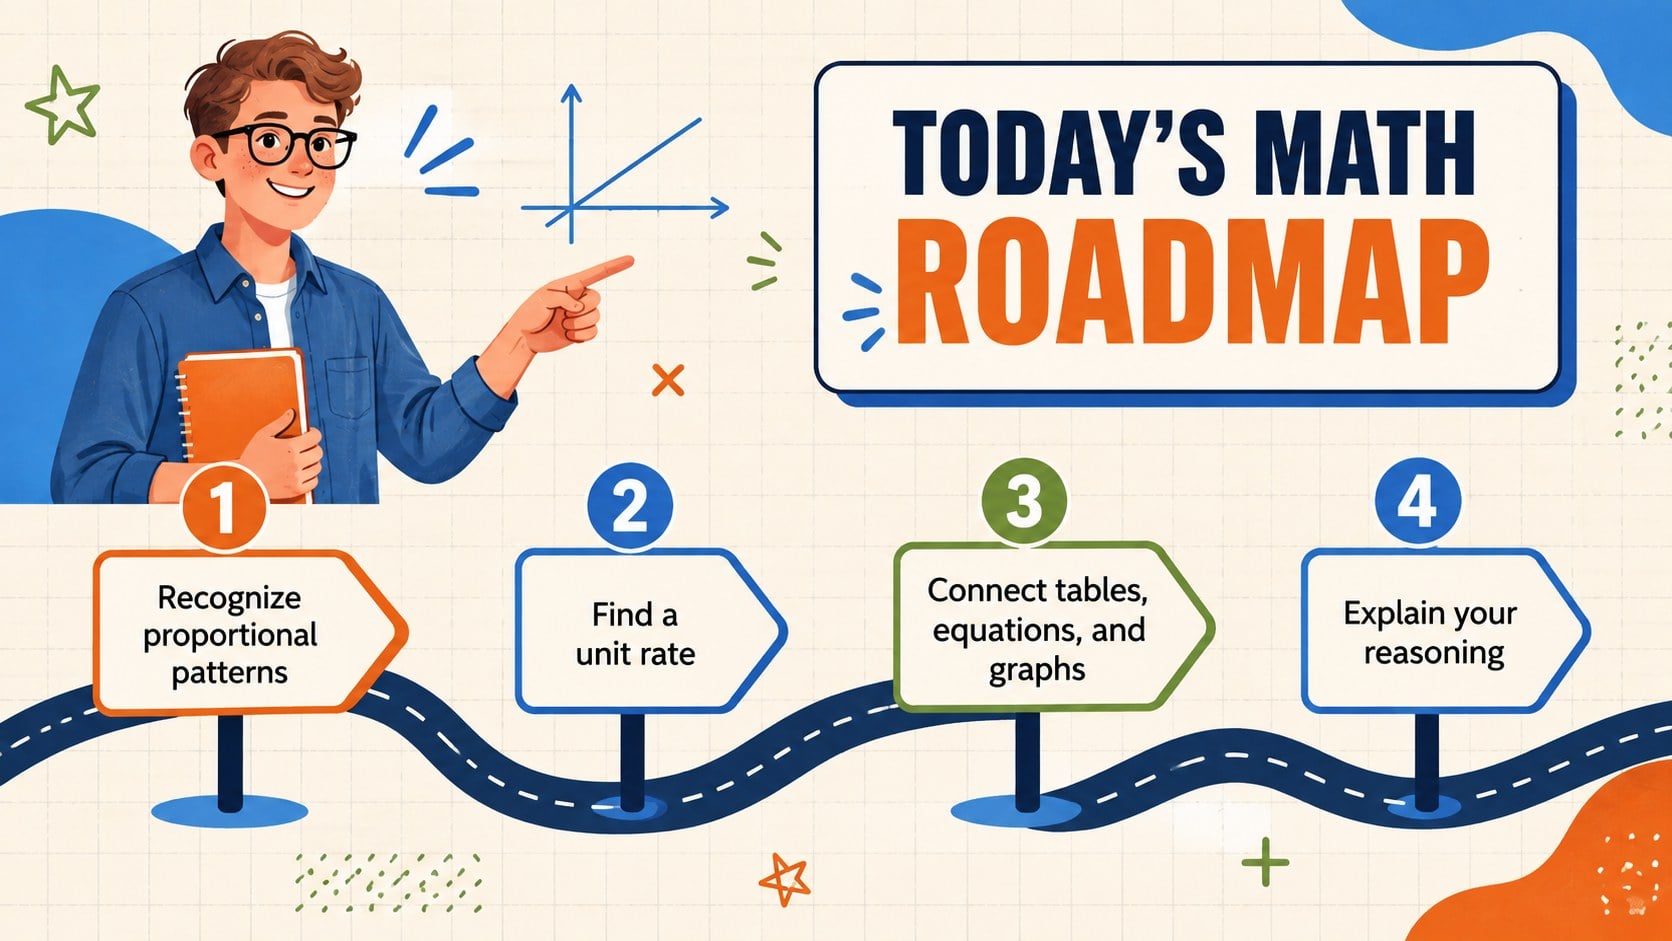
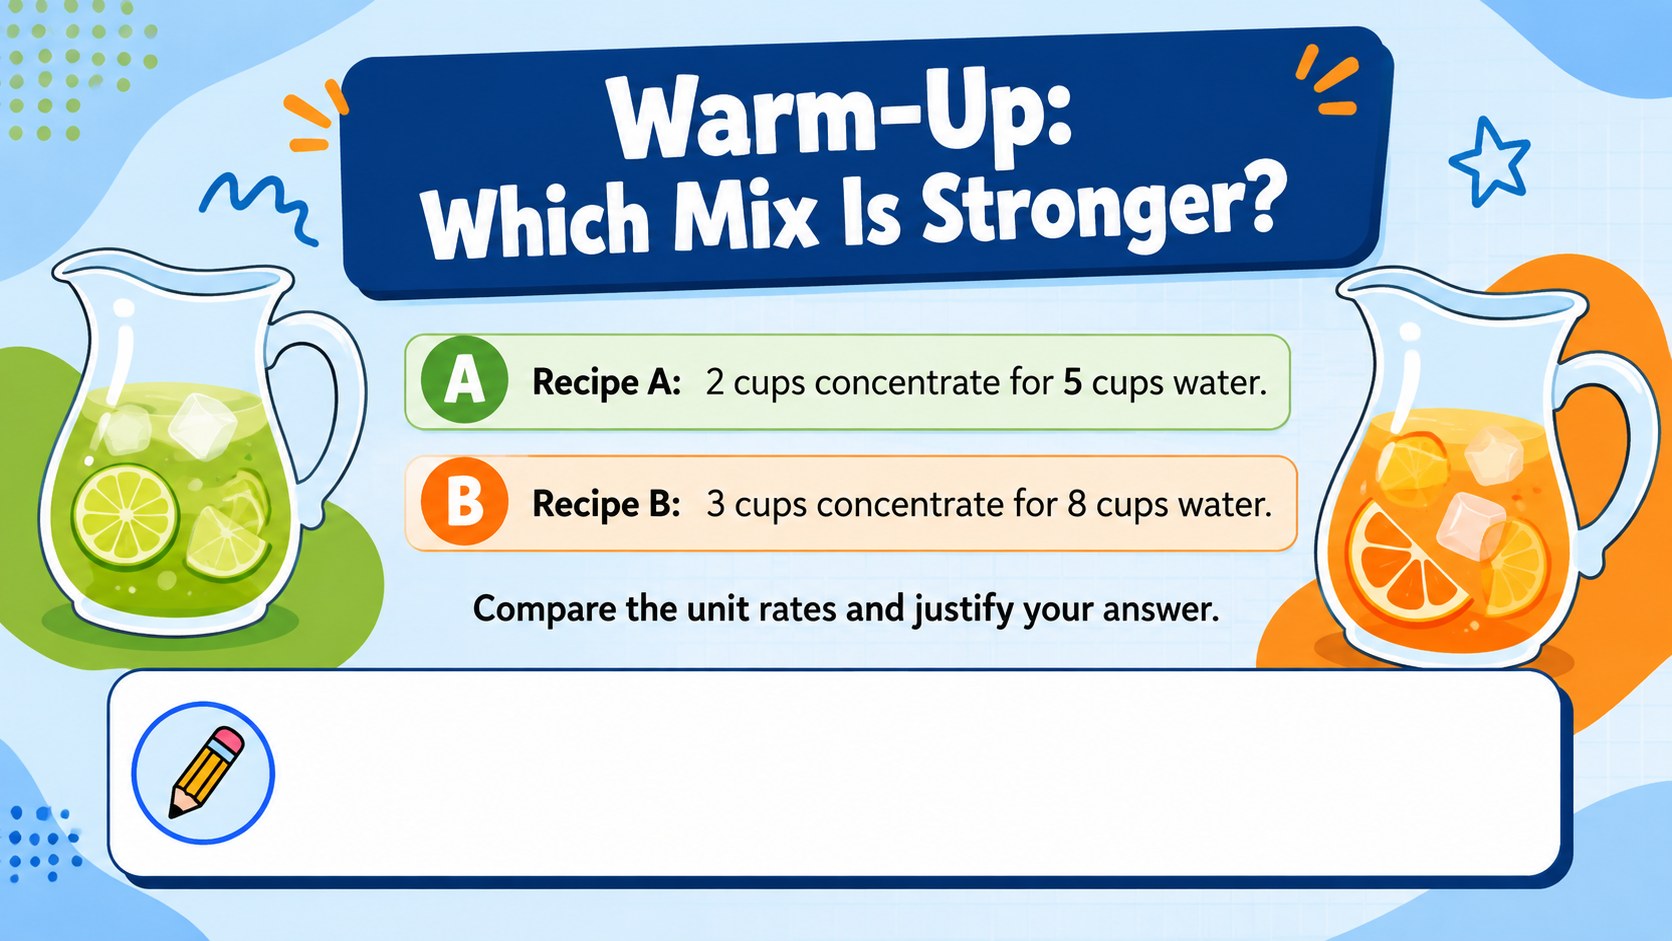
The 15-slide presentation includes a lesson opener, learning goals, prior-knowledge review, ratio tables, real-world unit rate examples, equivalent-ratio models, constant-of-proportionality explanations, coordinate graphs, worked examples, misconception checks, collaborative tasks, independent practice, an exit ticket, and a concise lesson recap. Teachers can replace the sample values, rewrite questions, adjust colors, and move visual elements without rebuilding the layouts. The varied formats work well for direct instruction, student discussion, and step-by-step problem solving.
Use this ratio tables lesson deck with high school learners, intervention groups, or advanced middle school classes preparing for algebra. It also supports a graphing proportional relationships lesson when students need to compare representations and explain how a constant rate appears in a table, equation, and graph. Every slide is editable in PowerPoint and Google Slides, making the template practical for classroom projection, digital assignments, review sessions, or printed reference pages.
Perfect for: secondary math direct instruction; ratio and rate review; algebra readiness lesson; small-group intervention; graphing practice session; classroom exit ticket.
Frequently asked questions
Can I edit the examples and practice questions? Yes. All headings, values, equations, tables, graphs, and instructions can be changed to match your curriculum and student level. You can also duplicate layouts to add more guided or independent practice.
Practical details
Yes. All headings, values, equations, tables, graphs, and instructions can be changed to match your curriculum and student level. You can also duplicate layouts to add more guided or independent practice.
The deck is designed for PowerPoint and Google Slides. Fonts or spacing may vary slightly between platforms, so review the presentation once after importing it.
Yes. The blue, orange, and green palette can be adjusted, and decorative illustrations can be moved, replaced, or removed. Keep strong contrast between text and backgrounds for classroom projection.
It is intended primarily for secondary learners studying ratios, unit rates, and proportional relationships. Teachers can simplify the numbers for middle school or extend the equation and graph tasks for high school algebra.
Keep exploring
15Build an engaging World UFO Day session with this flying saucer history lesson deck, featuring retro green-and-brown slides for PowerPoint and Google Slides.
 15
Plan a lively animal-learning journey with this jungle zoo adventure lesson deck, ready to customize in PowerPoint and Google Slides for young learners.
 16
Turn environmental research into a clear story with a Watercolor Ecology Presentation Theme for PowerPoint and Google Slides in calming green and blue.
 16
Build focused fashion, literature, and humanities presentations with the Red Triangle Editorial Theme, editable in PowerPoint and Google Slides.
 15
Turn streaming stats, favorite tracks, and concert highlights into a bold annual listening recap slide deck for PowerPoint and Google Slides.
 15
Turn highlights, milestones, and favorite moments into a colorful year in review slide deck with bold 3D graphics for PowerPoint and Google Slides.
 3
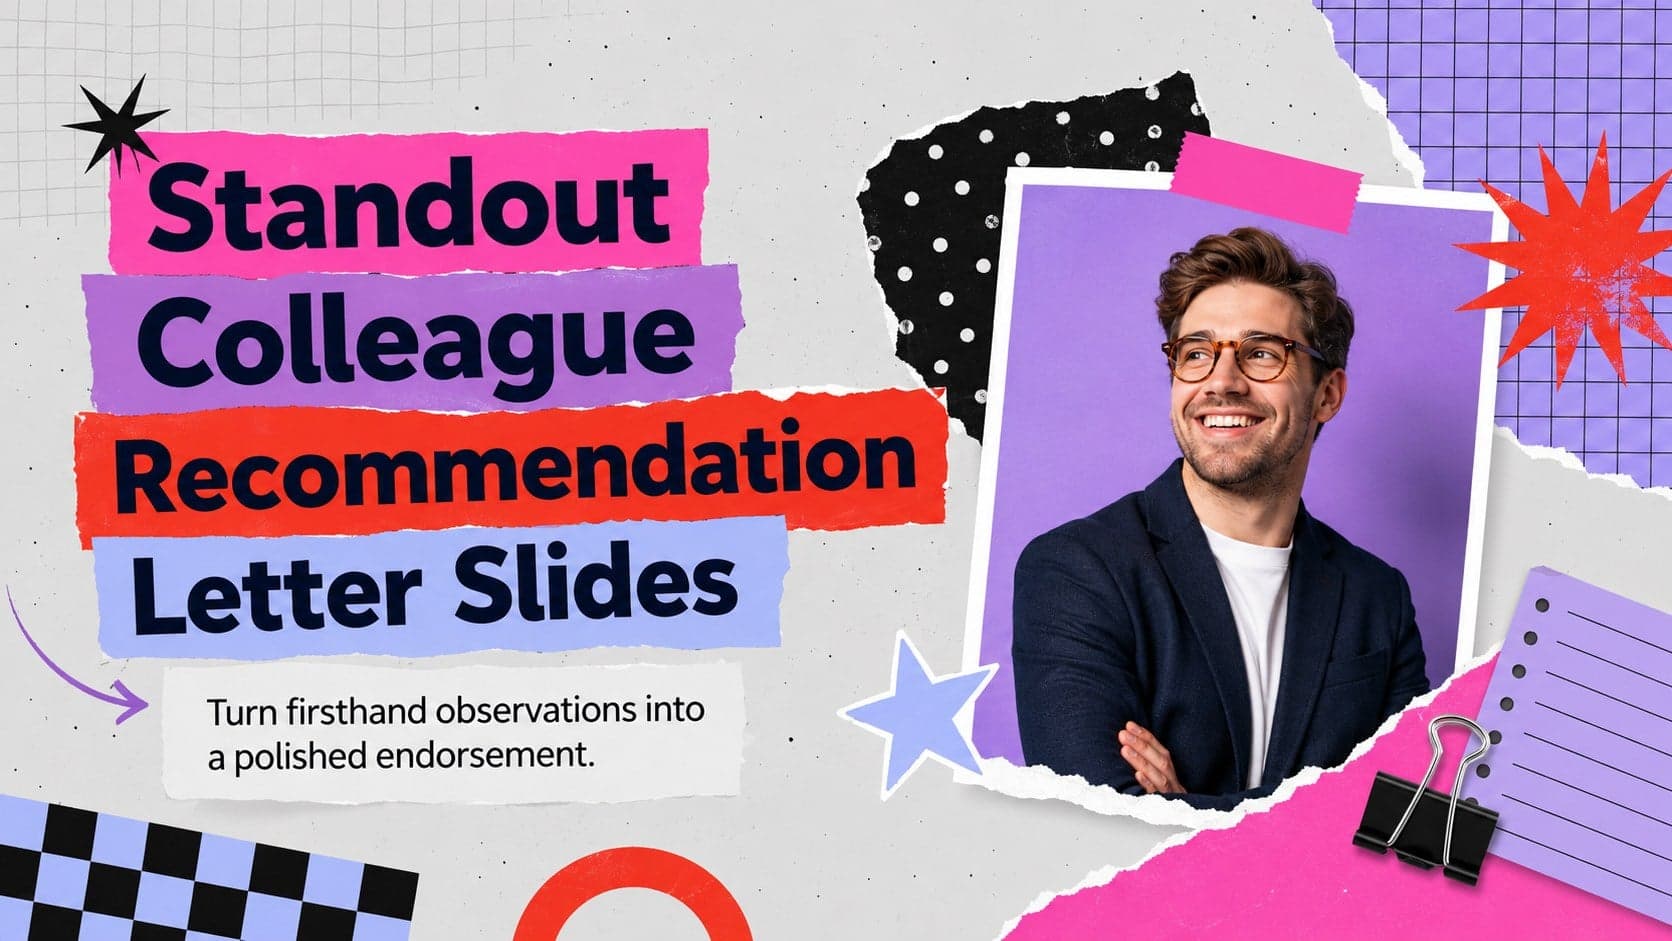
Build a credible endorsement with Standout Colleague Recommendation Letter Slides, featuring colorful prompts for skills, achievements, and team impact.
 4
Build clear beginner sessions with an ice hockey fundamentals training deck for coaches, PE teachers, and clubs, ready for PowerPoint and Google Slides.