
 15
presentation
Flying Saucer History Lesson Deck
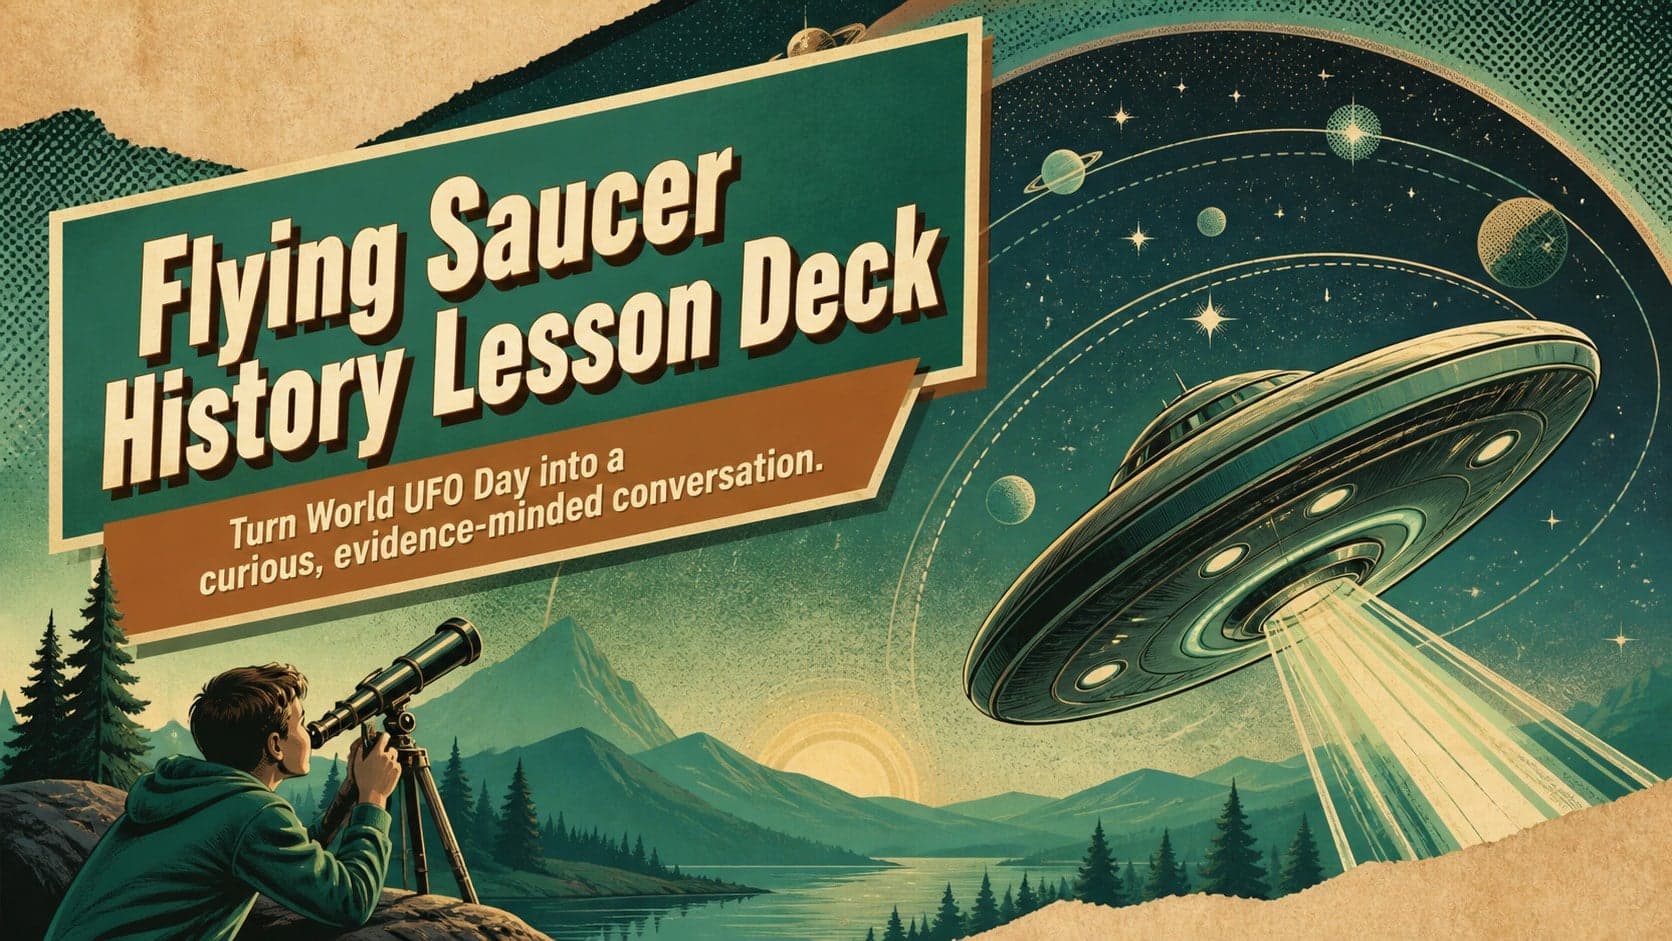
Build an engaging World UFO Day session with this flying saucer history lesson deck, featuring retro green-and-brown slides for PowerPoint and Google Slides.
Google SlidesPowerPoint
presentation · English
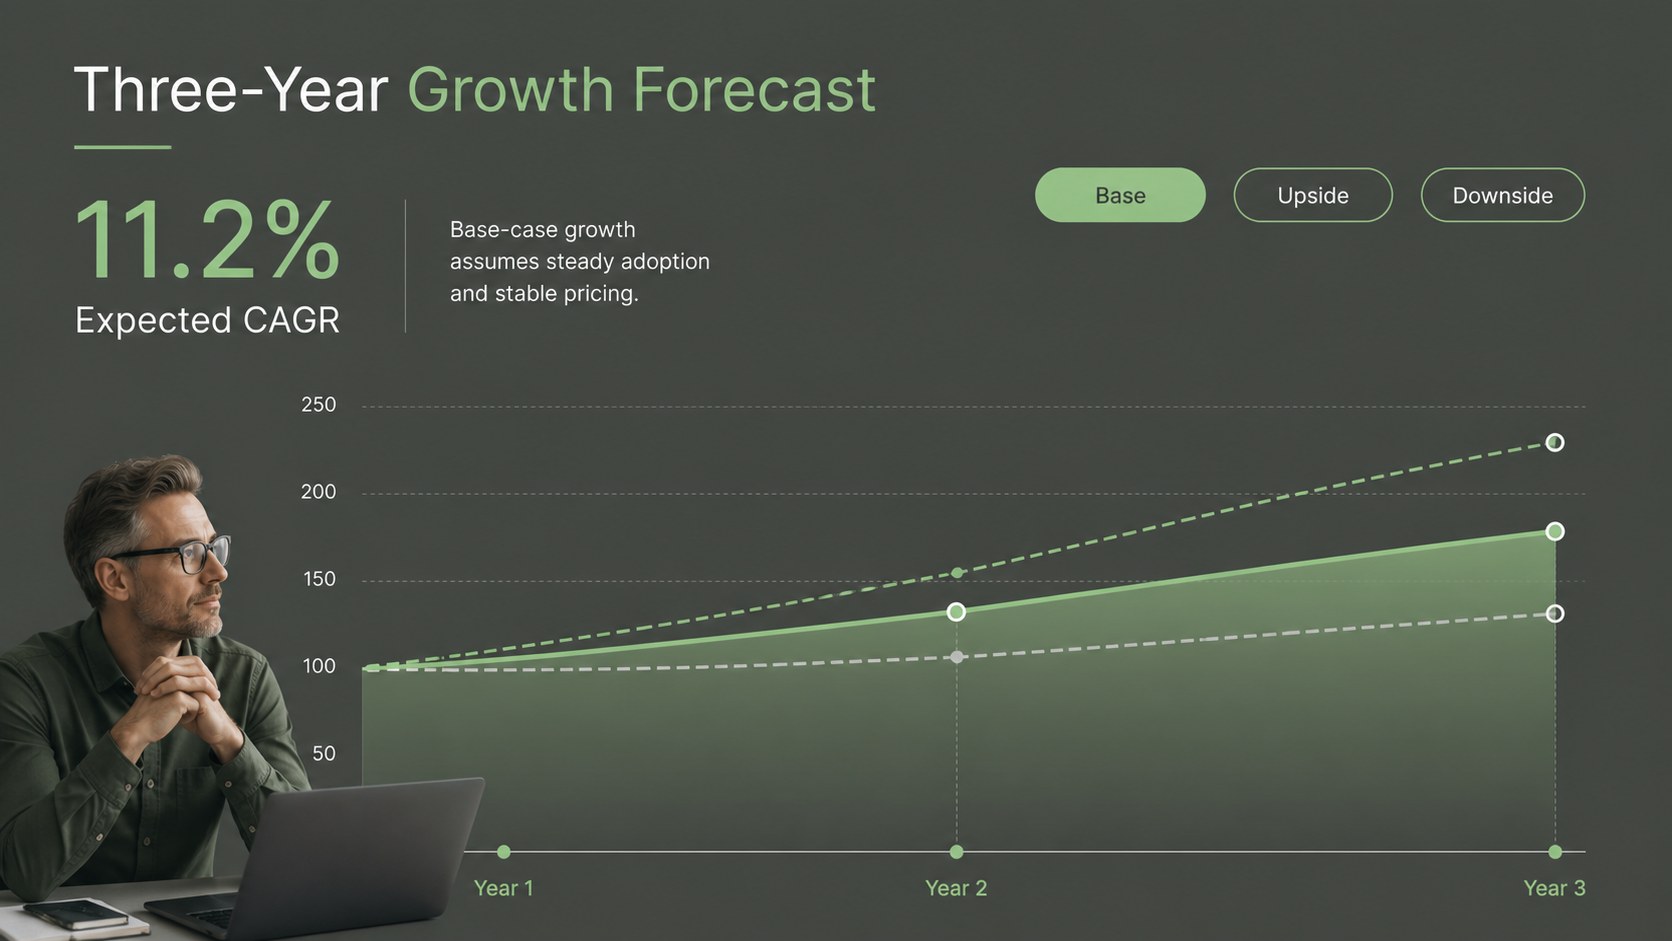
Turn complex data into a clear business story with this Market Signals Strategy Deck for polished PowerPoint and Google Slides presentations.

Design notes
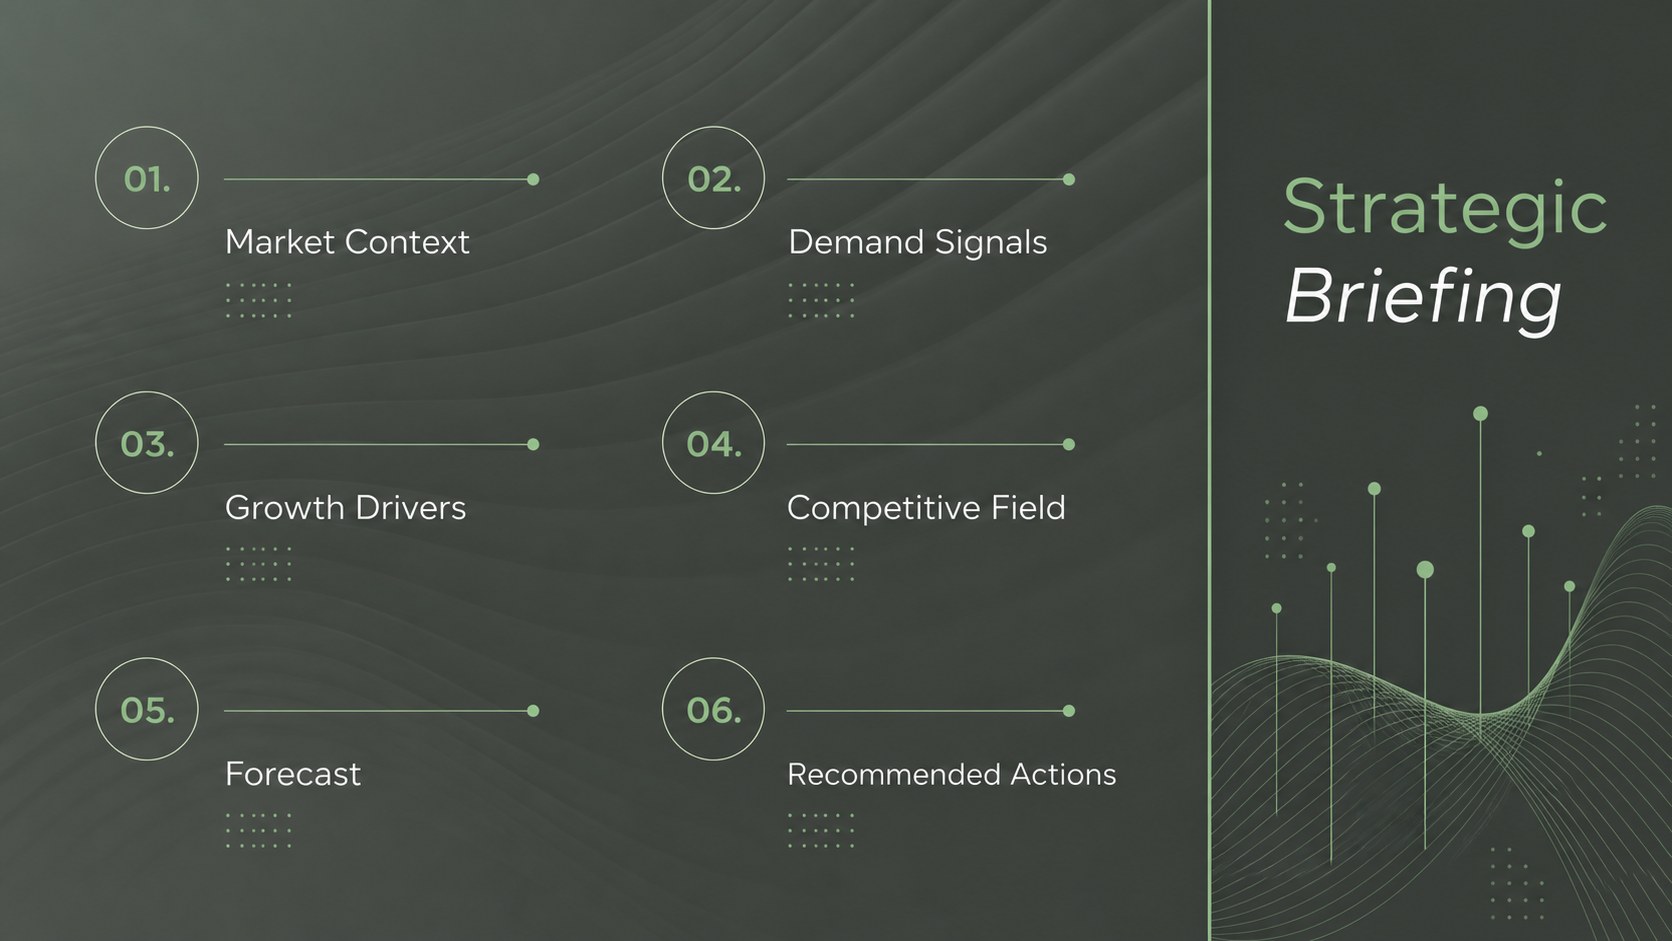
Turn scattered research into a focused business narrative with the Market Signals Strategy Deck. Designed in a sleek corporate green palette with clean typography and restrained visual details, this presentation gives startups, analysts, and strategy teams a professional framework for explaining what is changing in their industry and why it matters.
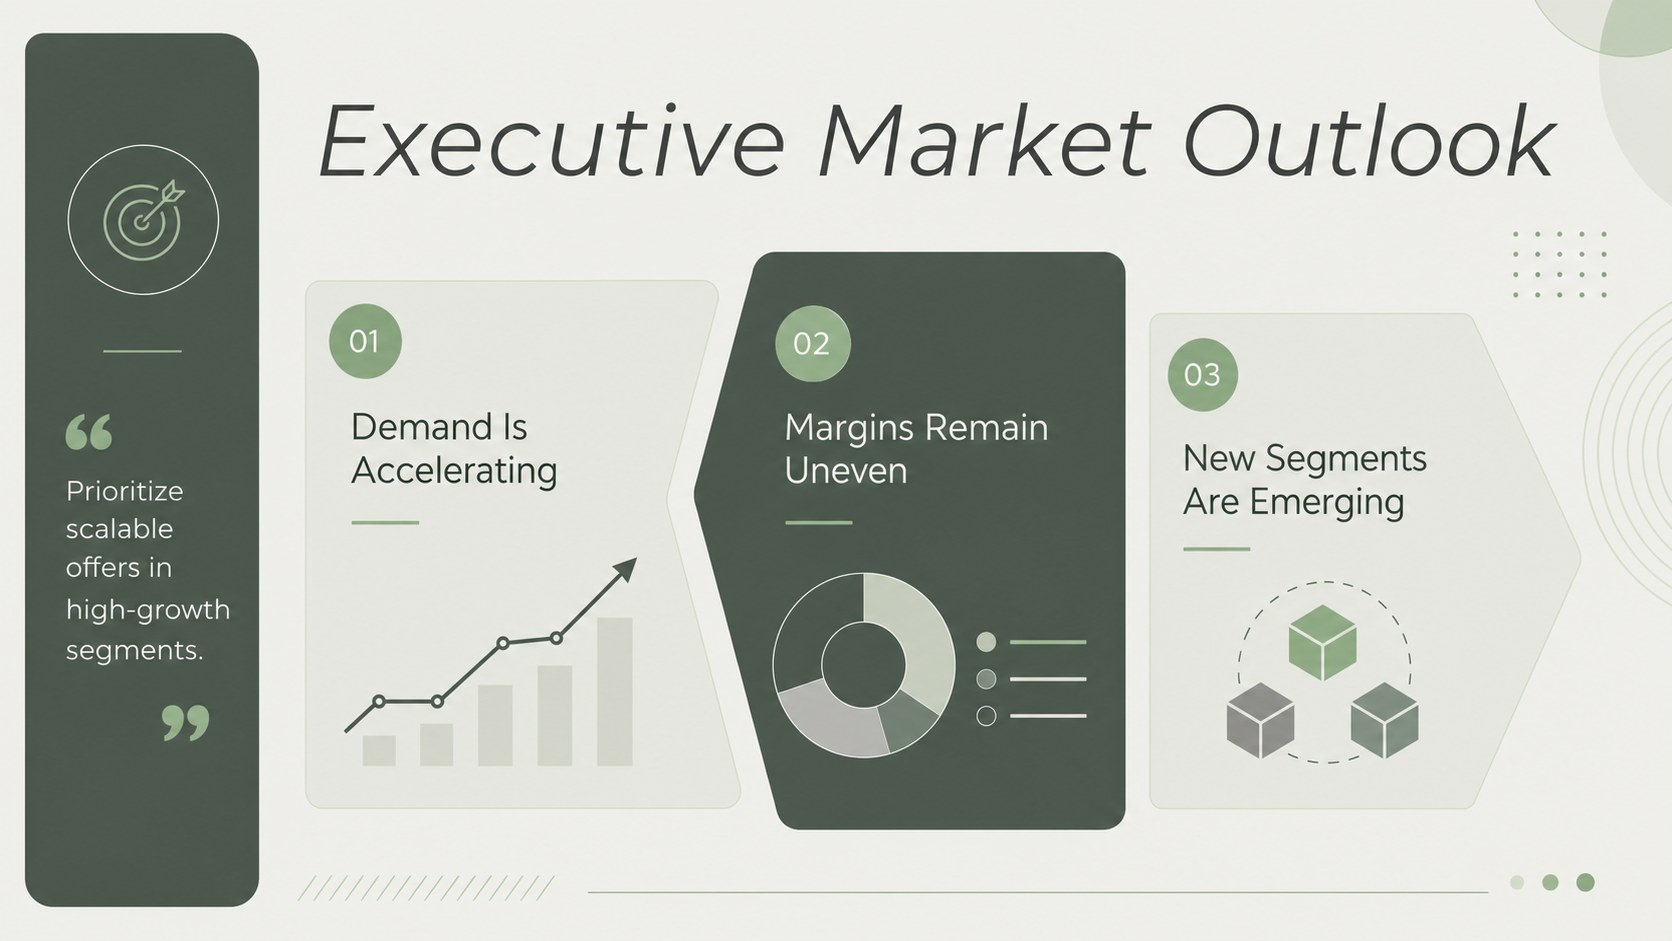
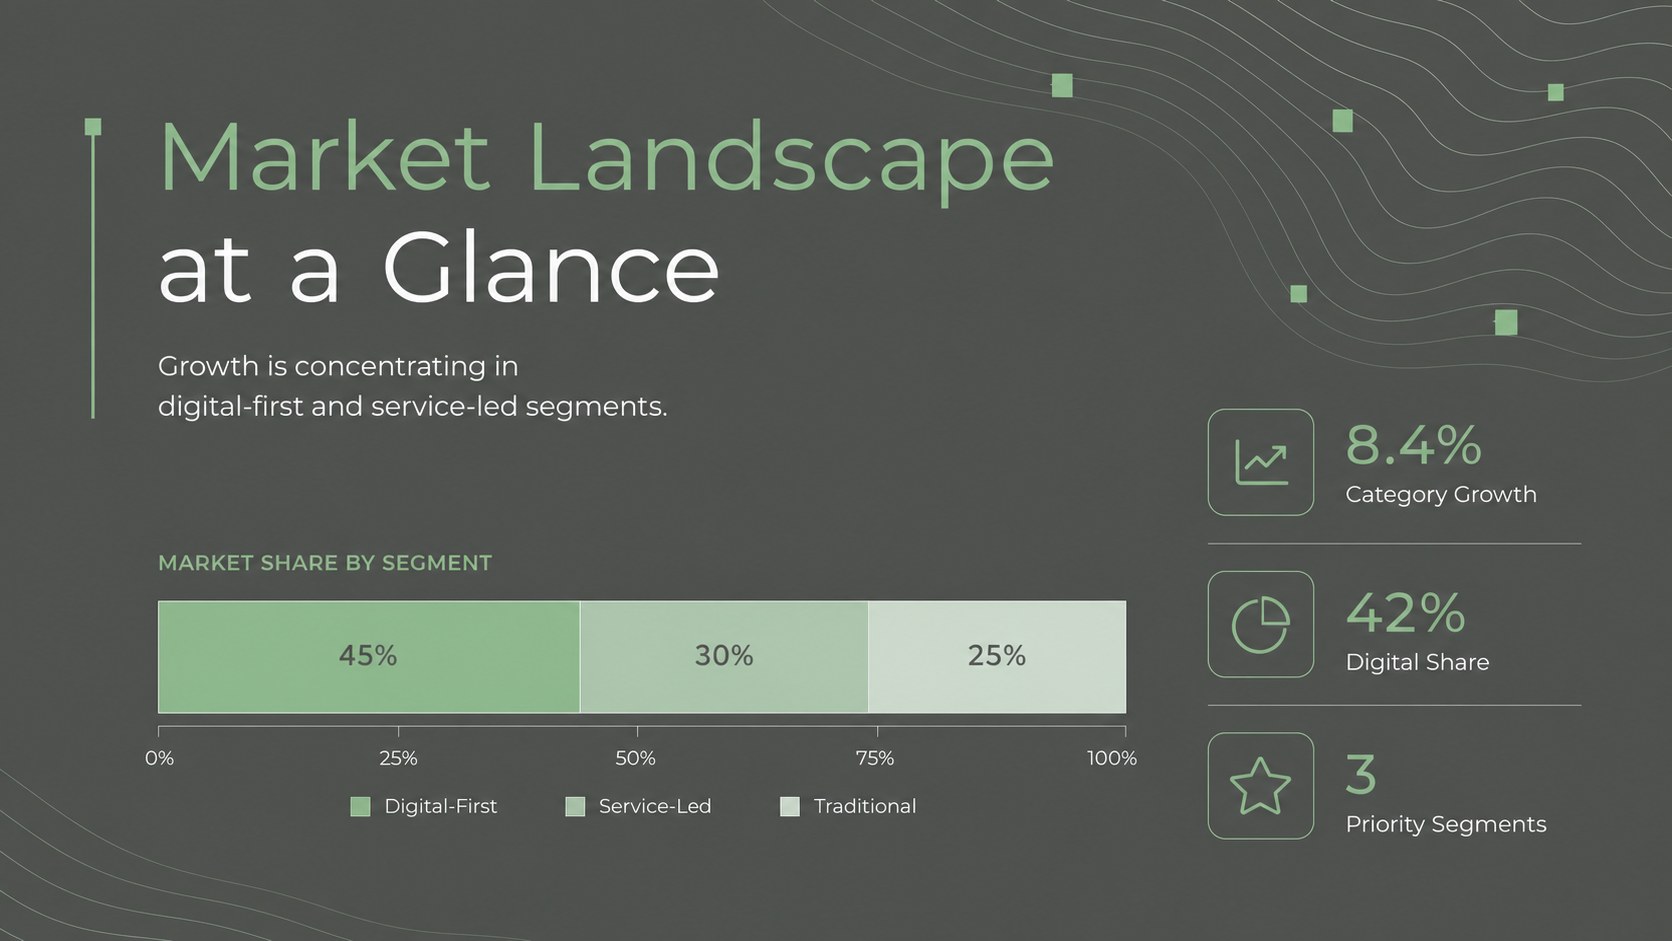
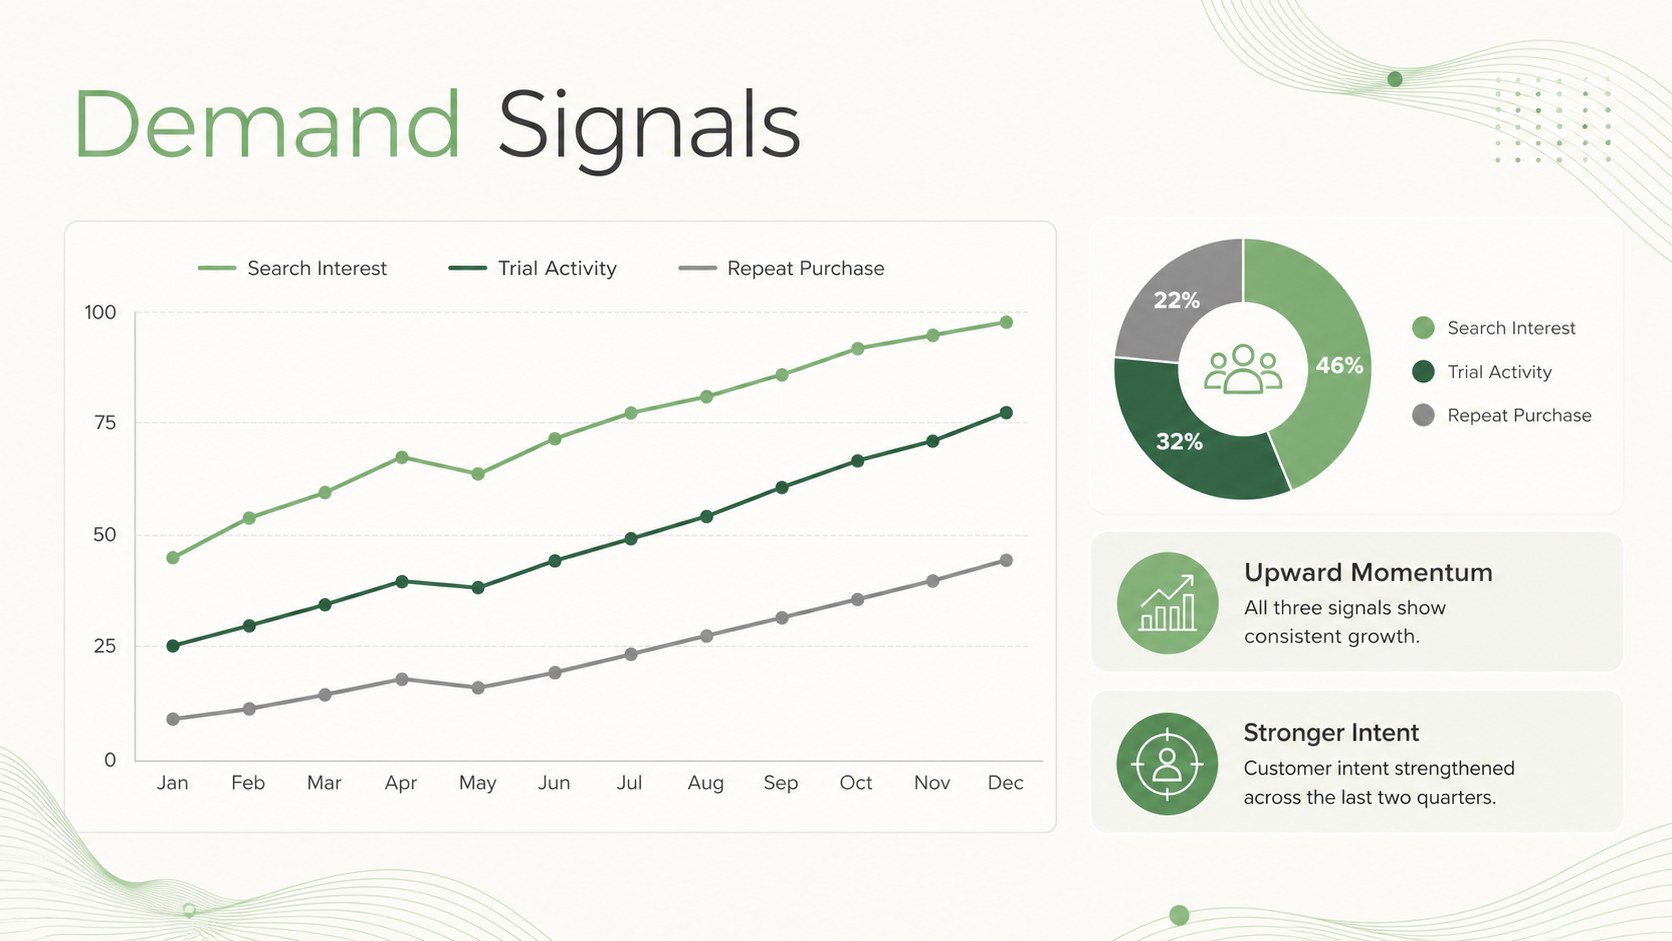
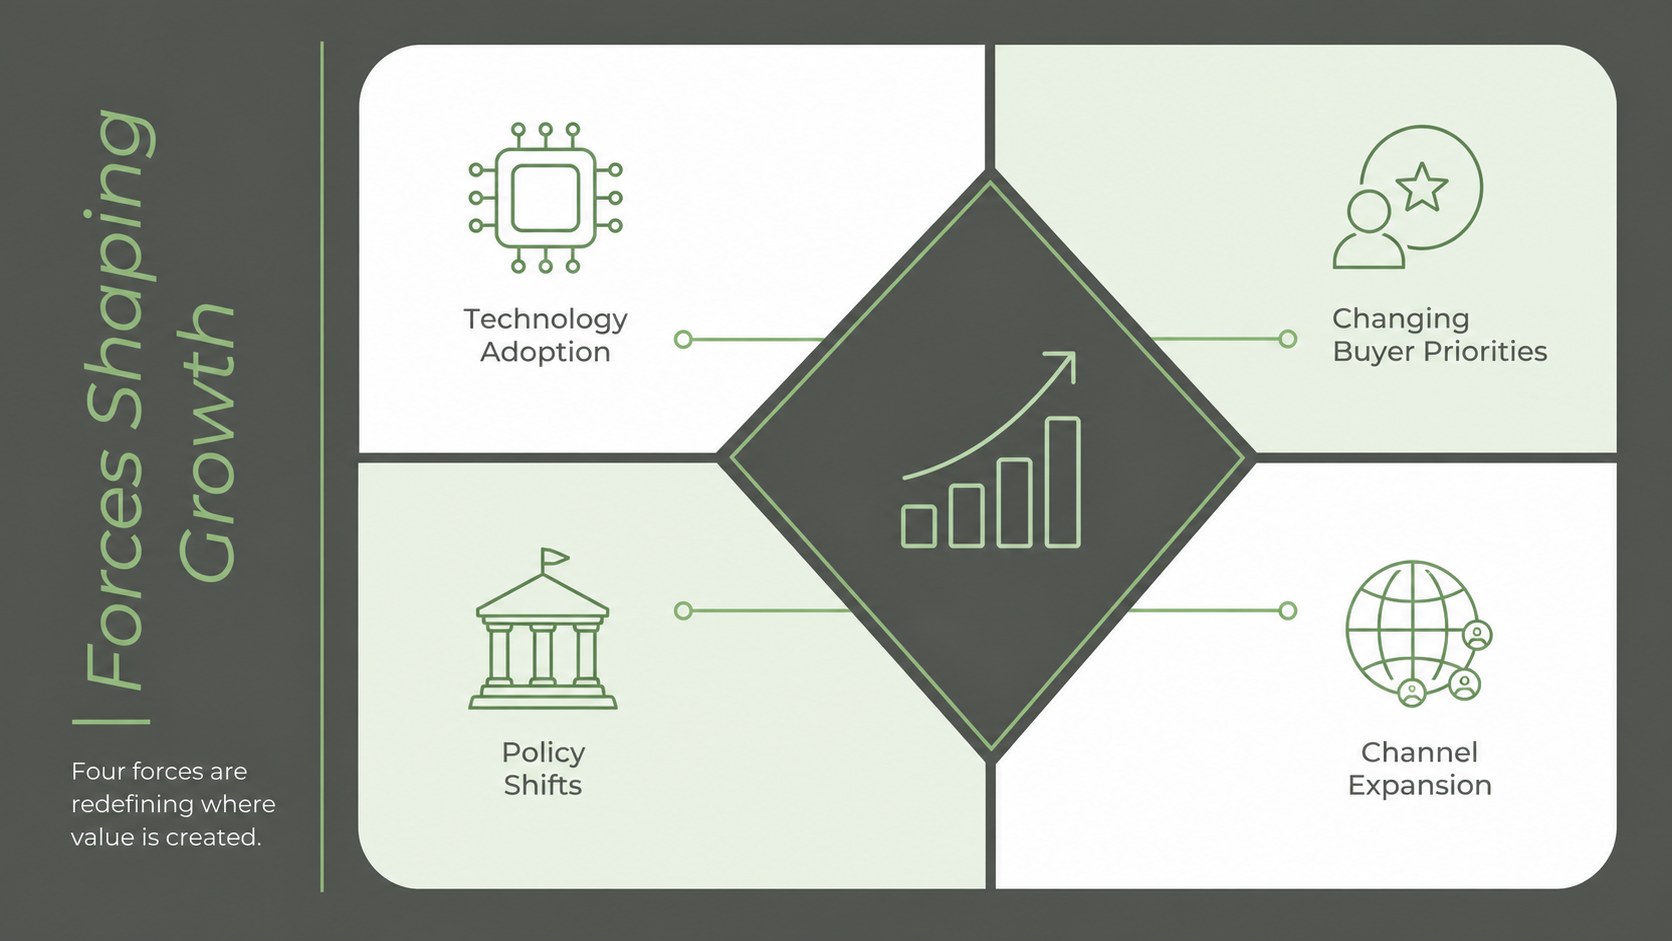
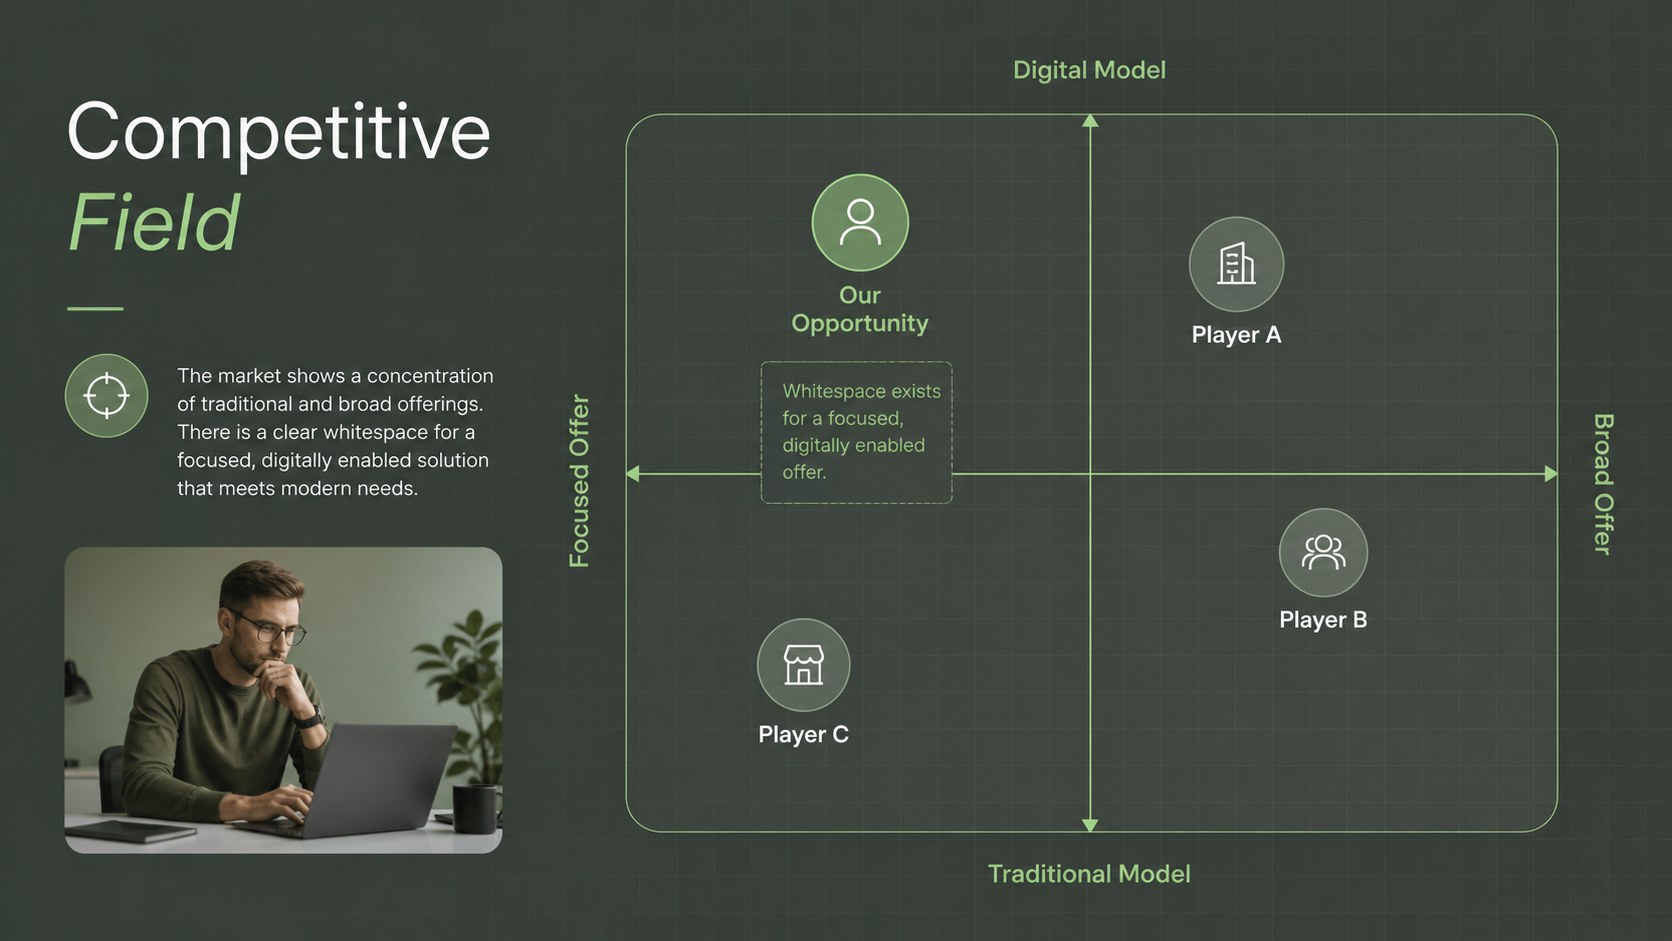
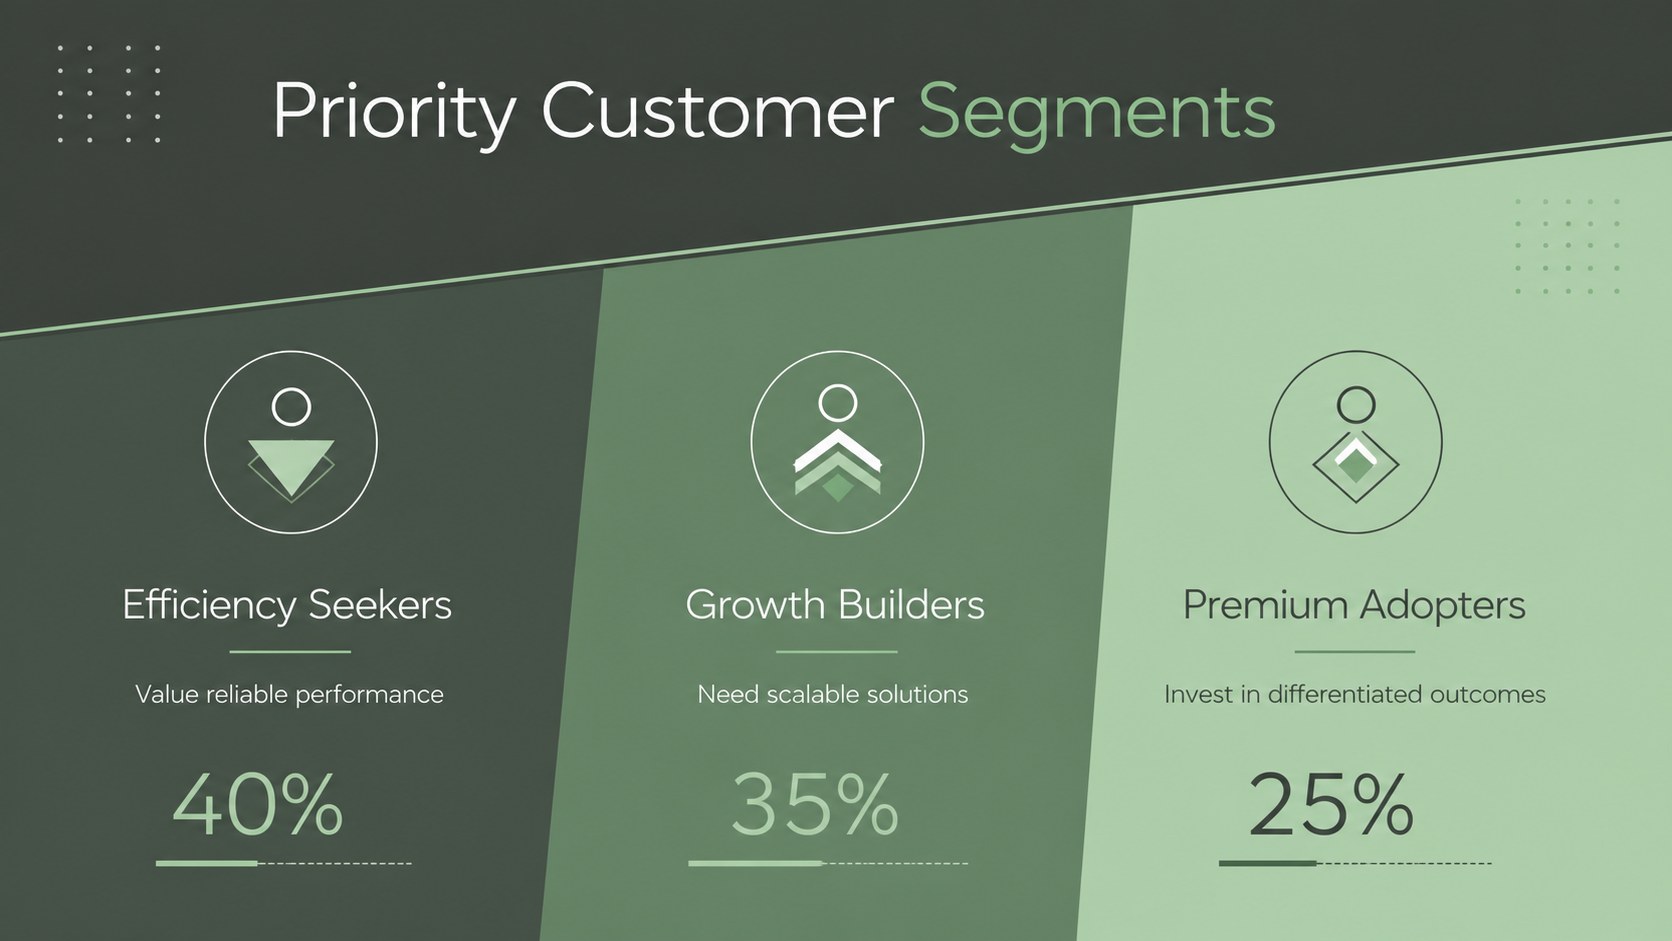
The 15-slide market signals presentation template includes layouts for an executive summary, trend indicators, market drivers, customer demand, competitor positioning, growth forecasts, regional comparisons, risks, opportunities, and recommended actions. Flexible charts, data callouts, matrices, and timelines help you build an industry growth forecast presentation without overcrowding the story. Every layout is editable, so teams can replace sample figures, adjust colors, revise labels, and reorganize sections around their own research.
Use the deck for investor updates, quarterly planning, product strategy sessions, consulting reports, or leadership briefings. It also works as an executive market outlook deck when decision-makers need concise findings supported by visual evidence. The widescreen slides are compatible with PowerPoint and Google Slides, making them practical for individual editing, team collaboration, presenting online, or exporting to PDF. Montserrat typography and a balanced minimalist structure keep dense information readable while maintaining a confident, business-ready tone.
Perfect for: startup investor update; quarterly strategy review; industry outlook briefing; product planning workshop; consulting research report; executive market forecast.
Frequently asked questions
Can I edit all charts and text in this deck? Yes. The text, data labels, charts, shapes, and colors can be customized to match your research and brand guidelines. Replace the sample content with your own figures before presenting.
Practical details
Yes. The text, data labels, charts, shapes, and colors can be customized to match your research and brand guidelines. Replace the sample content with your own figures before presenting.
The deck is designed for Microsoft PowerPoint and Google Slides. It uses a 16:9 widescreen format that also exports cleanly to PDF for sharing.
Update the theme colors or recolor individual shapes, charts, and accents within your presentation editor. The green palette can be retained as the primary color or paired with your organization's approved neutrals.
The layouts support growth rates, customer behavior, competitive benchmarks, regional results, demand indicators, and forecast scenarios. Use concise labels and cite the source of any external data in the provided footer areas.
Keep exploring
15Build an engaging World UFO Day session with this flying saucer history lesson deck, featuring retro green-and-brown slides for PowerPoint and Google Slides.
 15
Plan a lively animal-learning journey with this jungle zoo adventure lesson deck, ready to customize in PowerPoint and Google Slides for young learners.
 16
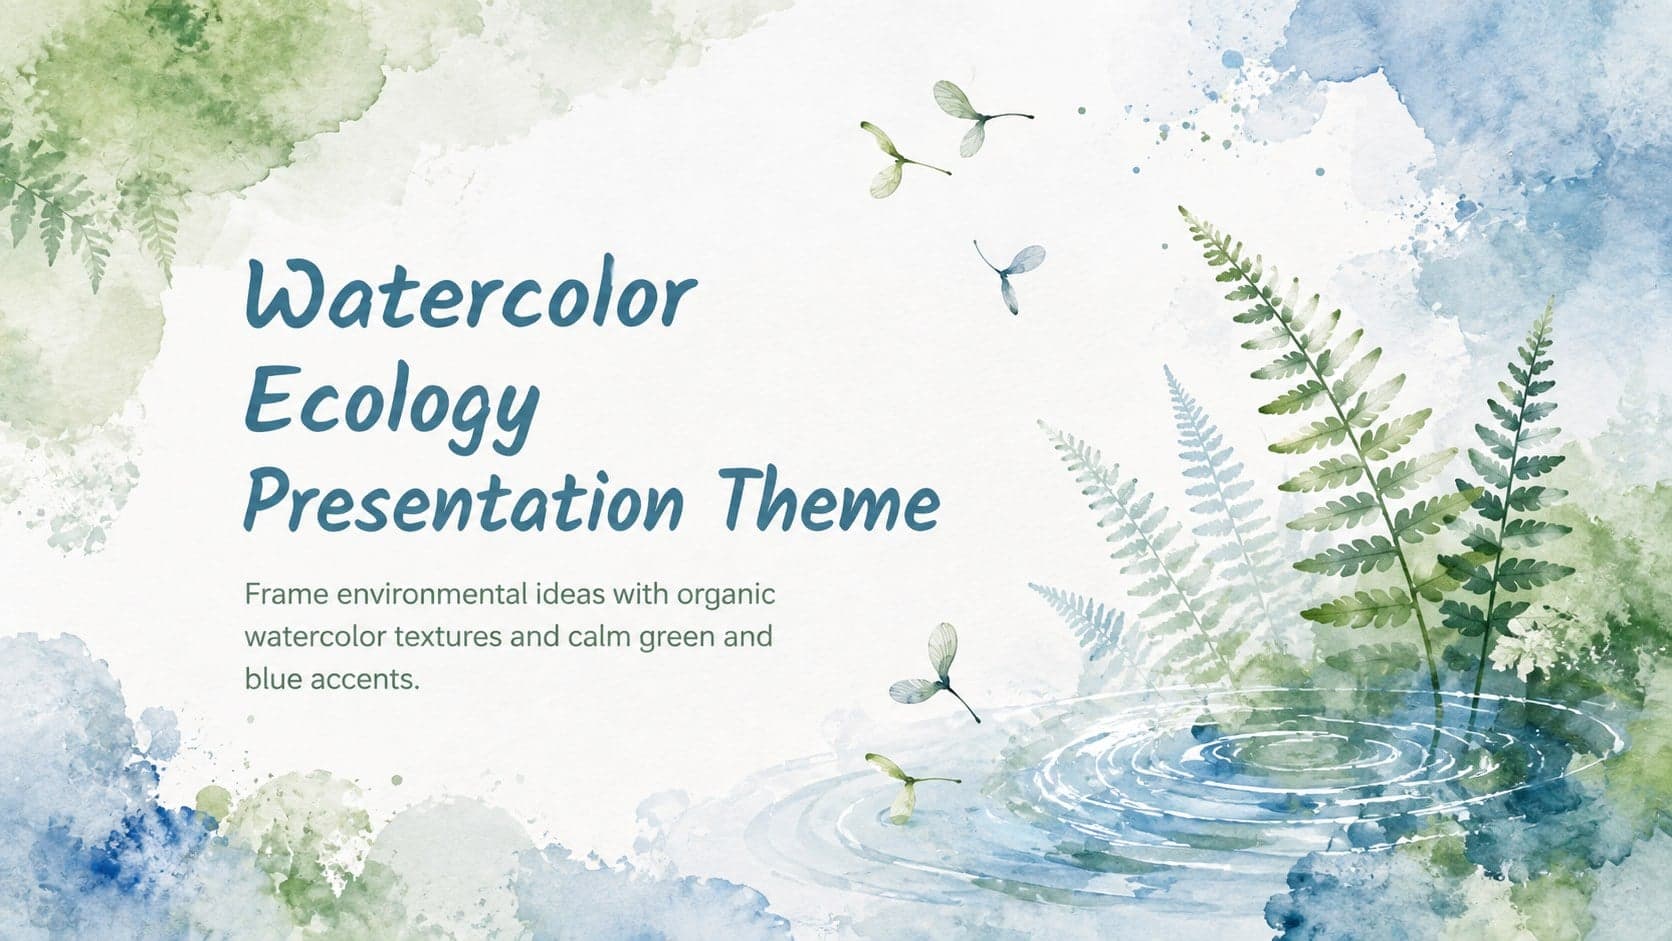
Turn environmental research into a clear story with a Watercolor Ecology Presentation Theme for PowerPoint and Google Slides in calming green and blue.
 16
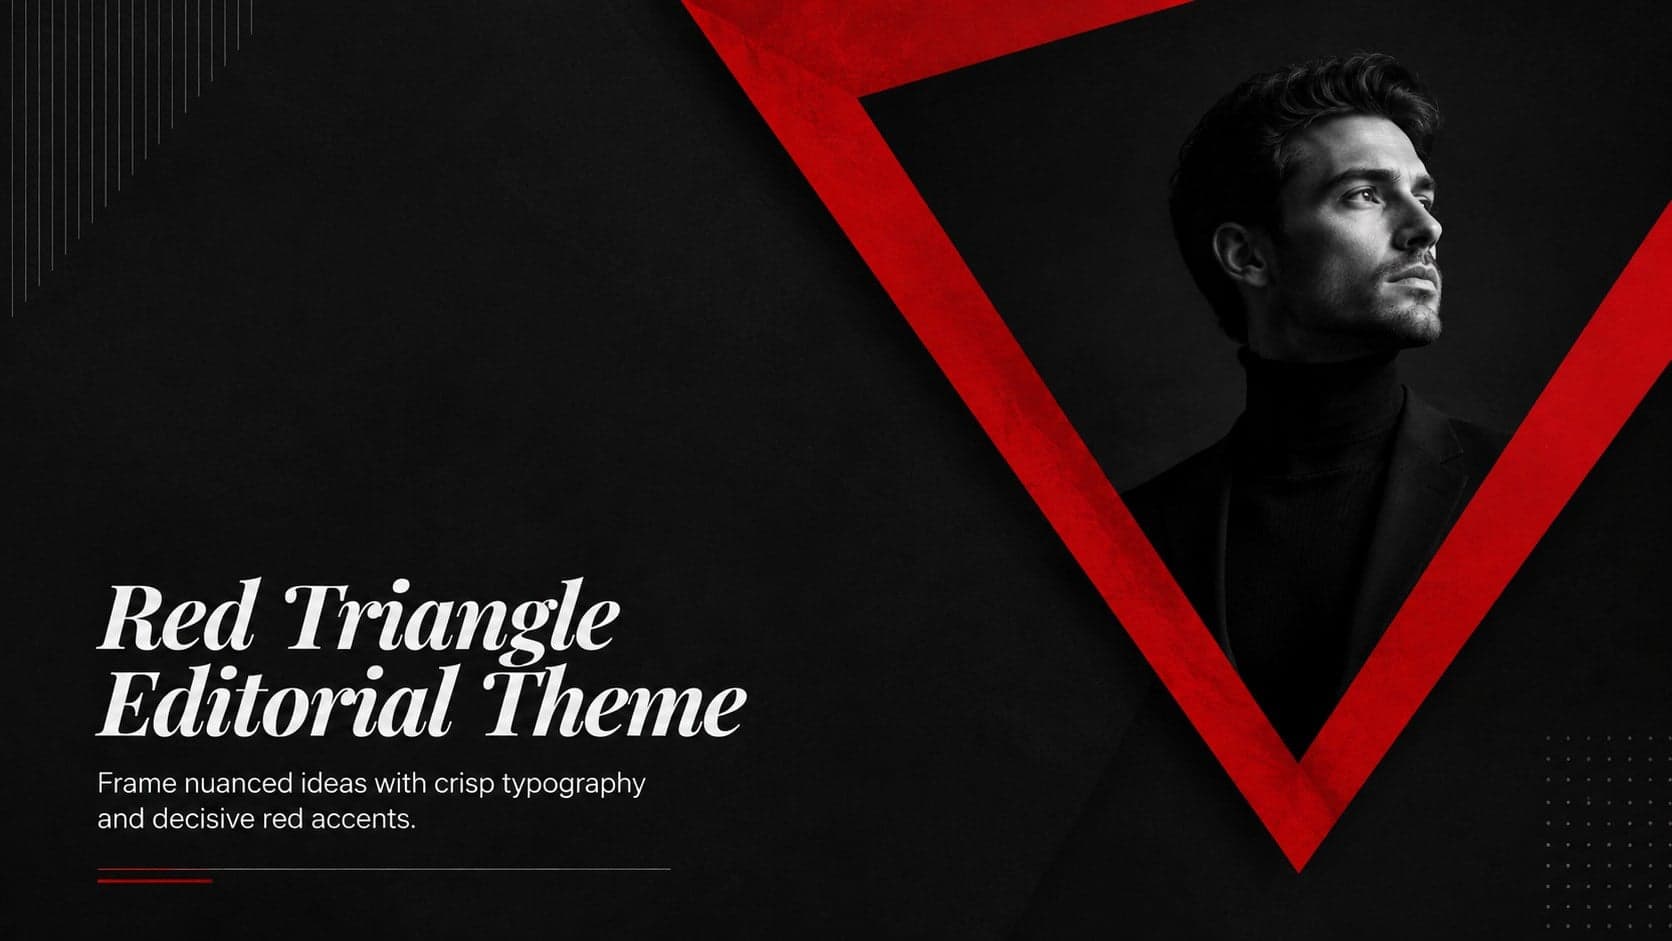
Build focused fashion, literature, and humanities presentations with the Red Triangle Editorial Theme, editable in PowerPoint and Google Slides.
 15
Turn streaming stats, favorite tracks, and concert highlights into a bold annual listening recap slide deck for PowerPoint and Google Slides.
 15
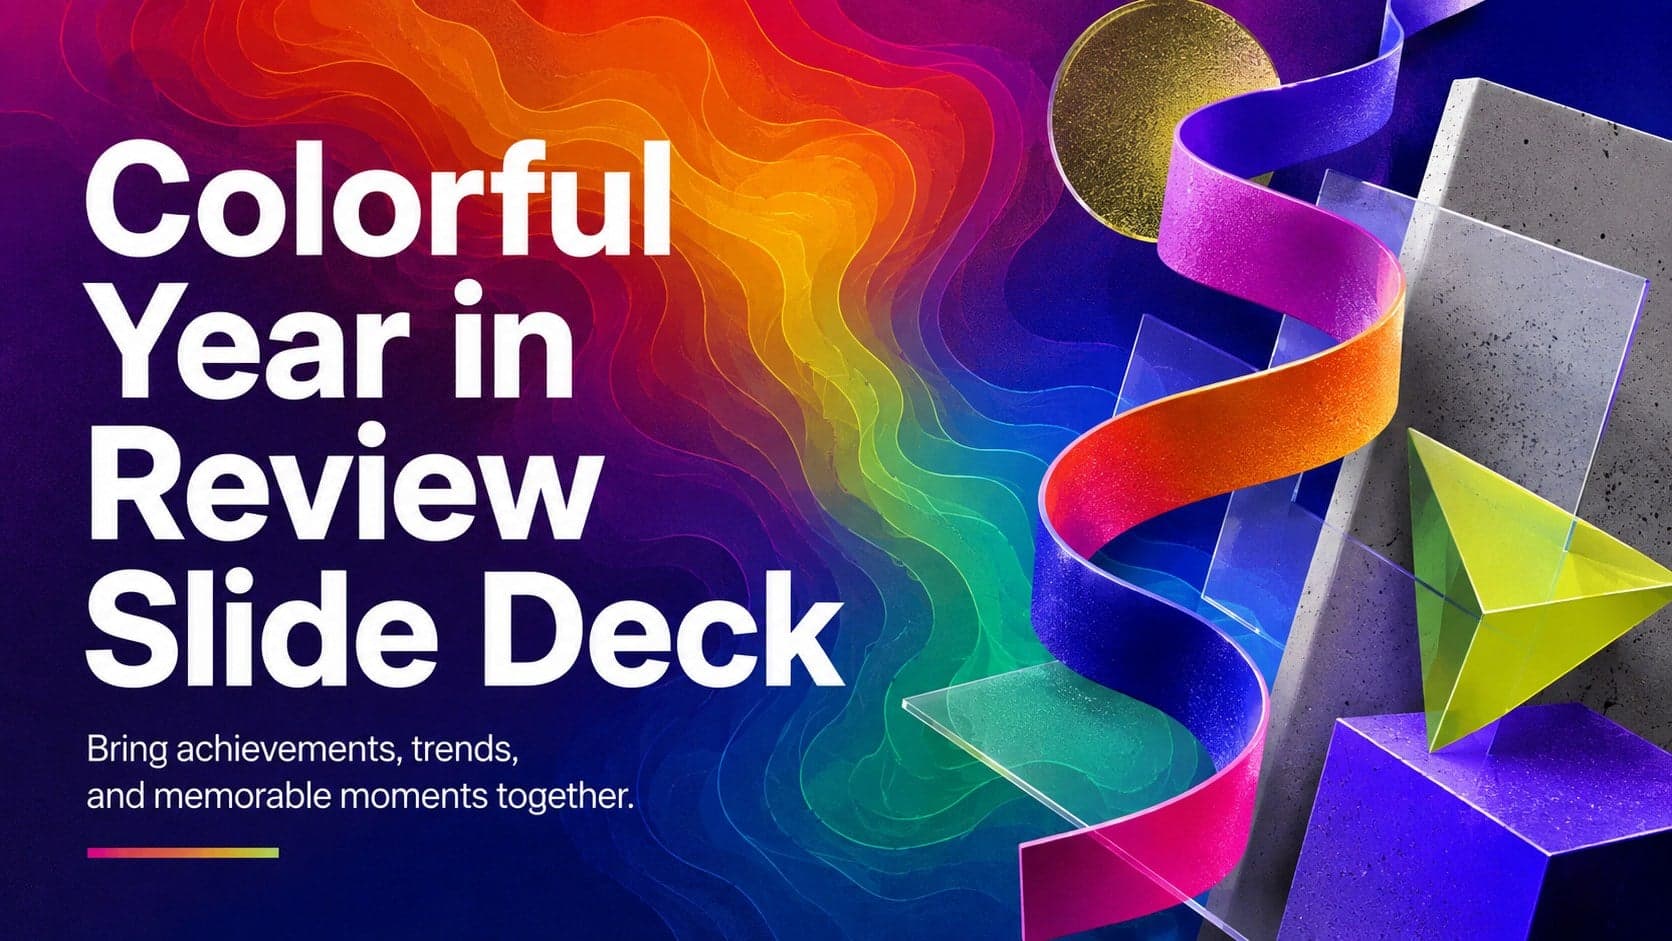
Turn highlights, milestones, and favorite moments into a colorful year in review slide deck with bold 3D graphics for PowerPoint and Google Slides.
 3
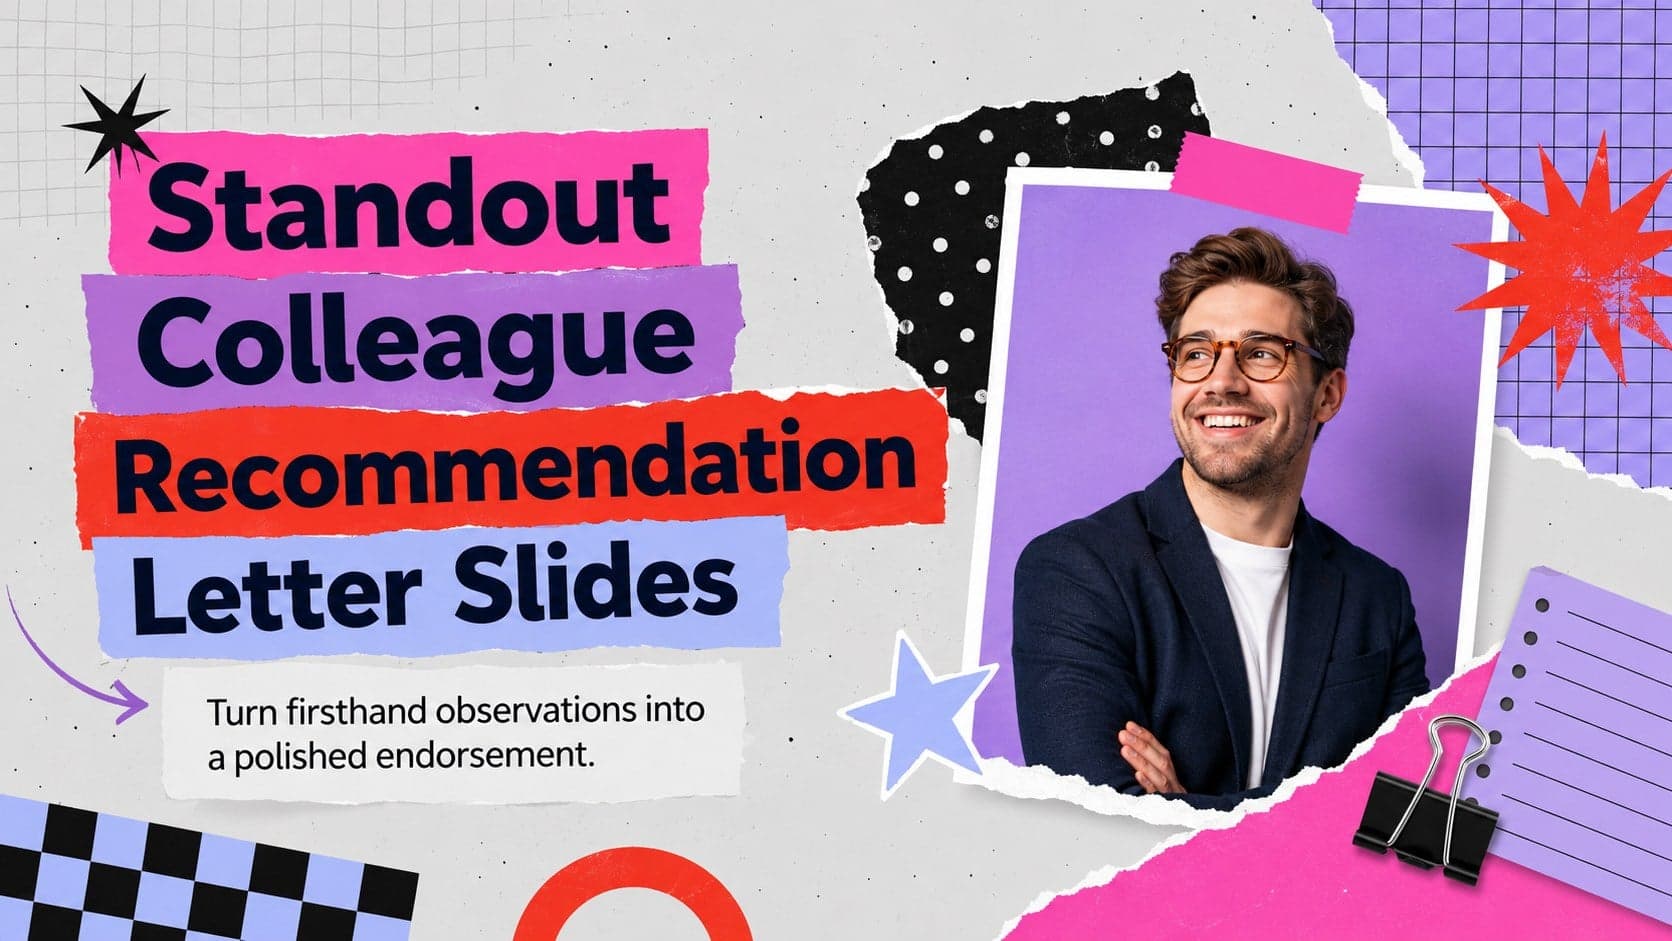
Build a credible endorsement with Standout Colleague Recommendation Letter Slides, featuring colorful prompts for skills, achievements, and team impact.
 4
Build clear beginner sessions with an ice hockey fundamentals training deck for coaches, PE teachers, and clubs, ready for PowerPoint and Google Slides.