
 15
15presentation
Flying Saucer History Lesson Deck
Build an engaging World UFO Day session with this flying saucer history lesson deck, featuring retro green-and-brown slides for PowerPoint and Google Slides.
Google SlidesPowerPoint
presentation · English
Build an election results briefing deck with crisp blue and red slides for turnout data, regional trends, polling summaries, and civic presentations.
Design notes
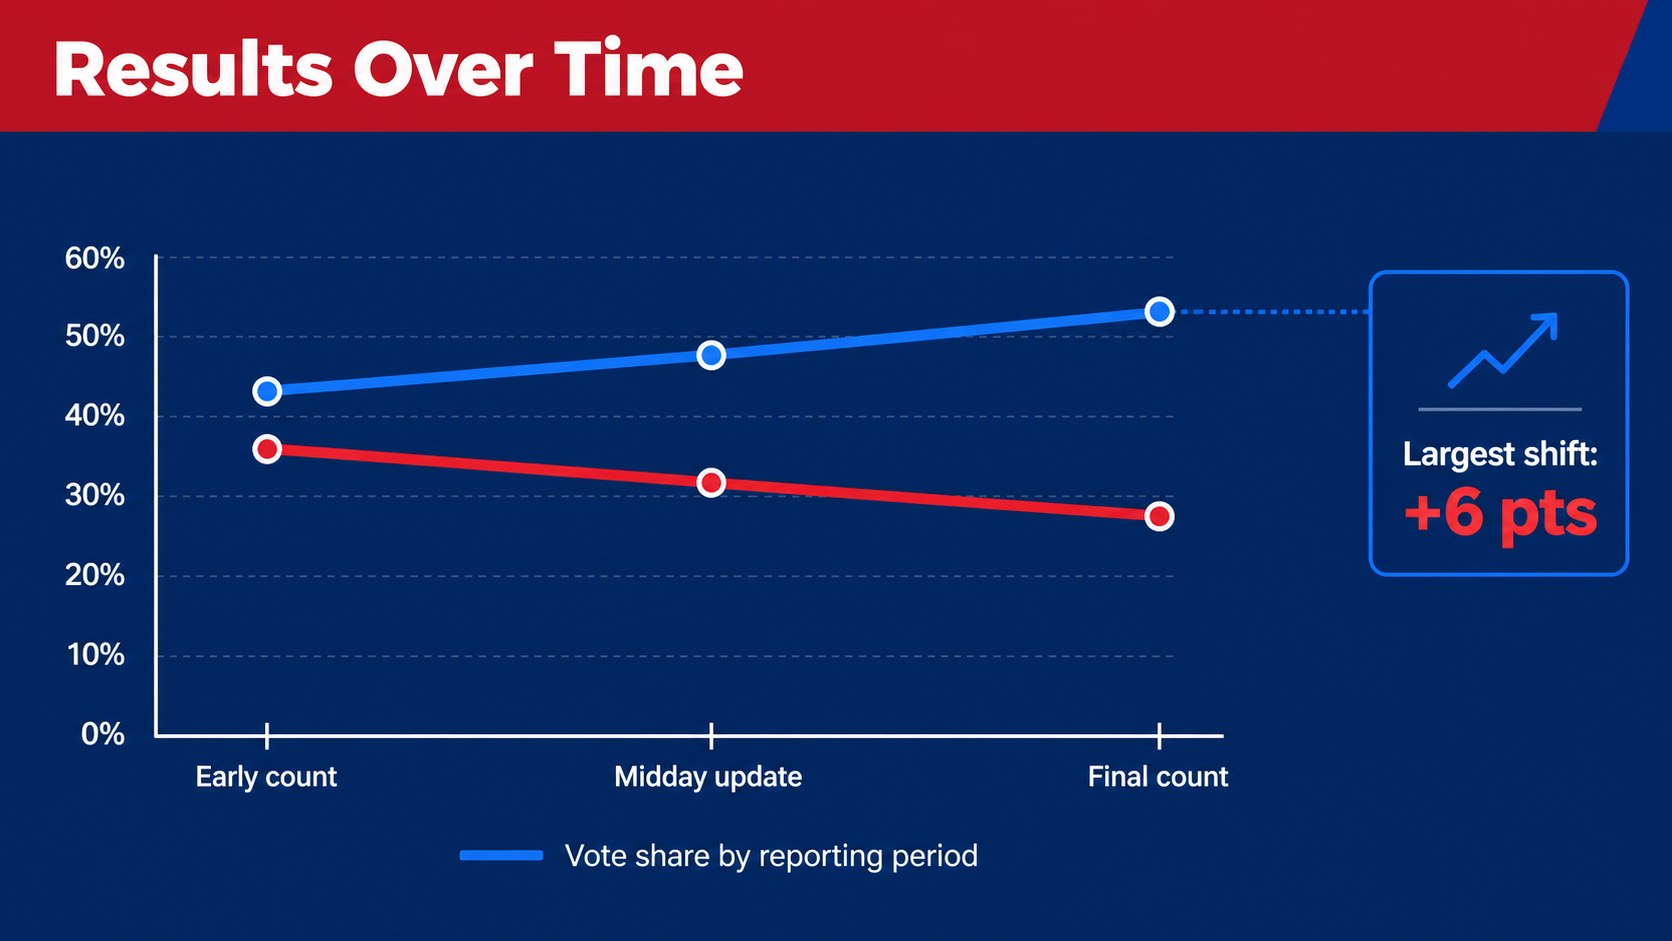
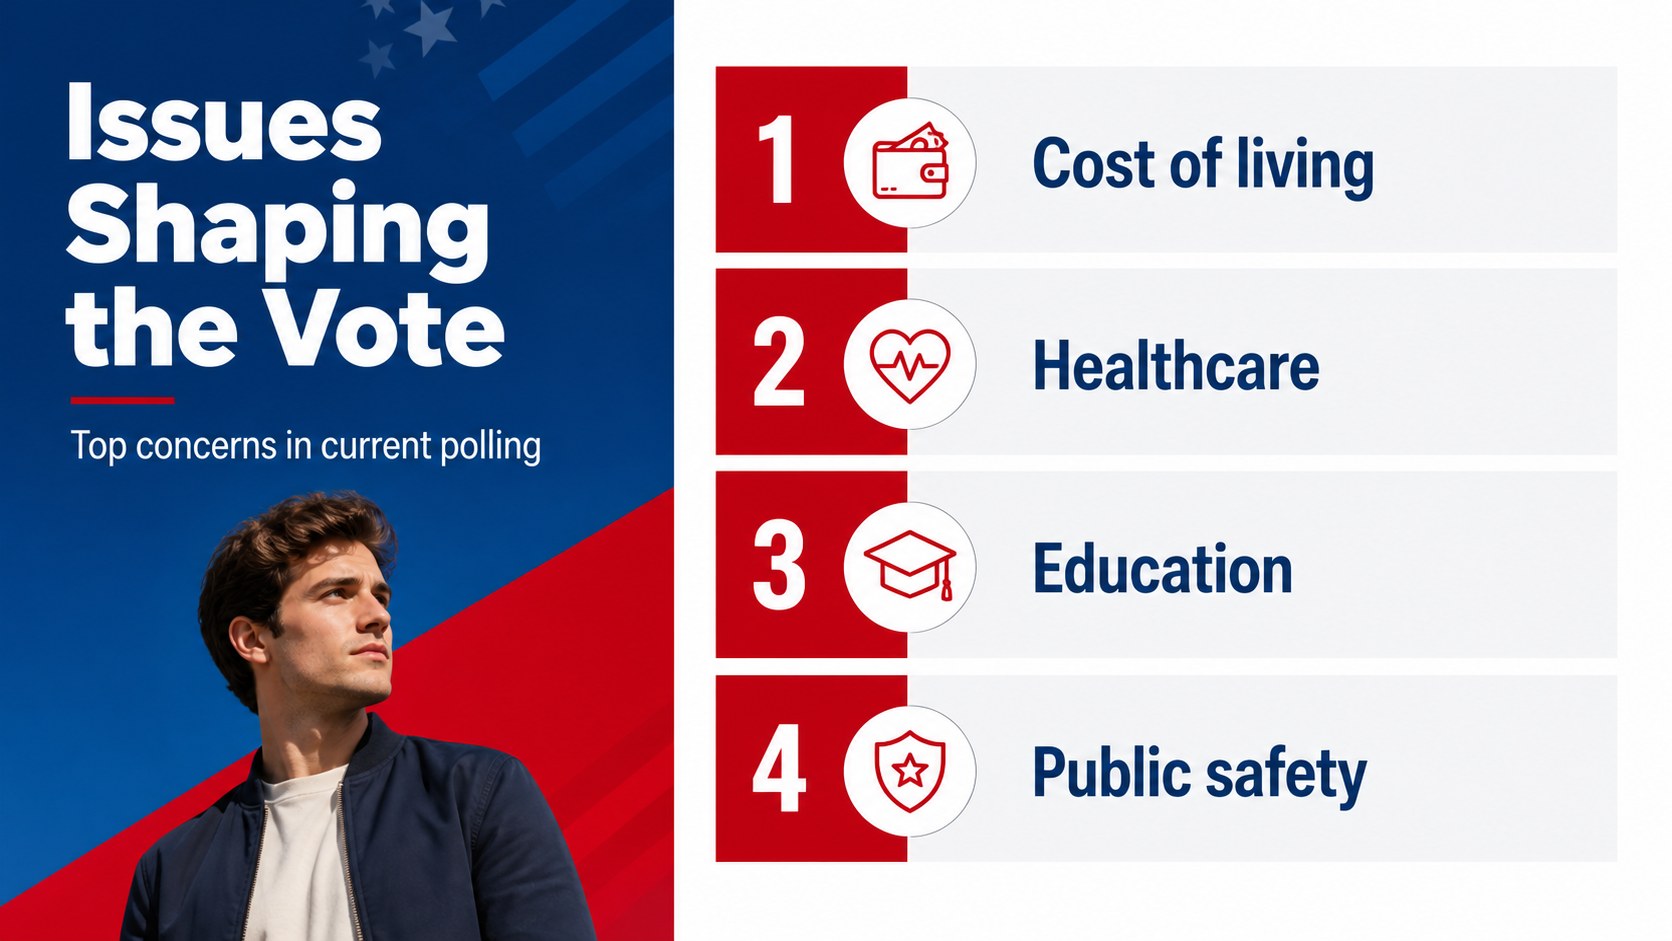
Create an election results briefing deck that turns voting data into a clear, compelling story. The clean visual system combines confident blue, energetic red, white space, and Montserrat typography to help audiences follow key figures without distraction. Use the layouts for campaign updates, newsroom explainers, civic education, or government communications.
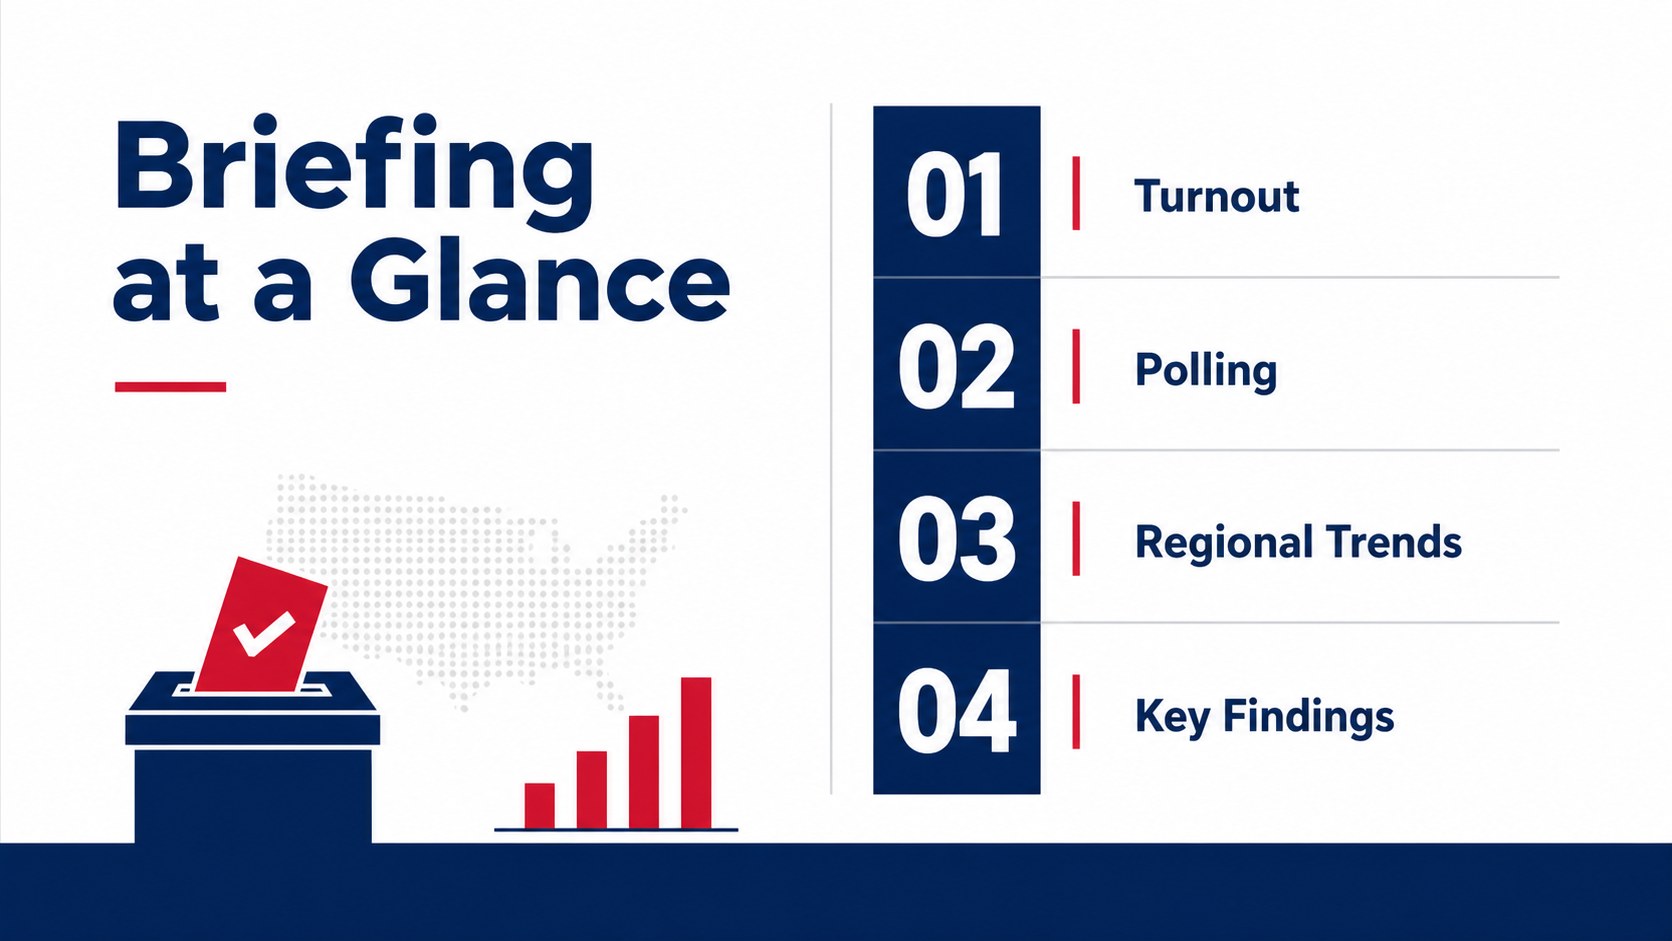
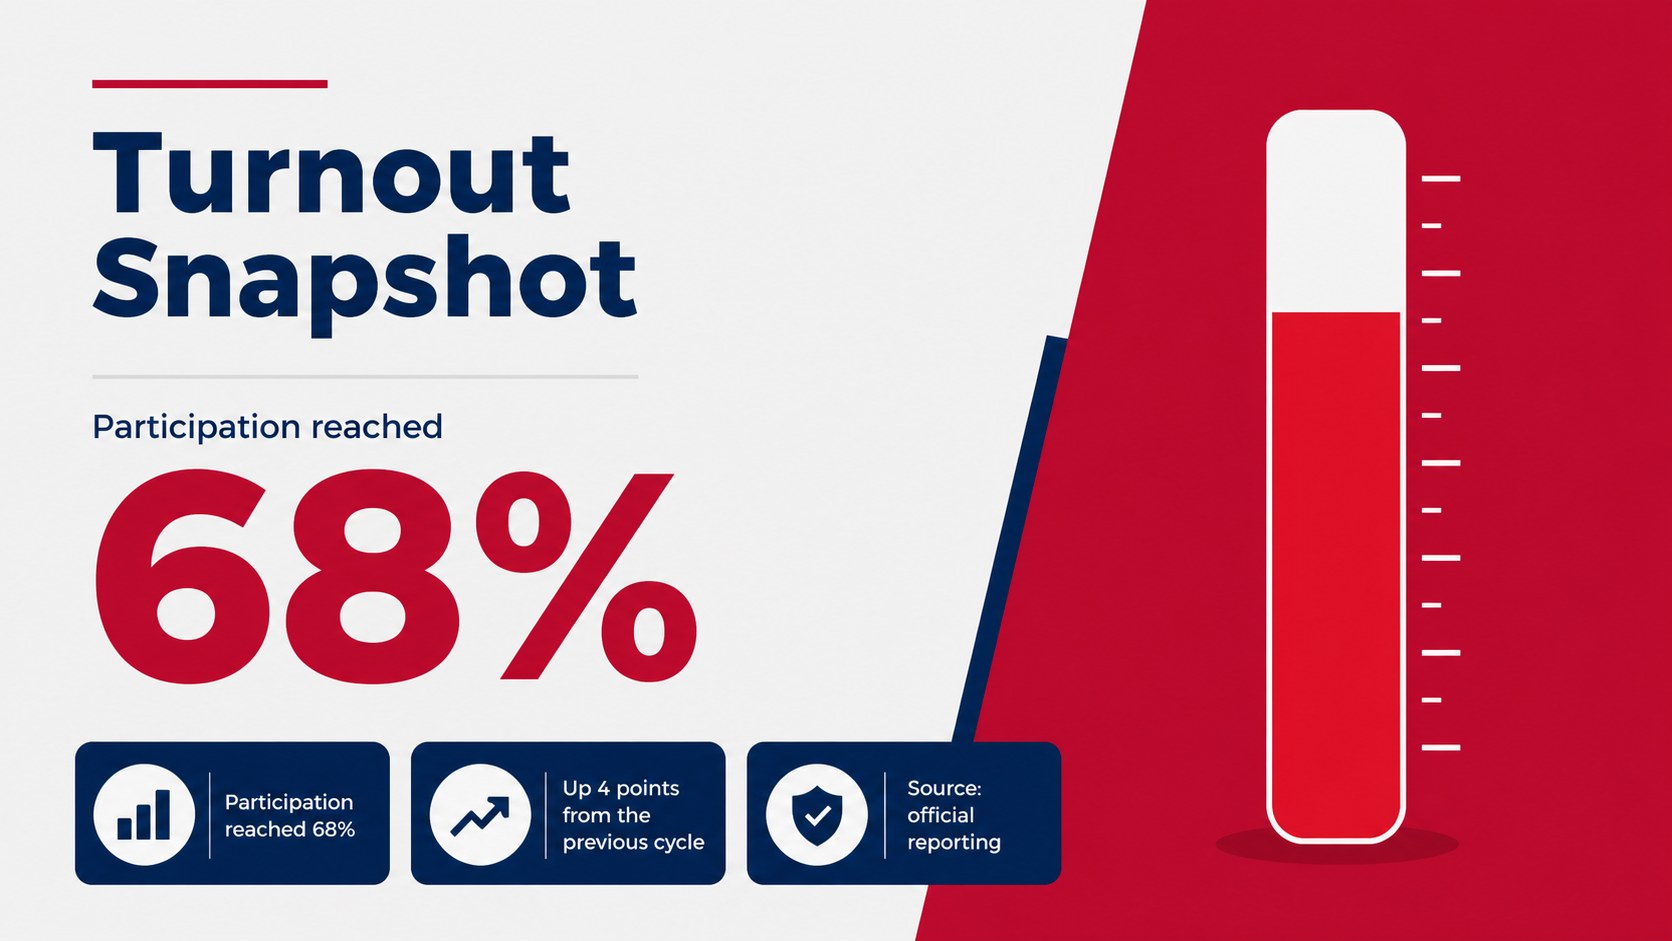
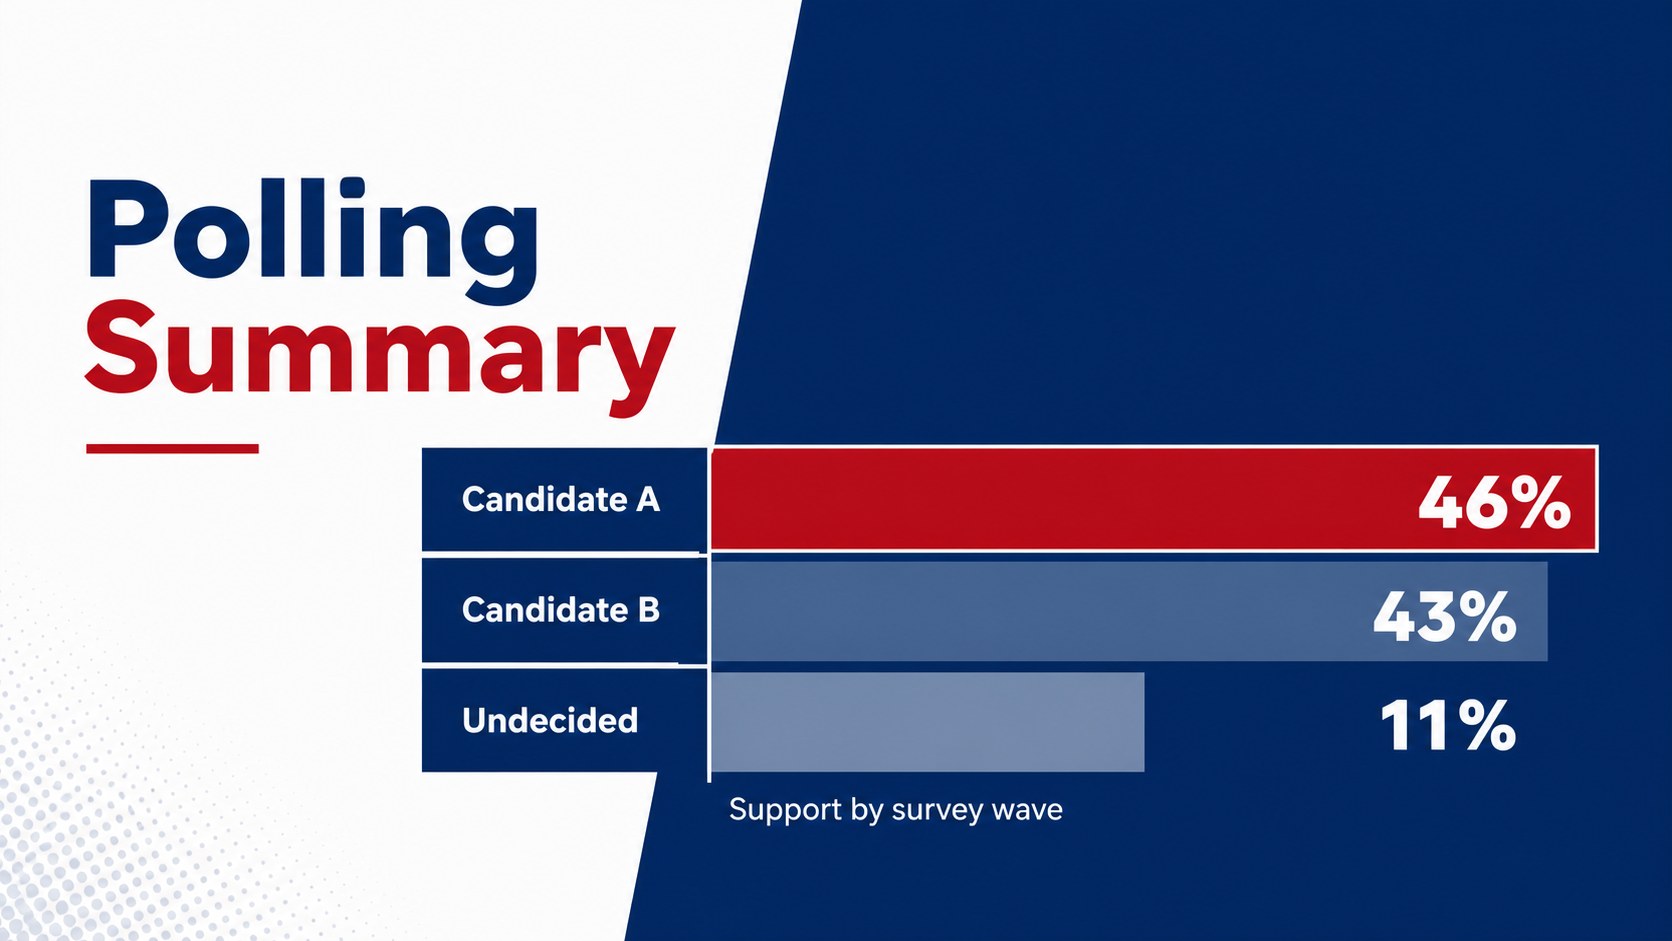
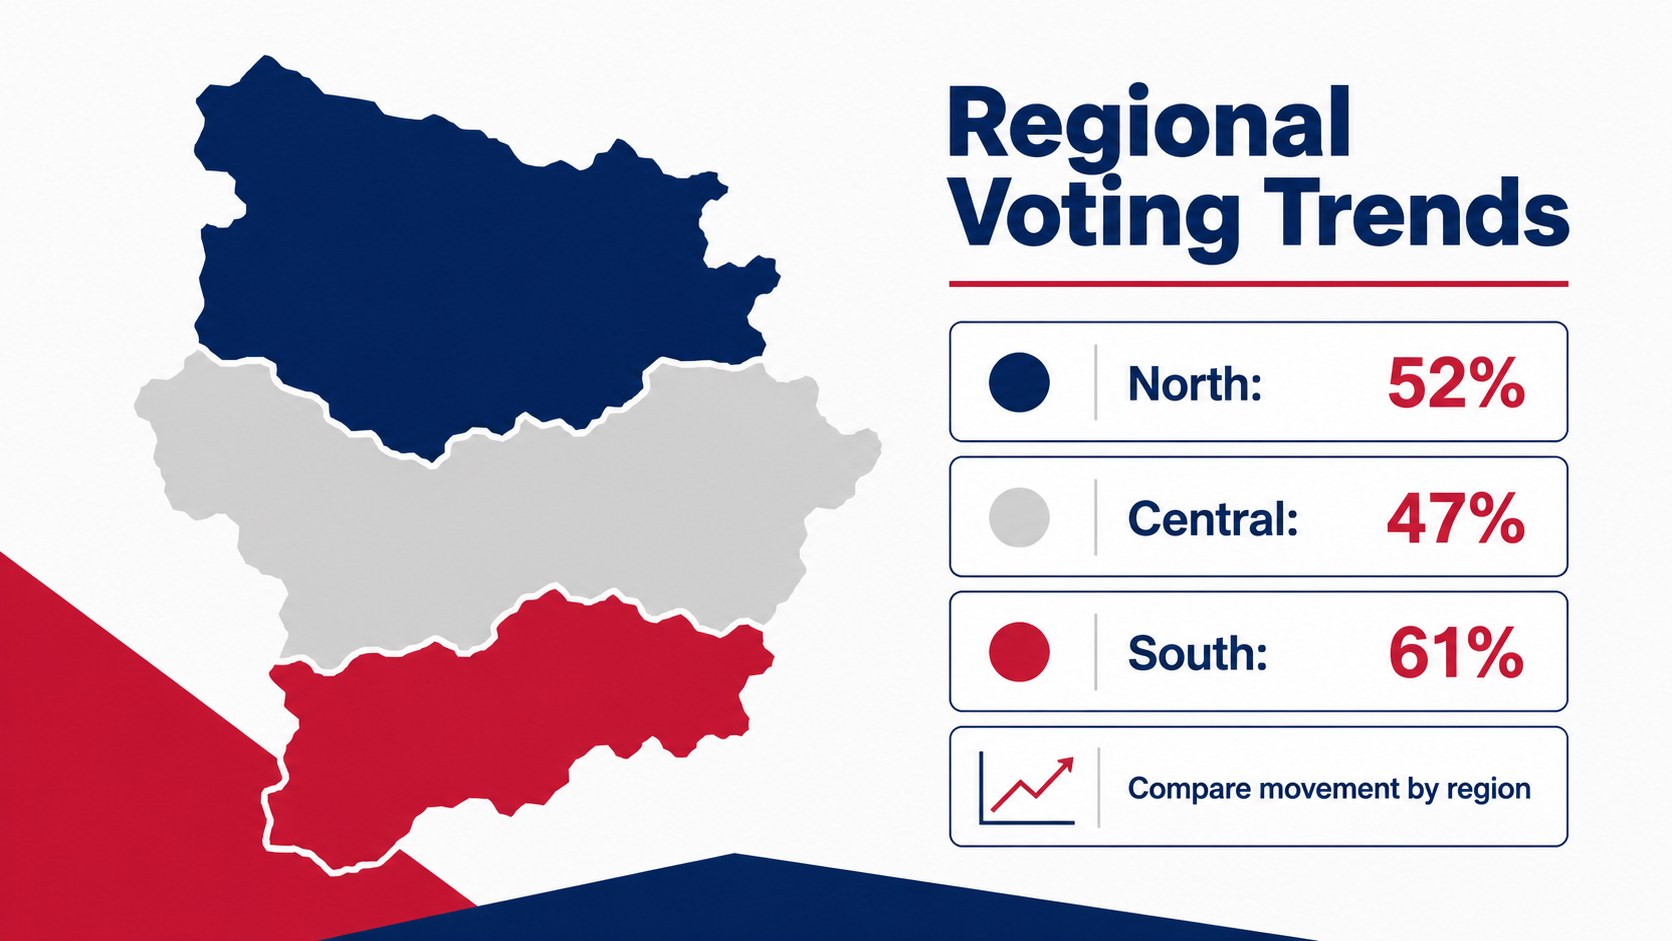
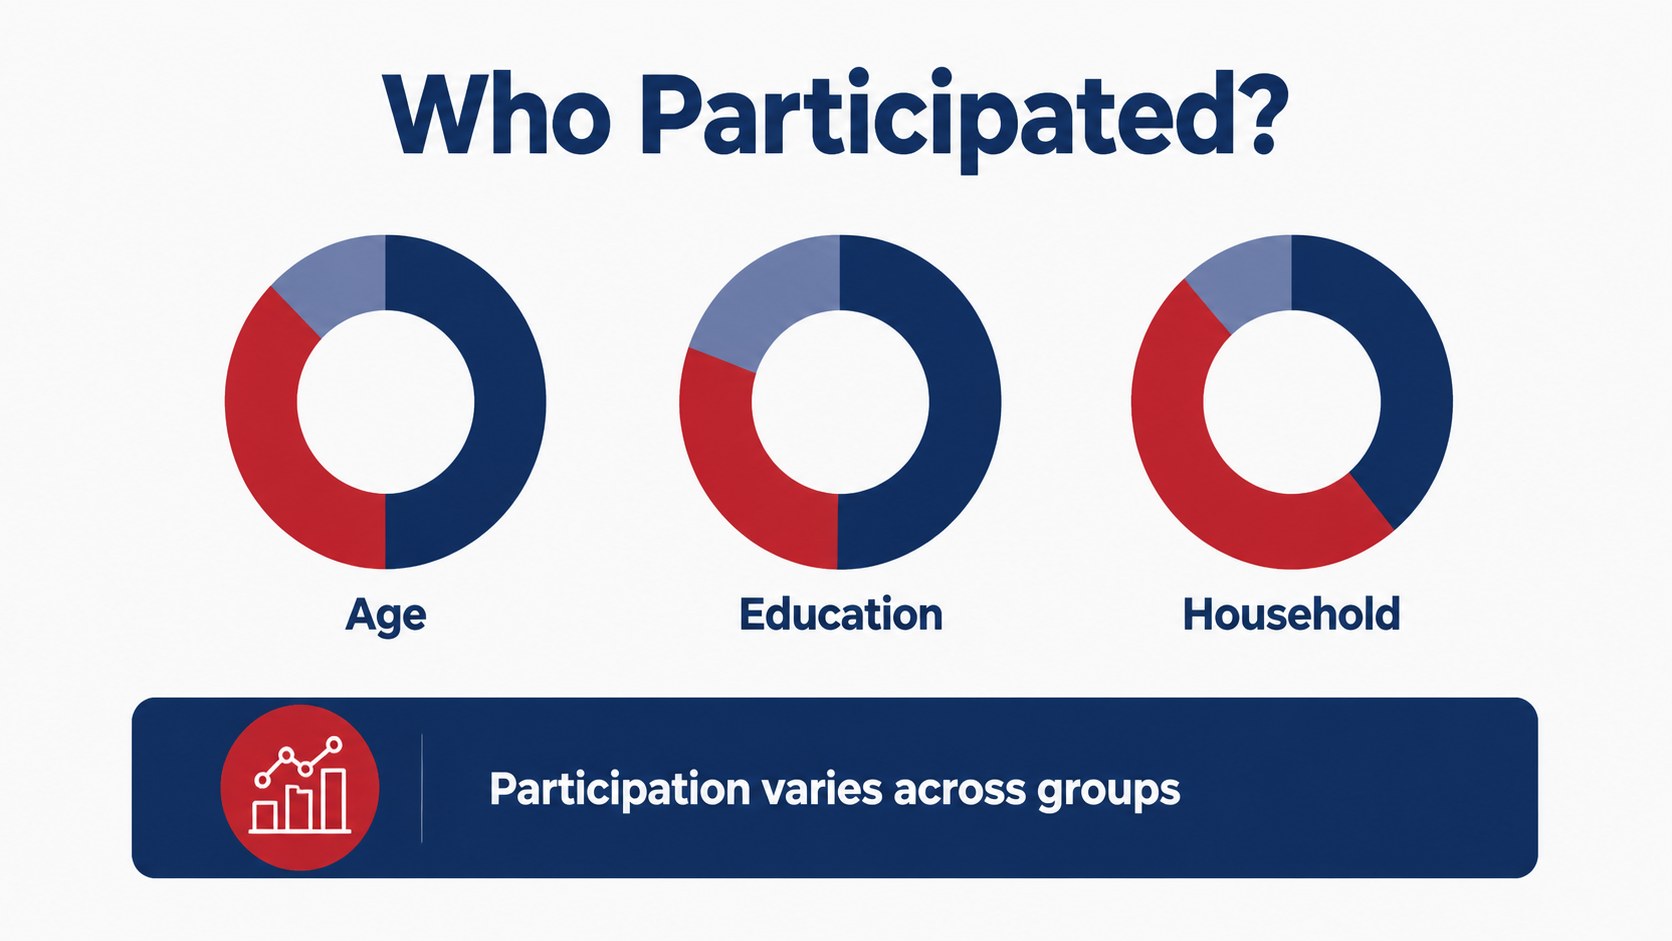
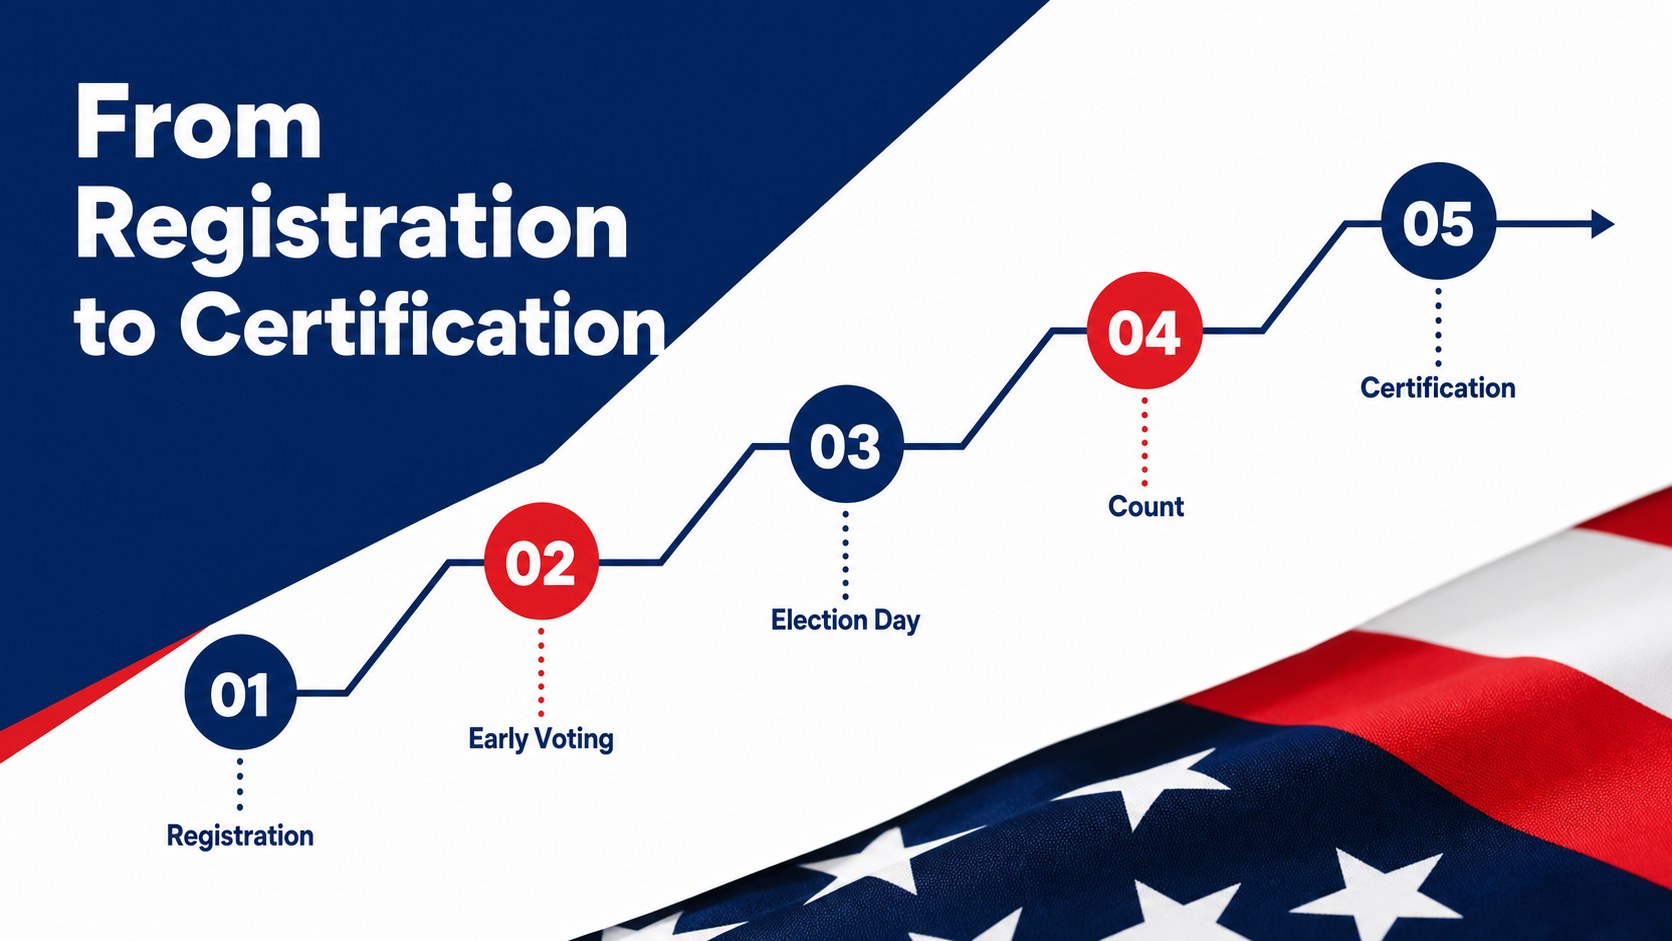
Inside, you’ll find 15 editable 16:9 slides for an opening statement, agenda, turnout snapshot, polling overview, regional comparison, demographic breakdown, timeline, chart-based analysis, issue priorities, results summary, and closing discussion. Add your own numbers, labels, maps, icons, and notes in PowerPoint or Google Slides. The modular layouts make it simple to move from a high-level election data presentation to detailed district or state analysis while keeping the visual language consistent.
This deck is useful for political analysts, campaign staff, journalists, teachers, nonprofits, public affairs teams, and students. It supports both live presentations and downloadable reports, with room for speaker notes, source references, and concise takeaways. Customize colors within the blue-and-red palette, replace graphics, animate key findings, and adapt the content for local, national, or comparative voting contexts.
Perfect for: campaign results report; voter turnout analysis; newsroom election briefing; civic education lesson; government public update.
Frequently asked questions
Can I edit this deck in PowerPoint and Google Slides? Yes. The layouts are designed for PowerPoint and Google Slides, with editable text, shapes, charts, and graphic elements. You can also adapt the presentation.
Practical details
Yes. The layouts are designed for PowerPoint and Google Slides, with editable text, shapes, charts, and graphic elements. You can also adapt the presentation.
You can replace all sample figures, labels, charts, and supporting text with your own information. The layouts are suitable for local, state, national, or historical election data.
Yes. The clear layouts work well for lessons about voting systems, turnout, polling, media literacy, and civic participation. Add source notes and discussion prompts to make the deck fit your curriculum.
Yes. Adjust the theme colors, typography, icons, illustrations, and charts while retaining the original visual structure. You can soften or intensify the blue-and-red contrast for your audience.
Keep exploring
15Build an engaging World UFO Day session with this flying saucer history lesson deck, featuring retro green-and-brown slides for PowerPoint and Google Slides.
 15
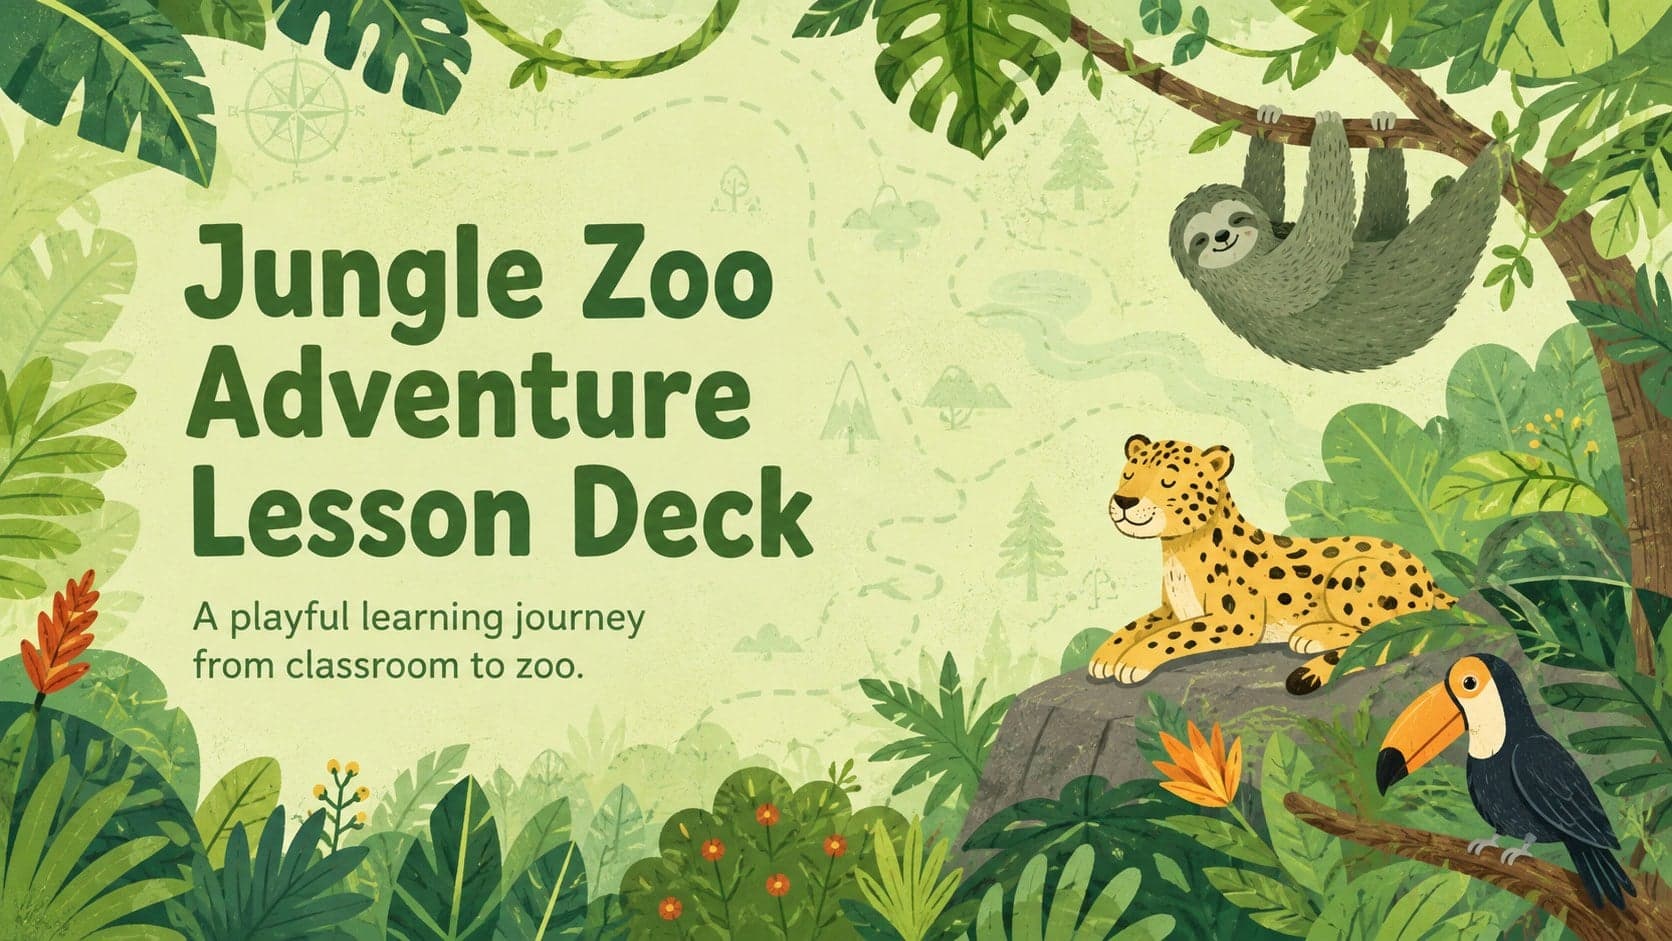
15Plan a lively animal-learning journey with this jungle zoo adventure lesson deck, ready to customize in PowerPoint and Google Slides for young learners.
 16
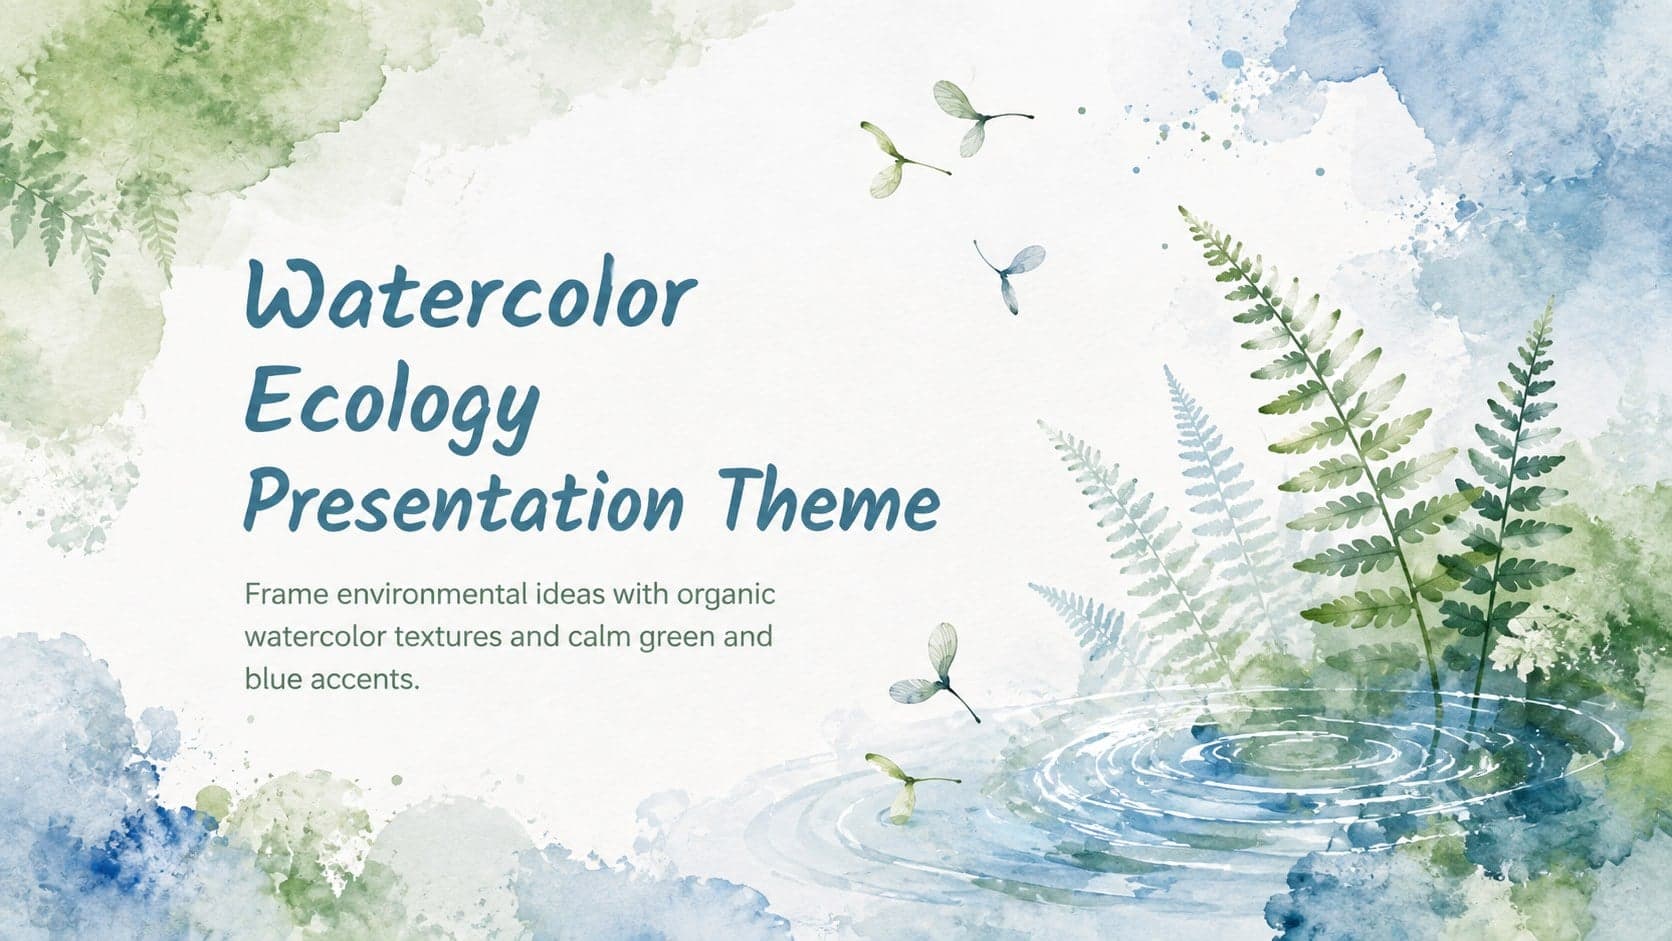
16Turn environmental research into a clear story with a Watercolor Ecology Presentation Theme for PowerPoint and Google Slides in calming green and blue.
 16
16Build focused fashion, literature, and humanities presentations with the Red Triangle Editorial Theme, editable in PowerPoint and Google Slides.
 15
15Turn streaming stats, favorite tracks, and concert highlights into a bold annual listening recap slide deck for PowerPoint and Google Slides.
 15
15Turn highlights, milestones, and favorite moments into a colorful year in review slide deck with bold 3D graphics for PowerPoint and Google Slides.
 3
3Build a credible endorsement with Standout Colleague Recommendation Letter Slides, featuring colorful prompts for skills, achievements, and team impact.
 4
4Build clear beginner sessions with an ice hockey fundamentals training deck for coaches, PE teachers, and clubs, ready for PowerPoint and Google Slides.