
 15
presentation
Flying Saucer History Lesson Deck
Build an engaging World UFO Day session with this flying saucer history lesson deck, featuring retro green-and-brown slides for PowerPoint and Google Slides.
Google SlidesPowerPoint
presentation · English
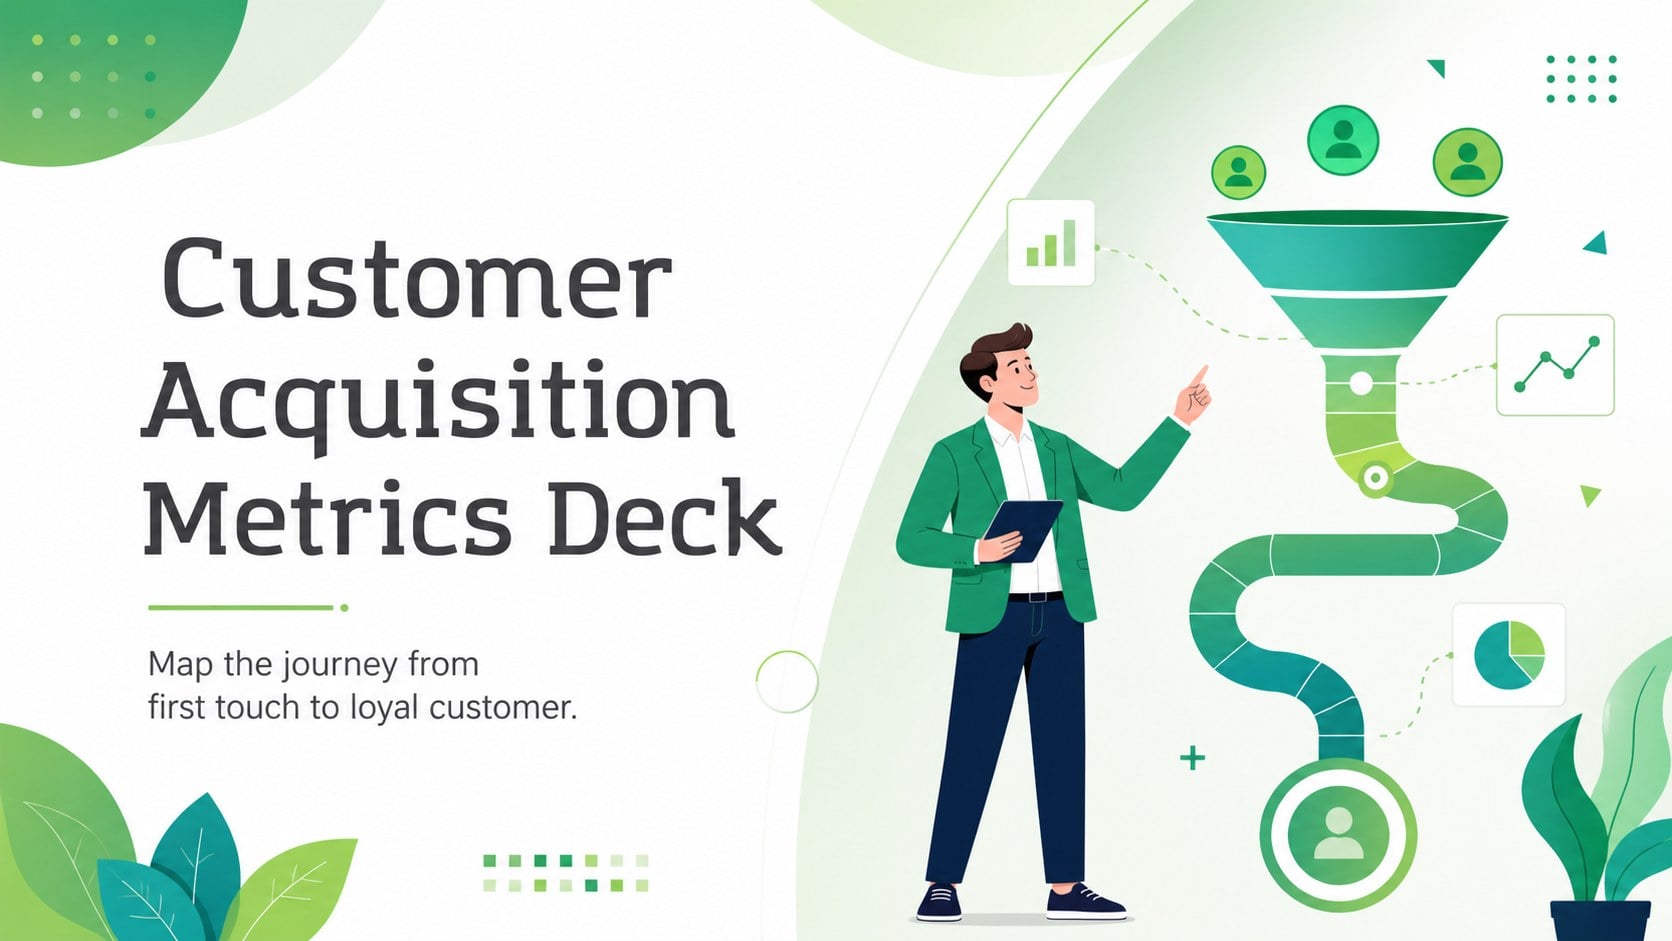
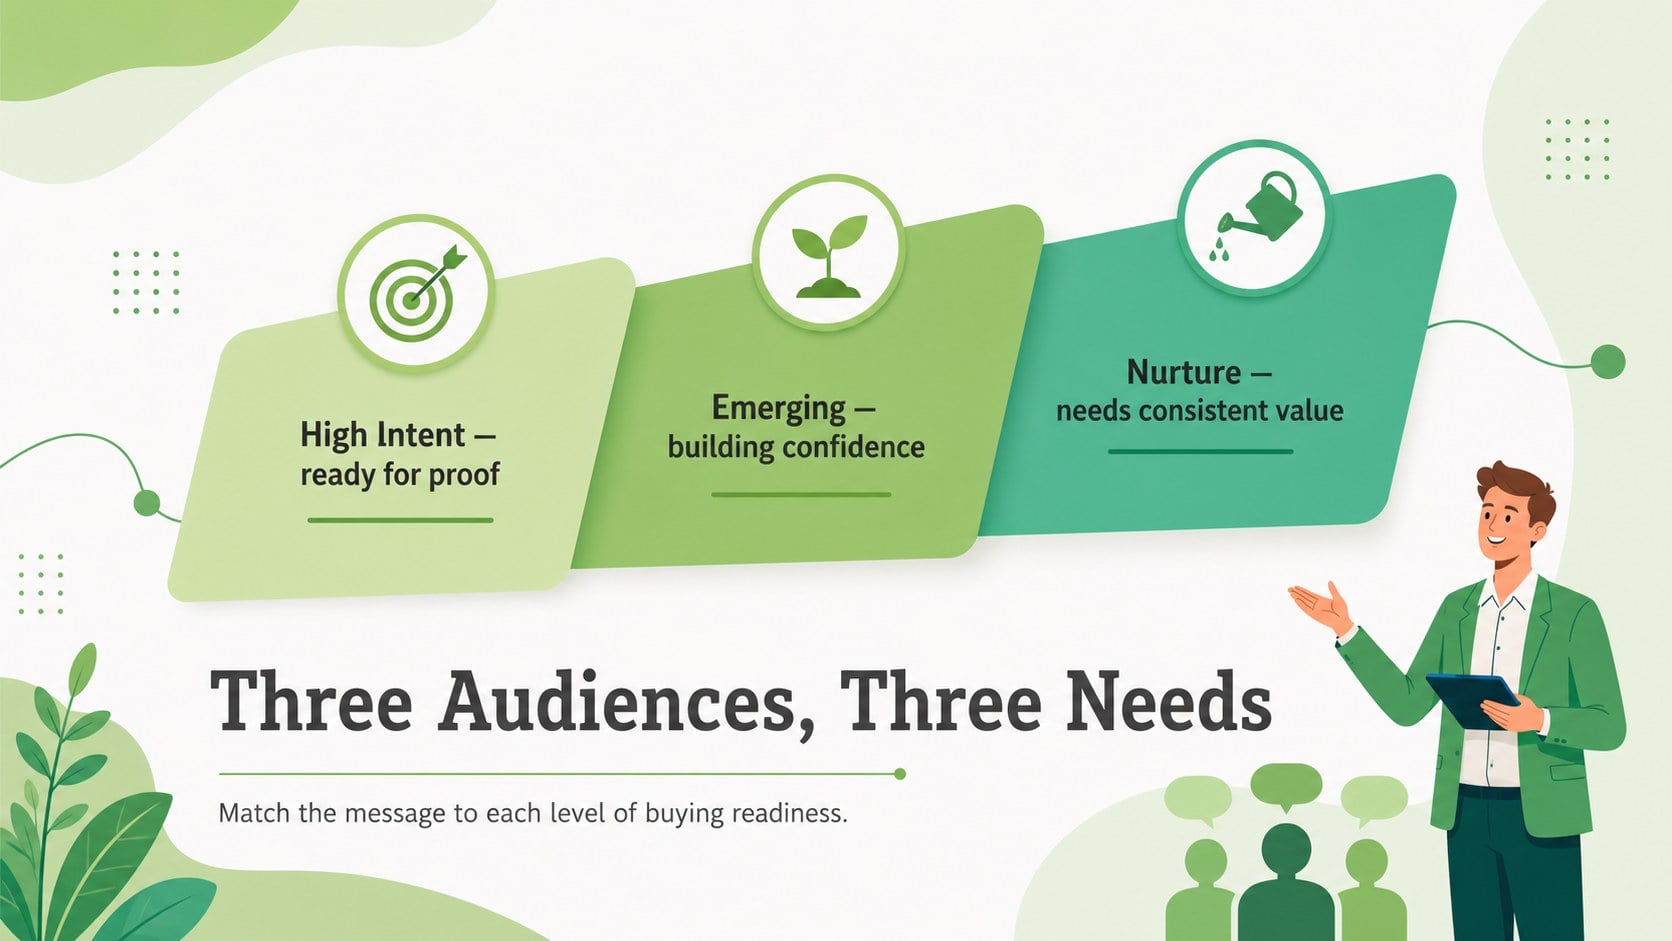
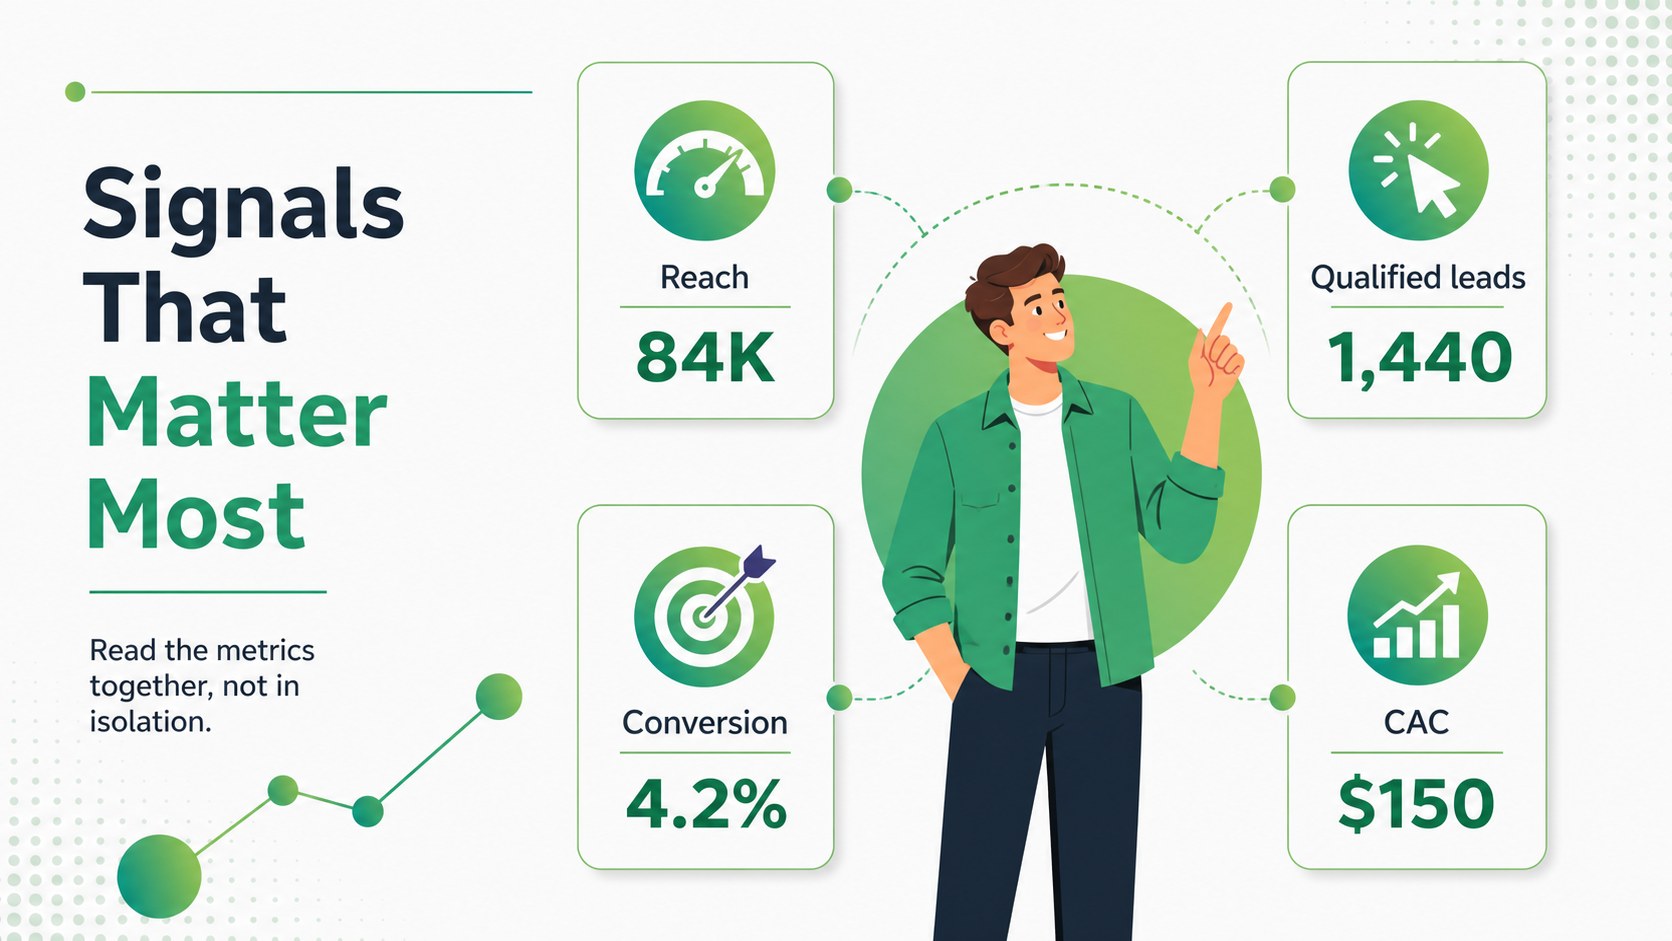
Clarify funnel performance with a customer acquisition metrics deck featuring editable green infographics for PowerPoint and Google Slides teams.
Design notes
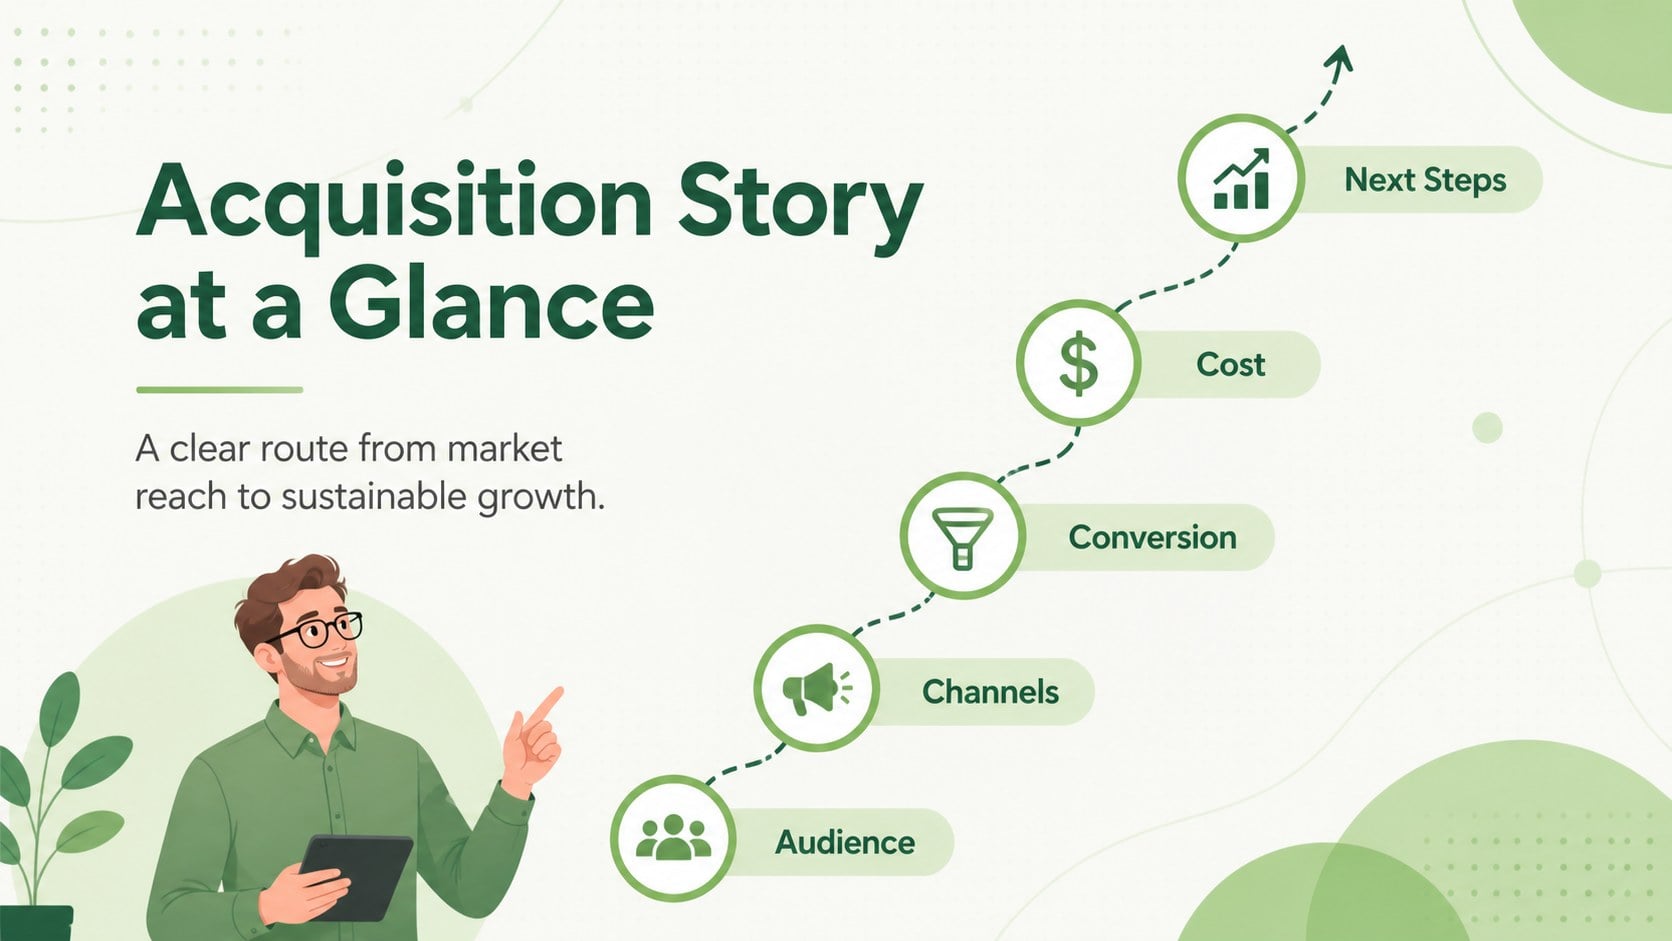
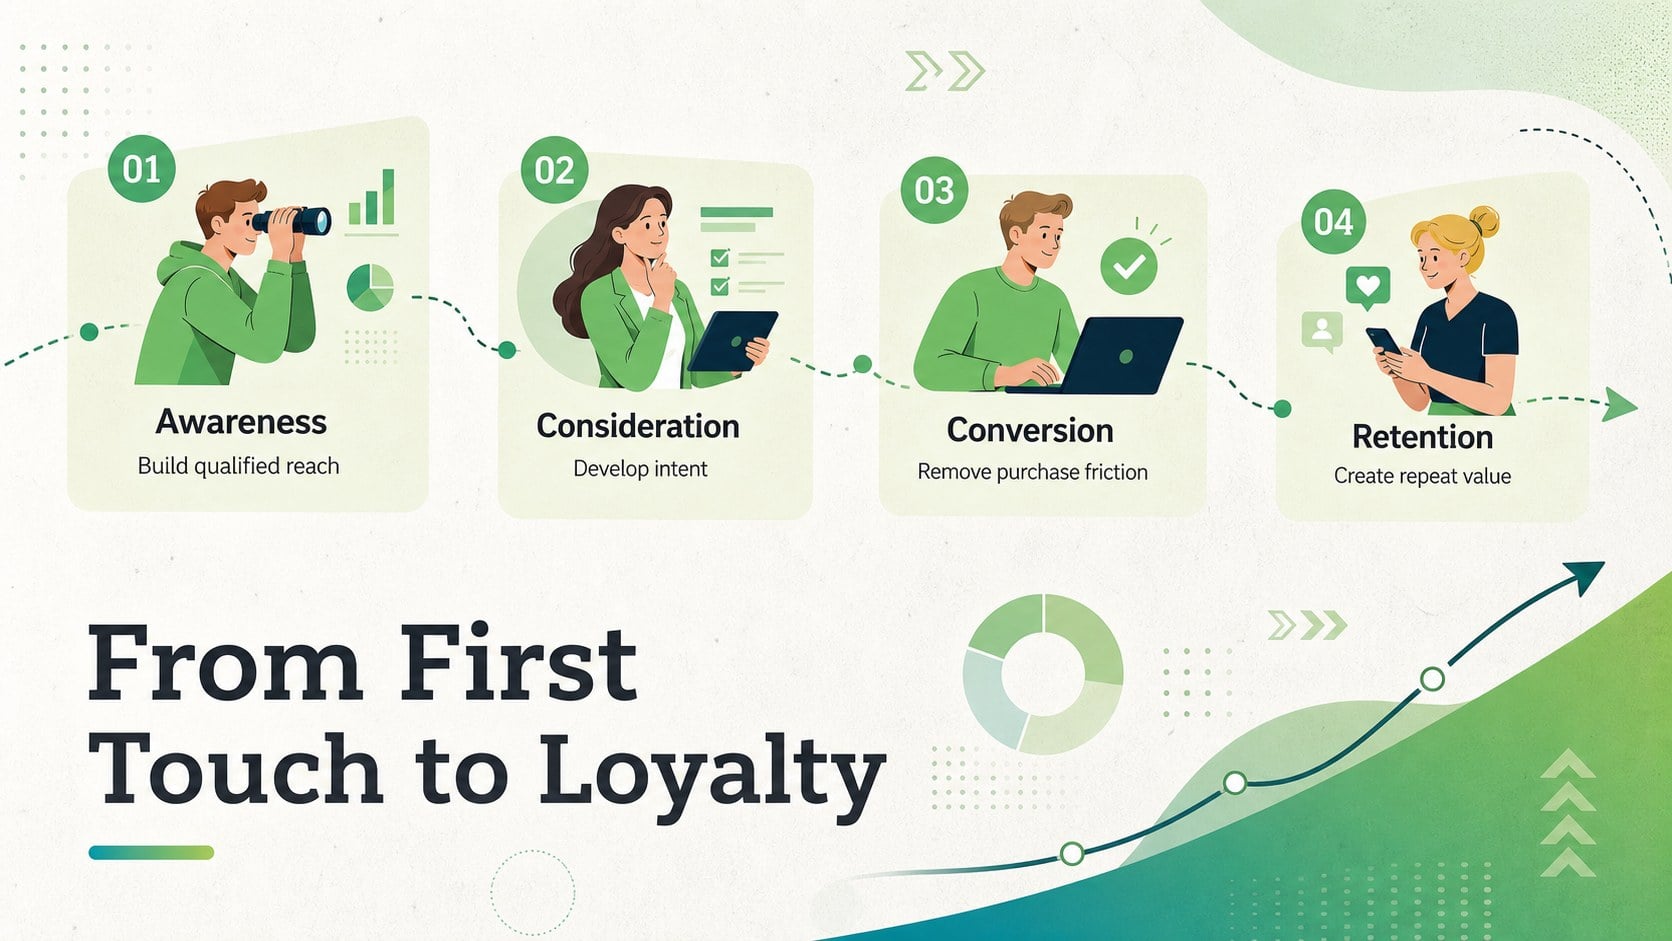
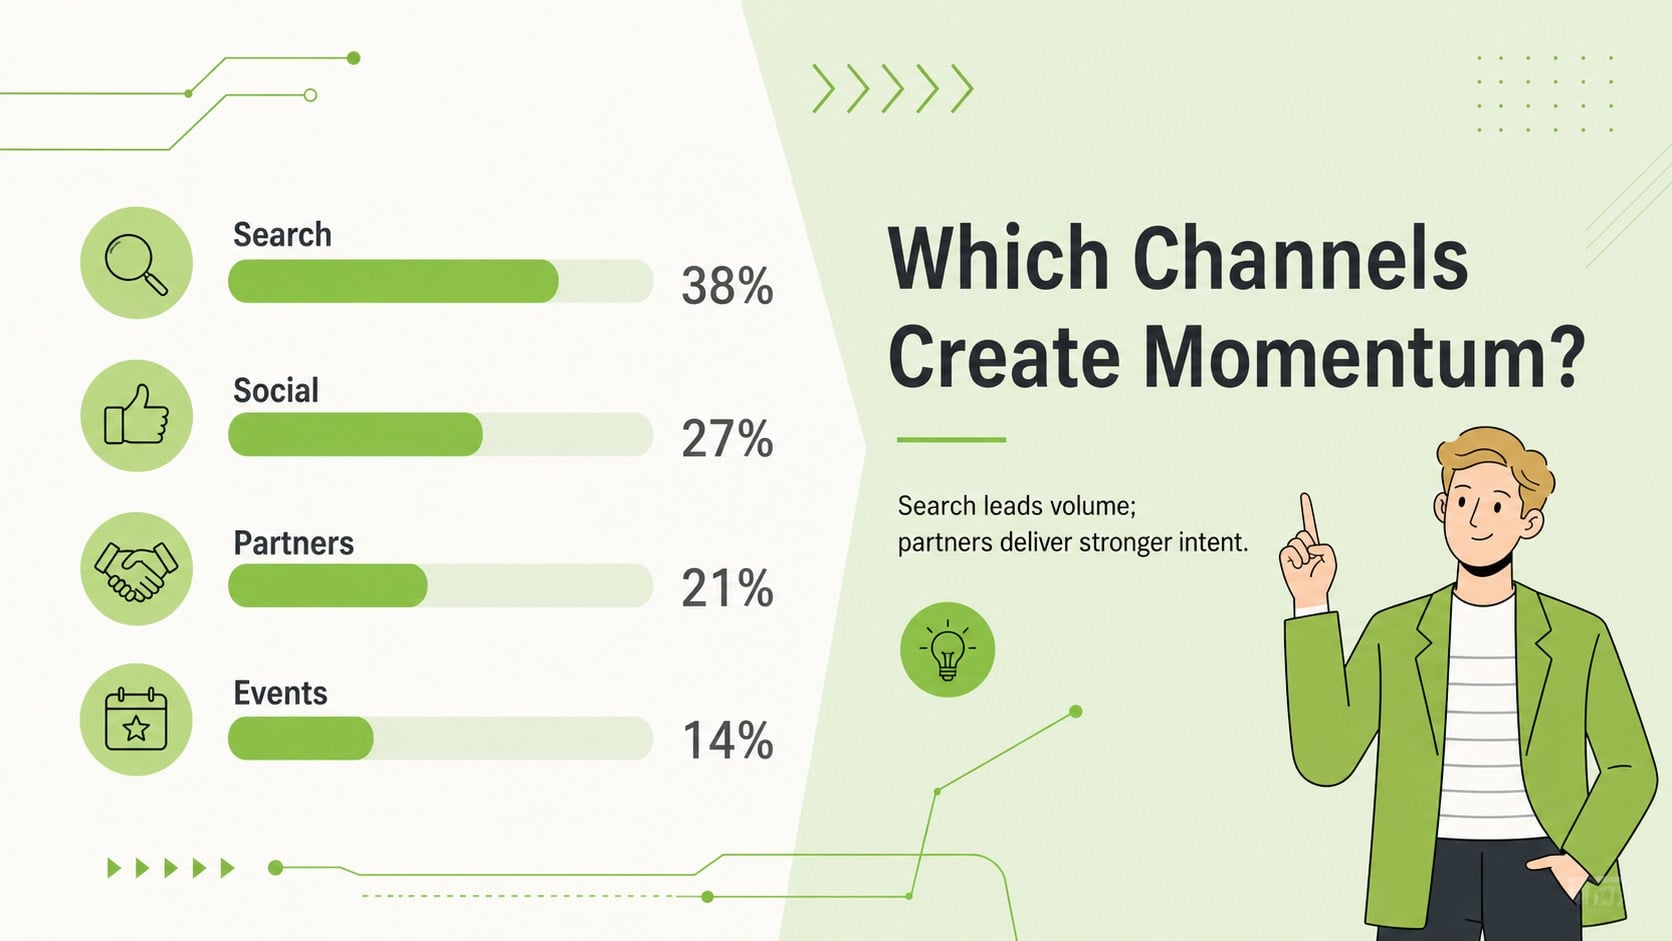
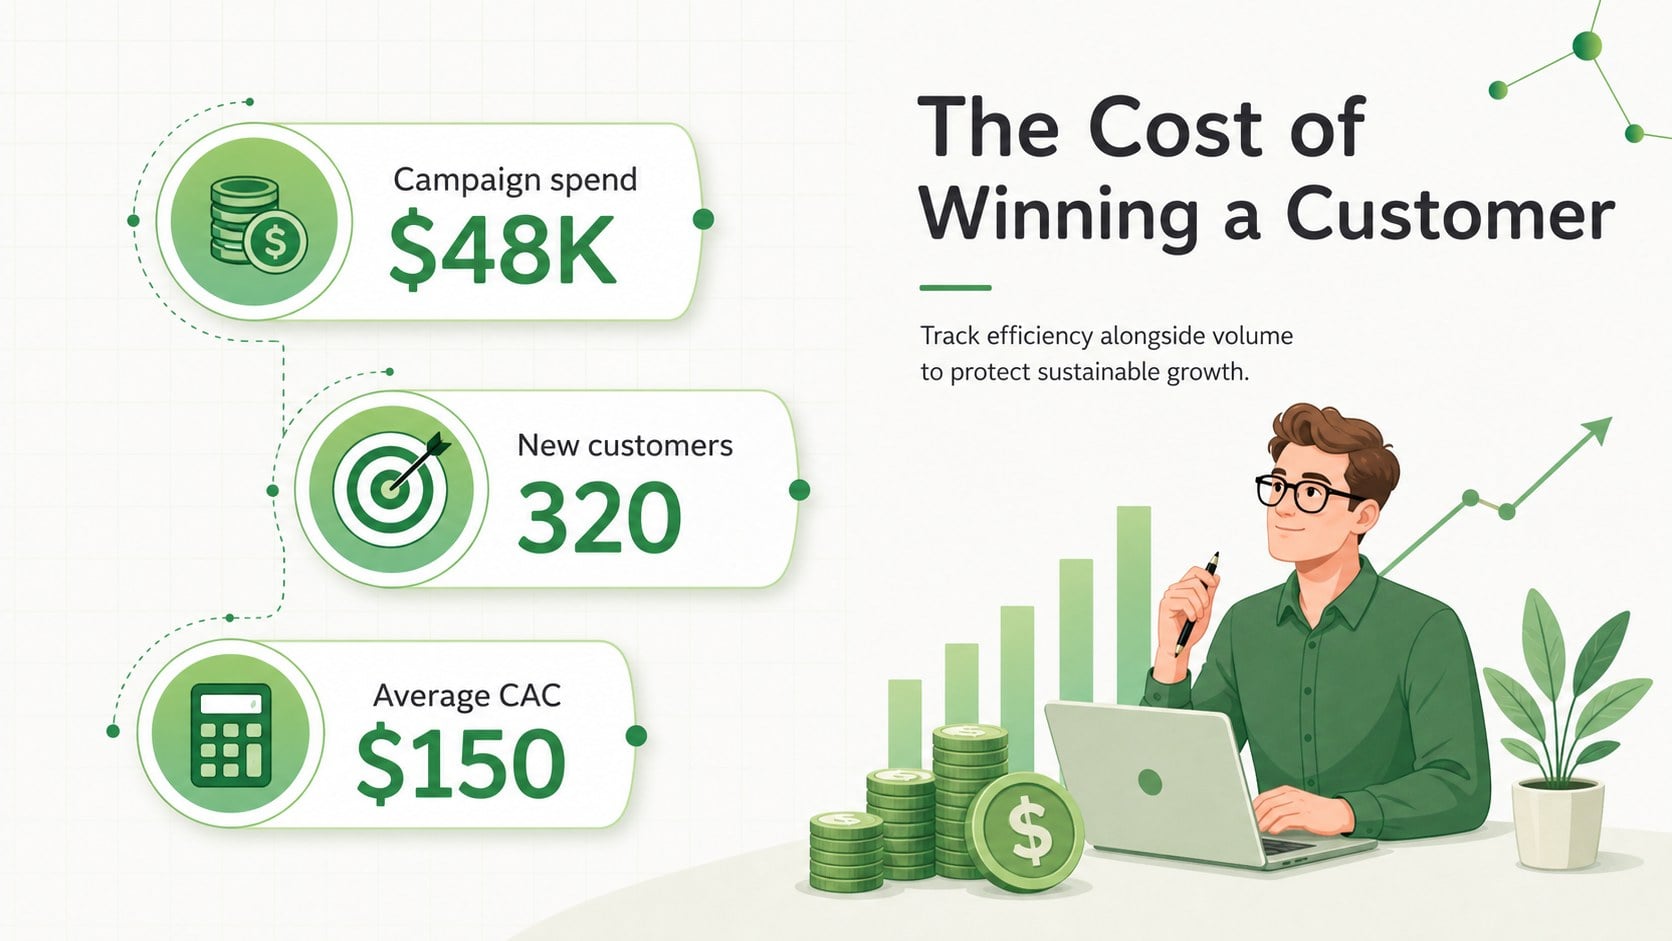
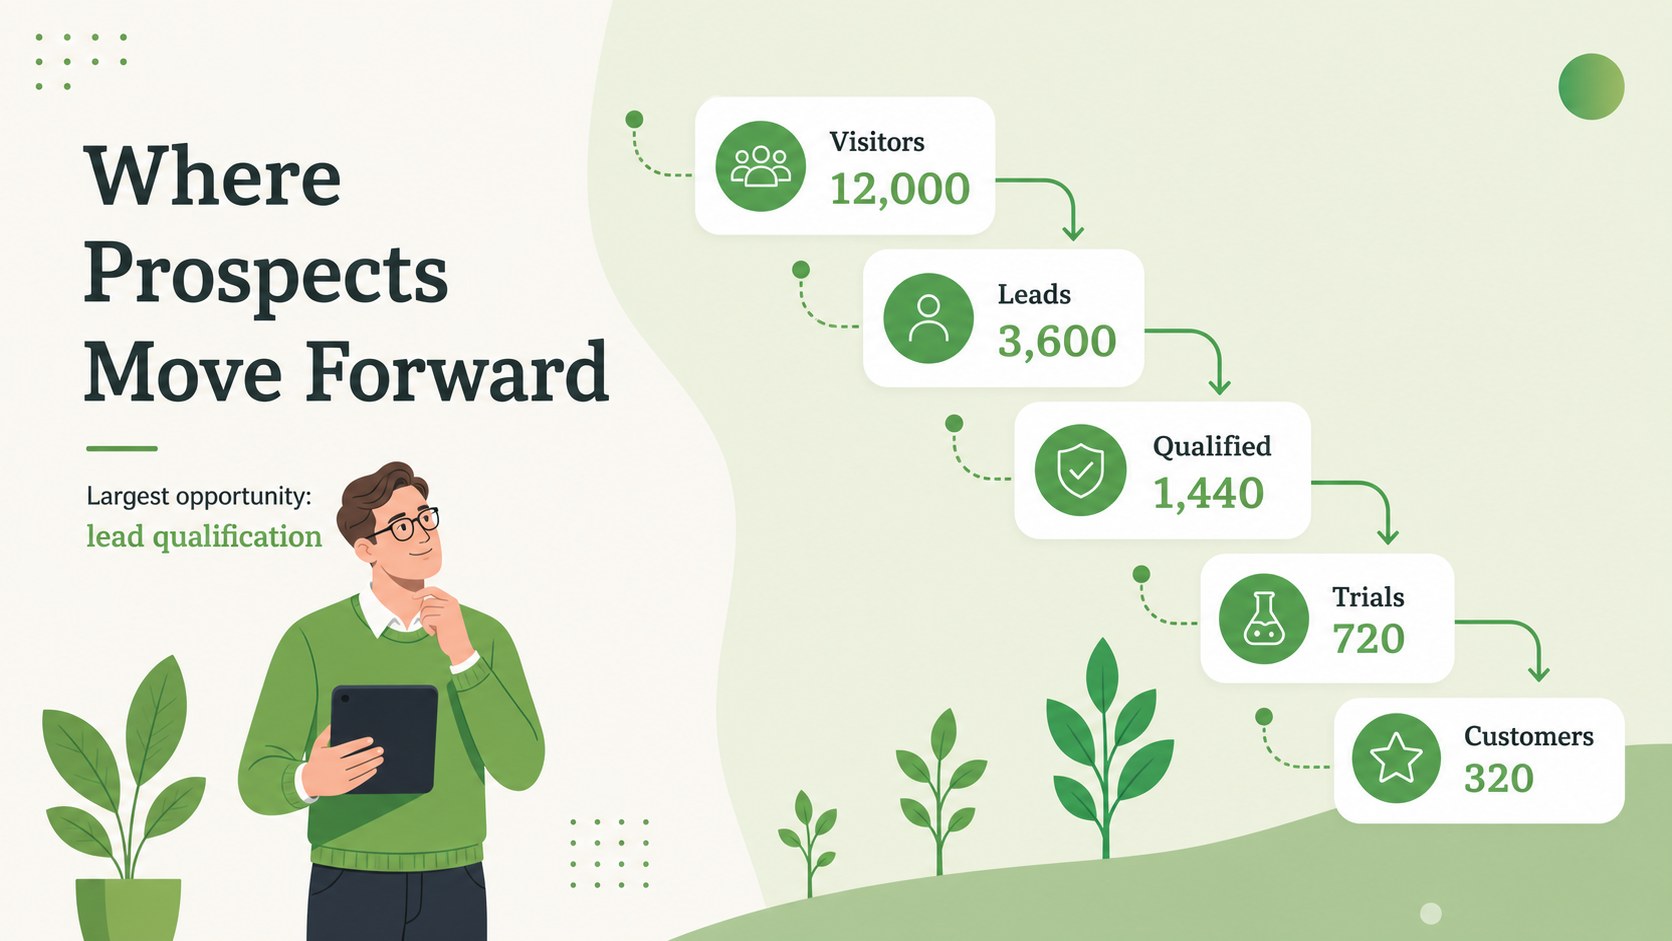
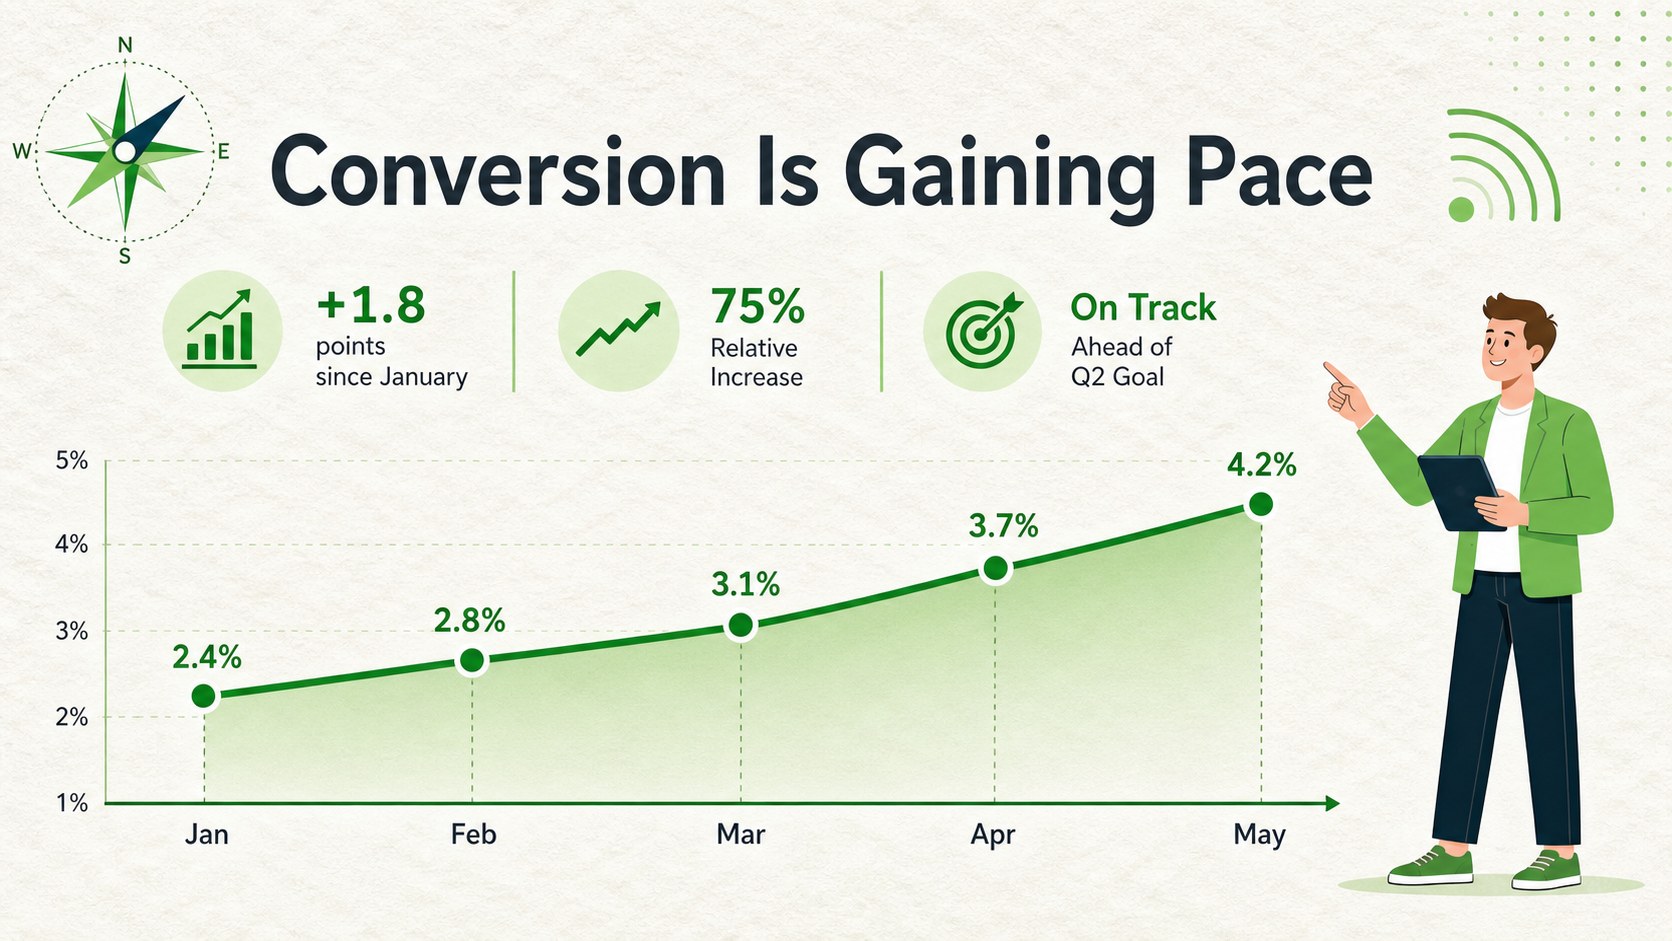
Turn scattered marketing data into a focused growth story with this customer acquisition metrics deck. Its fresh green palette, editorial illustrations, and clean infographic layouts help audiences understand how prospects move from awareness to conversion. Use the slides to connect campaign activity with measurable outcomes without overwhelming stakeholders with dense tables.
Inside, you will find layouts for a customer acquisition funnel presentation, channel comparisons, cost-per-acquisition trends, conversion rates, audience segments, retention signals, and campaign milestones. Editable charts, process diagrams, timelines, and KPI summaries make it easy to replace sample figures with your own results. The varied compositions support both quick executive updates and detailed marketing analysis while maintaining a consistent visual system.
This illustrated marketing analytics presentation is built for growth marketers, startup founders, sales leaders, agencies, and product teams. It works well for quarterly reviews, campaign planning, budget discussions, client reporting, and investor updates. Present a marketing funnel performance report in PowerPoint or Google Slides, customize the wording and data, and adapt the green visual theme to your organization. Every slide is designed for a 16:9 format and provides practical space for concise insights, supporting evidence, and next-step recommendations.
Perfect for: quarterly growth review; campaign performance report; startup investor update; marketing budget meeting; agency client presentation; sales funnel analysis.
Frequently asked questions
Can I edit the charts and acquisition metrics? Yes. Replace the sample figures, labels, colors, and chart values with your own campaign data. The layouts are structured for quick customization without changing the overall visual hierarchy.
Practical details
Yes. Replace the sample figures, labels, colors, and chart values with your own campaign data. The layouts are structured for quick customization without changing the overall visual hierarchy.
The deck is designed for PowerPoint and Google Slides. Minor font or spacing adjustments may be needed when moving between platforms.
Yes. Update the green tones, accent colors, typography, and illustration details through the theme or individual slide controls. Keep sufficient contrast between text, charts, and backgrounds for readability.
Use concise funnel totals, conversion rates, acquisition costs, channel results, retention indicators, and campaign milestones. Short annotations can explain changes, assumptions, or recommended actions.
Keep exploring
15Build an engaging World UFO Day session with this flying saucer history lesson deck, featuring retro green-and-brown slides for PowerPoint and Google Slides.
 15
Plan a lively animal-learning journey with this jungle zoo adventure lesson deck, ready to customize in PowerPoint and Google Slides for young learners.
 16
Turn environmental research into a clear story with a Watercolor Ecology Presentation Theme for PowerPoint and Google Slides in calming green and blue.
 16
Build focused fashion, literature, and humanities presentations with the Red Triangle Editorial Theme, editable in PowerPoint and Google Slides.
 15
Turn streaming stats, favorite tracks, and concert highlights into a bold annual listening recap slide deck for PowerPoint and Google Slides.
 15
Turn highlights, milestones, and favorite moments into a colorful year in review slide deck with bold 3D graphics for PowerPoint and Google Slides.
 3
Build a credible endorsement with Standout Colleague Recommendation Letter Slides, featuring colorful prompts for skills, achievements, and team impact.
 4
Build clear beginner sessions with an ice hockey fundamentals training deck for coaches, PE teachers, and clubs, ready for PowerPoint and Google Slides.