
 15
15presentation
Flying Saucer History Lesson Deck
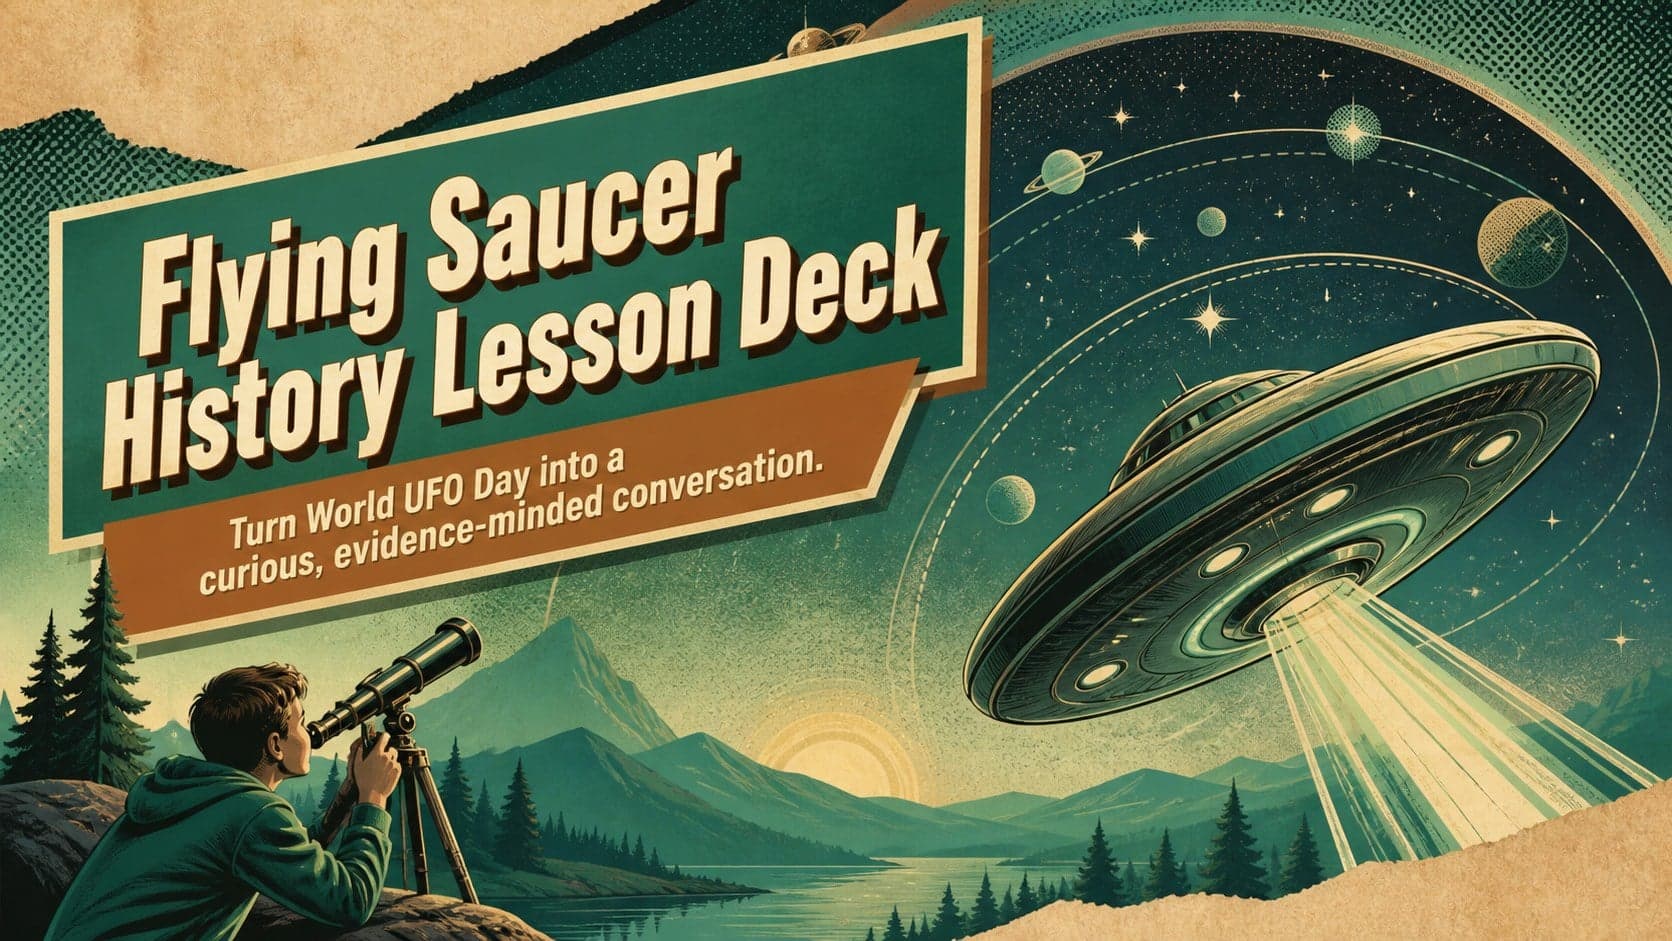
Build an engaging World UFO Day session with this flying saucer history lesson deck, featuring retro green-and-brown slides for PowerPoint and Google Slides.
Google SlidesPowerPoint
presentation · English
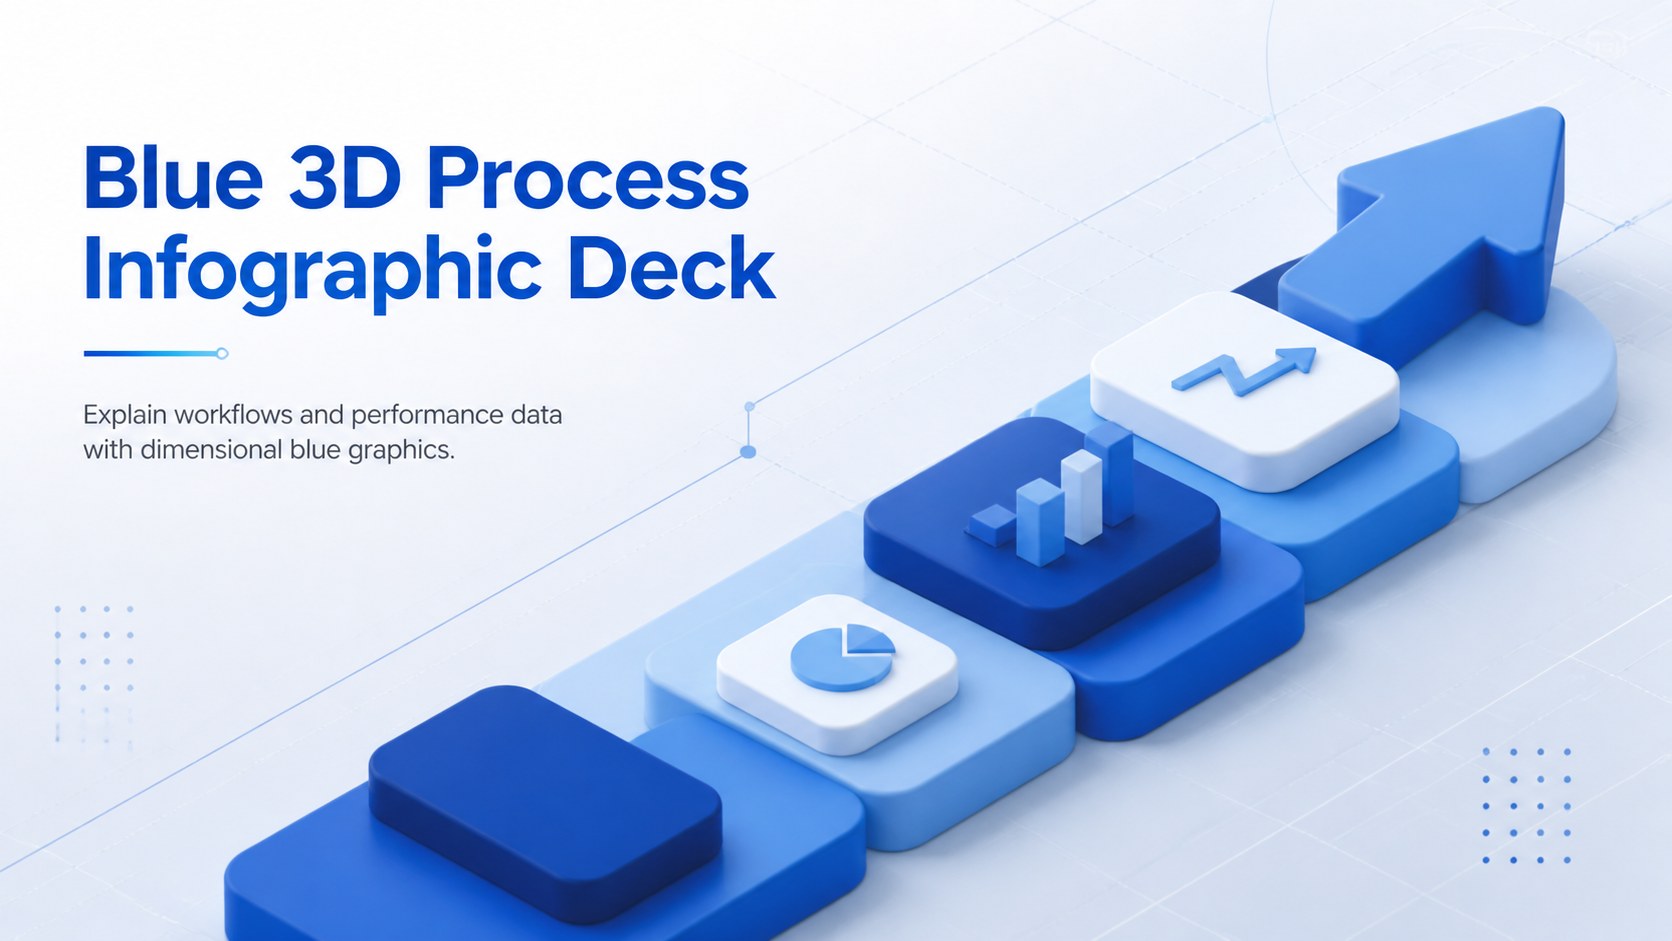
Turn workflows and metrics into polished visuals with a Blue 3D Process Infographic Deck for editable PowerPoint and Google Slides projects.
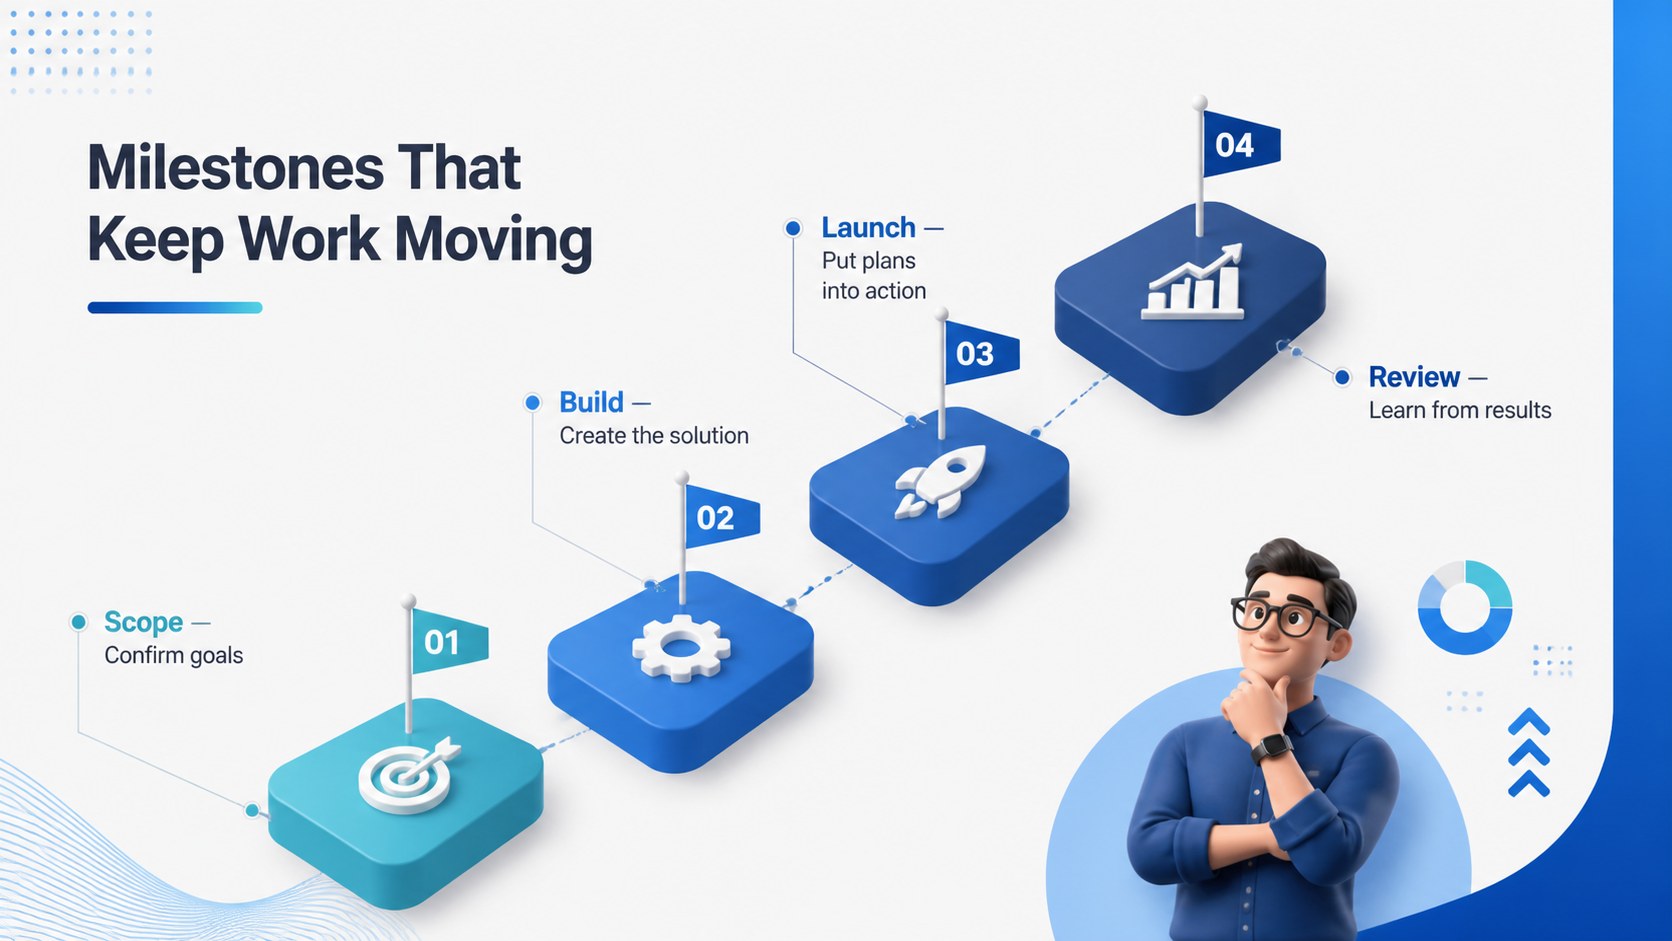
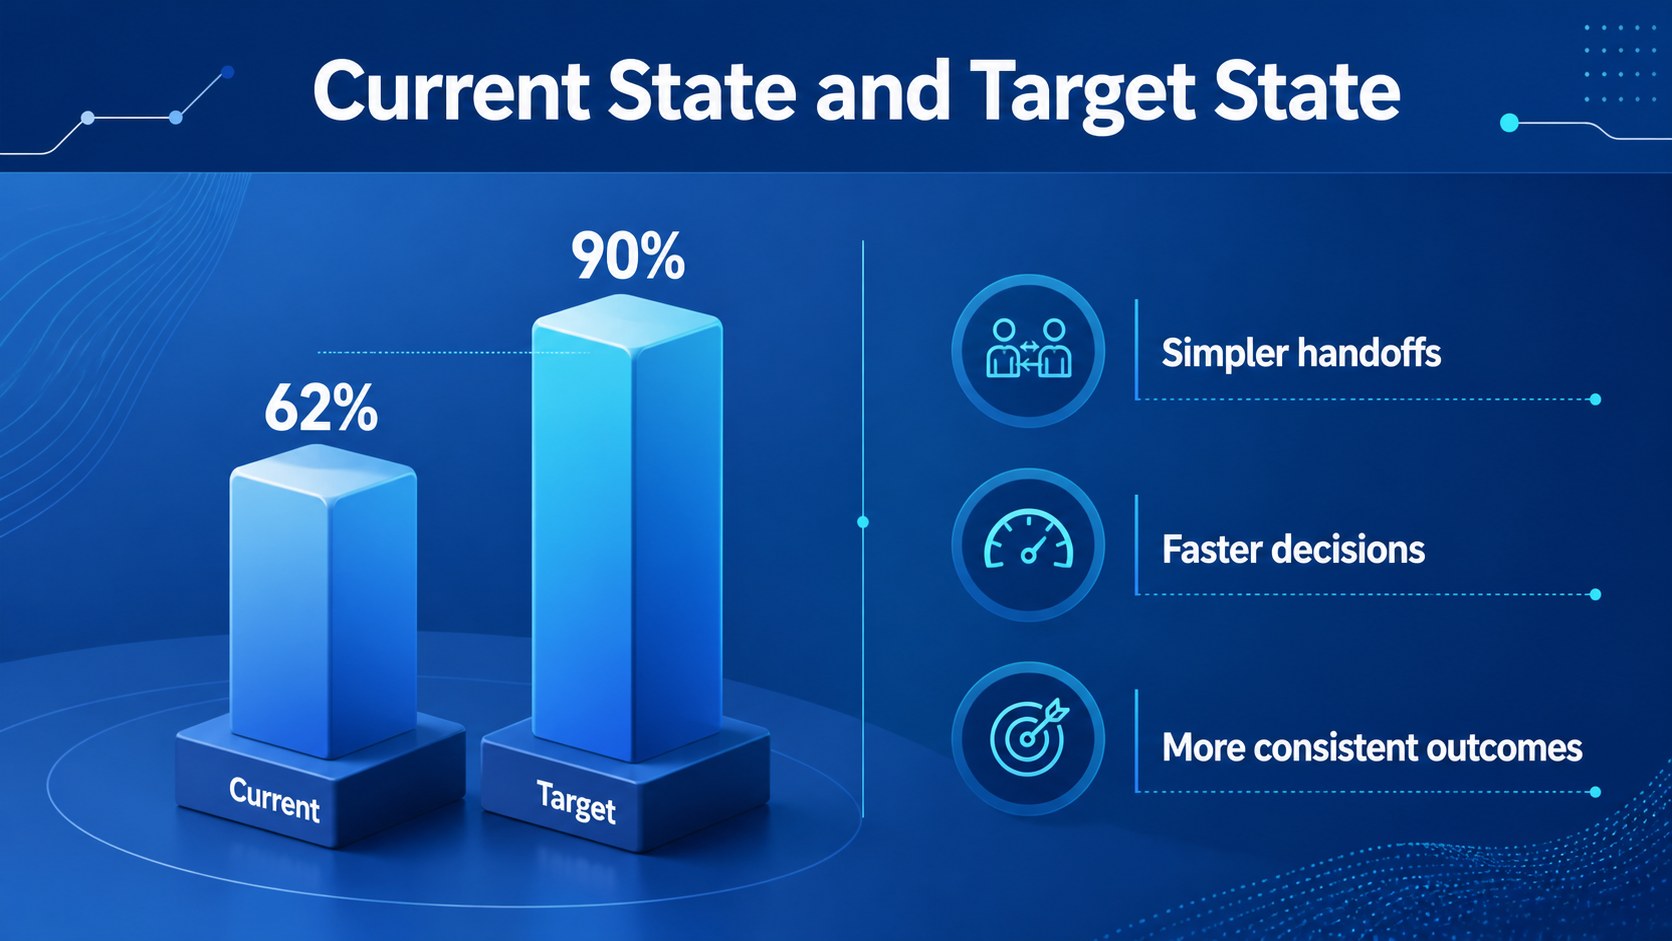
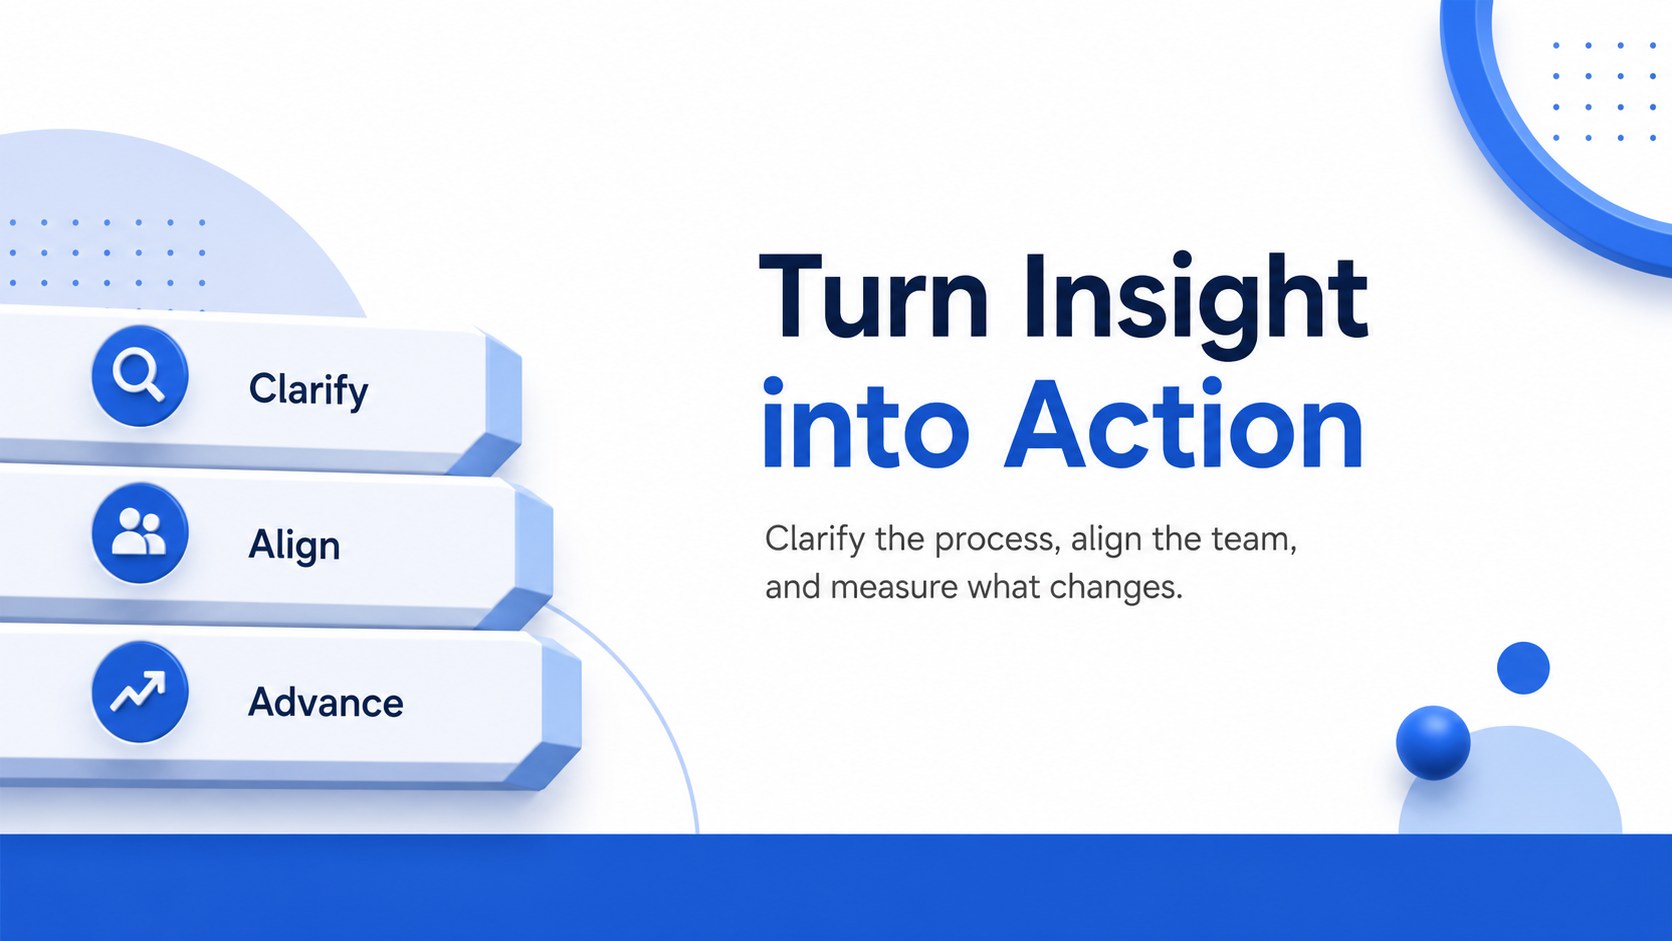
Design notes
The Blue 3D Process Infographic Deck turns workflows, milestones, comparisons, and performance figures into clear visual stories. Its clean blue palette, spacious layouts, and dimensional geometric elements give business or academic information a polished appearance without making slides feel crowded.
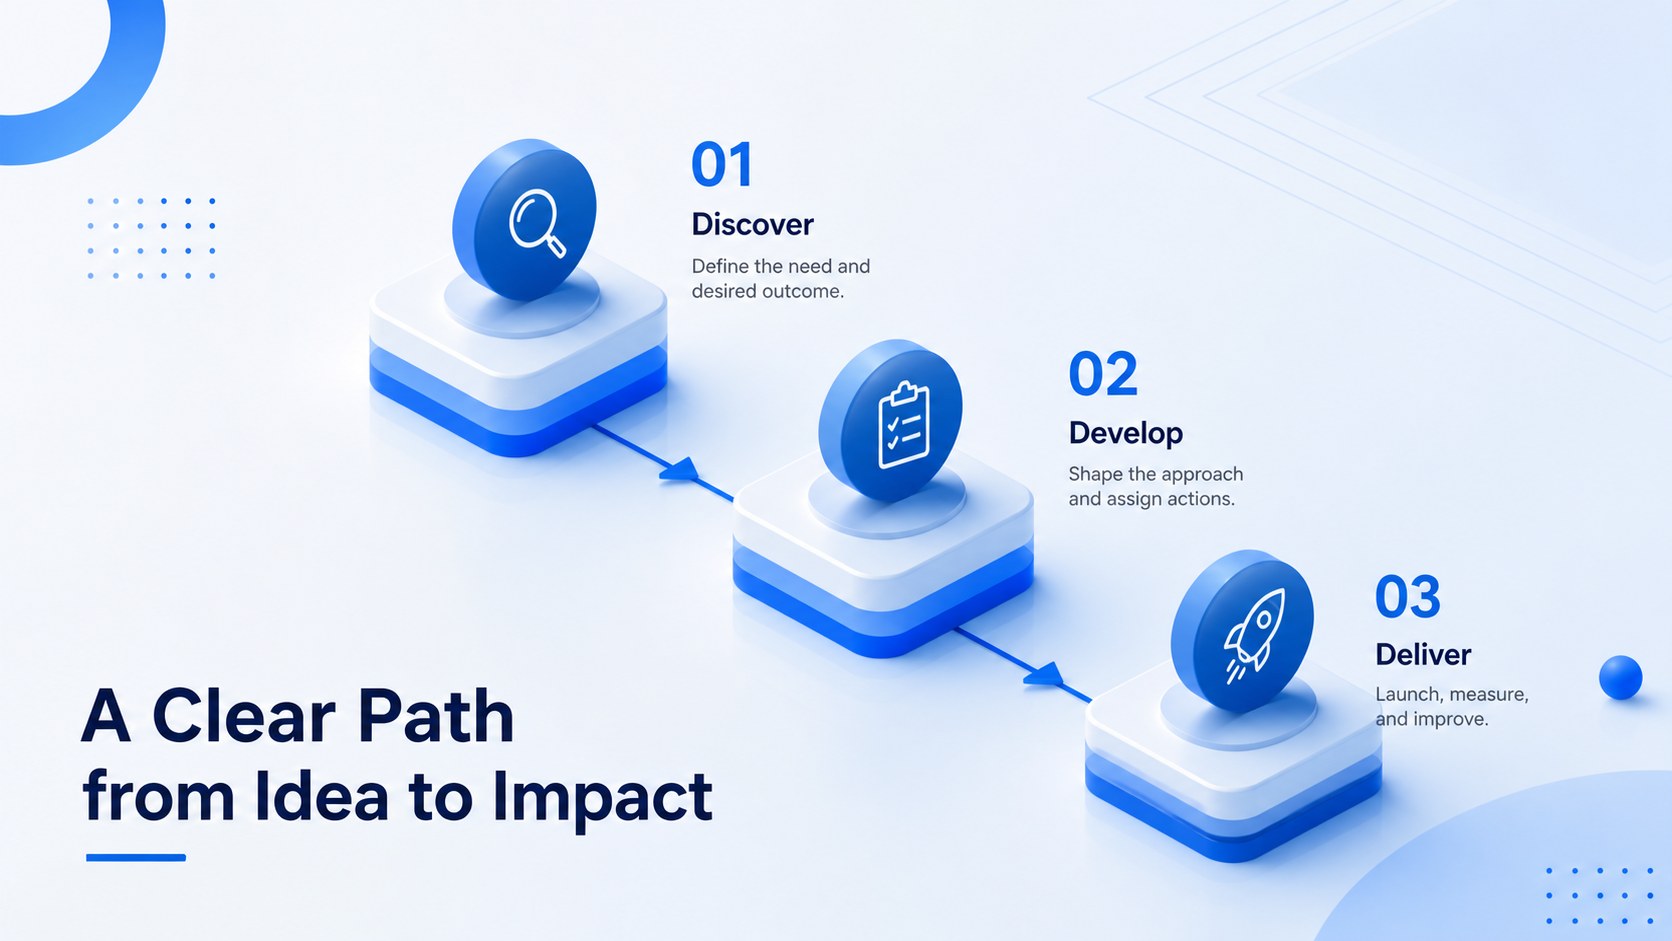
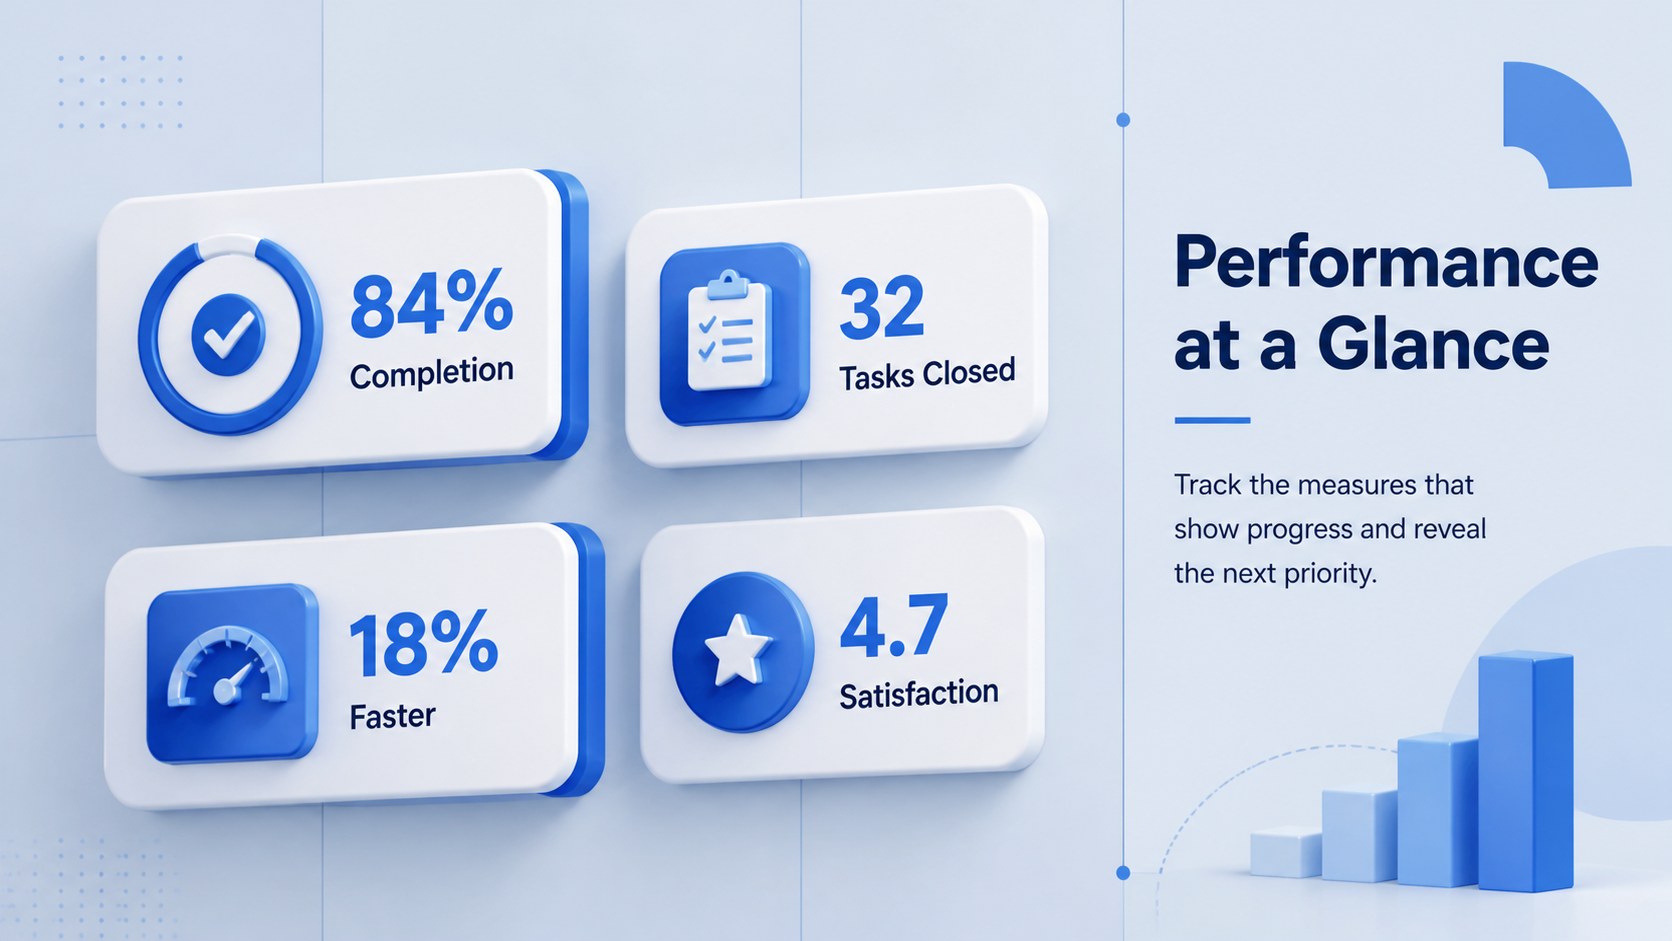
Inside are six coordinated layouts for an opening statement, a three-stage workflow, KPI highlights, a milestone roadmap, a category comparison, and a concise closing summary. Each slide provides editable text areas, reusable shapes, and organized visual hierarchy. Use the deck as an editable 3D process diagram template or adapt individual pages into a blue workflow infographic presentation for reports and project updates.
The design suits managers, consultants, analysts, educators, and students who need to communicate structured information quickly. It works particularly well for strategy meetings, operational reviews, classroom explanations, client proposals, and internal training. The minimalist business data visualization slides help audiences follow relationships and sequences while keeping the main message prominent.
Customize the wording, values, colors, and arrangement in PowerPoint or Google Slides. Replace sample metrics with real results, reorder the process stages, or extend the roadmap for a longer initiative. The consistent visual system makes it straightforward to combine several layouts into one cohesive presentation.
Perfect for: quarterly KPI review; project workflow briefing; client process proposal; classroom concept lesson; product roadmap meeting.
Frequently asked questions
Practical details
Yes. The text, colors, values, and supporting shapes can be adjusted to match your information and visual identity. Individual elements can also be moved, duplicated, or removed as needed.
The layouts are intended for PowerPoint and Google Slides. Minor differences in fonts, shadows, or transitions may appear when moving the presentation between platforms.
Yes. Replace the blue shades with brand colors while preserving enough contrast between the dimensional layers, labels, and background. Applying a small set of coordinated colors will keep the deck visually consistent.
The slides are suited to workflows, KPI summaries, timelines, comparisons, milestones, and short strategic frameworks. Keep labels concise and use one main message per layout for the clearest result.
Keep exploring
15Build an engaging World UFO Day session with this flying saucer history lesson deck, featuring retro green-and-brown slides for PowerPoint and Google Slides.
 15
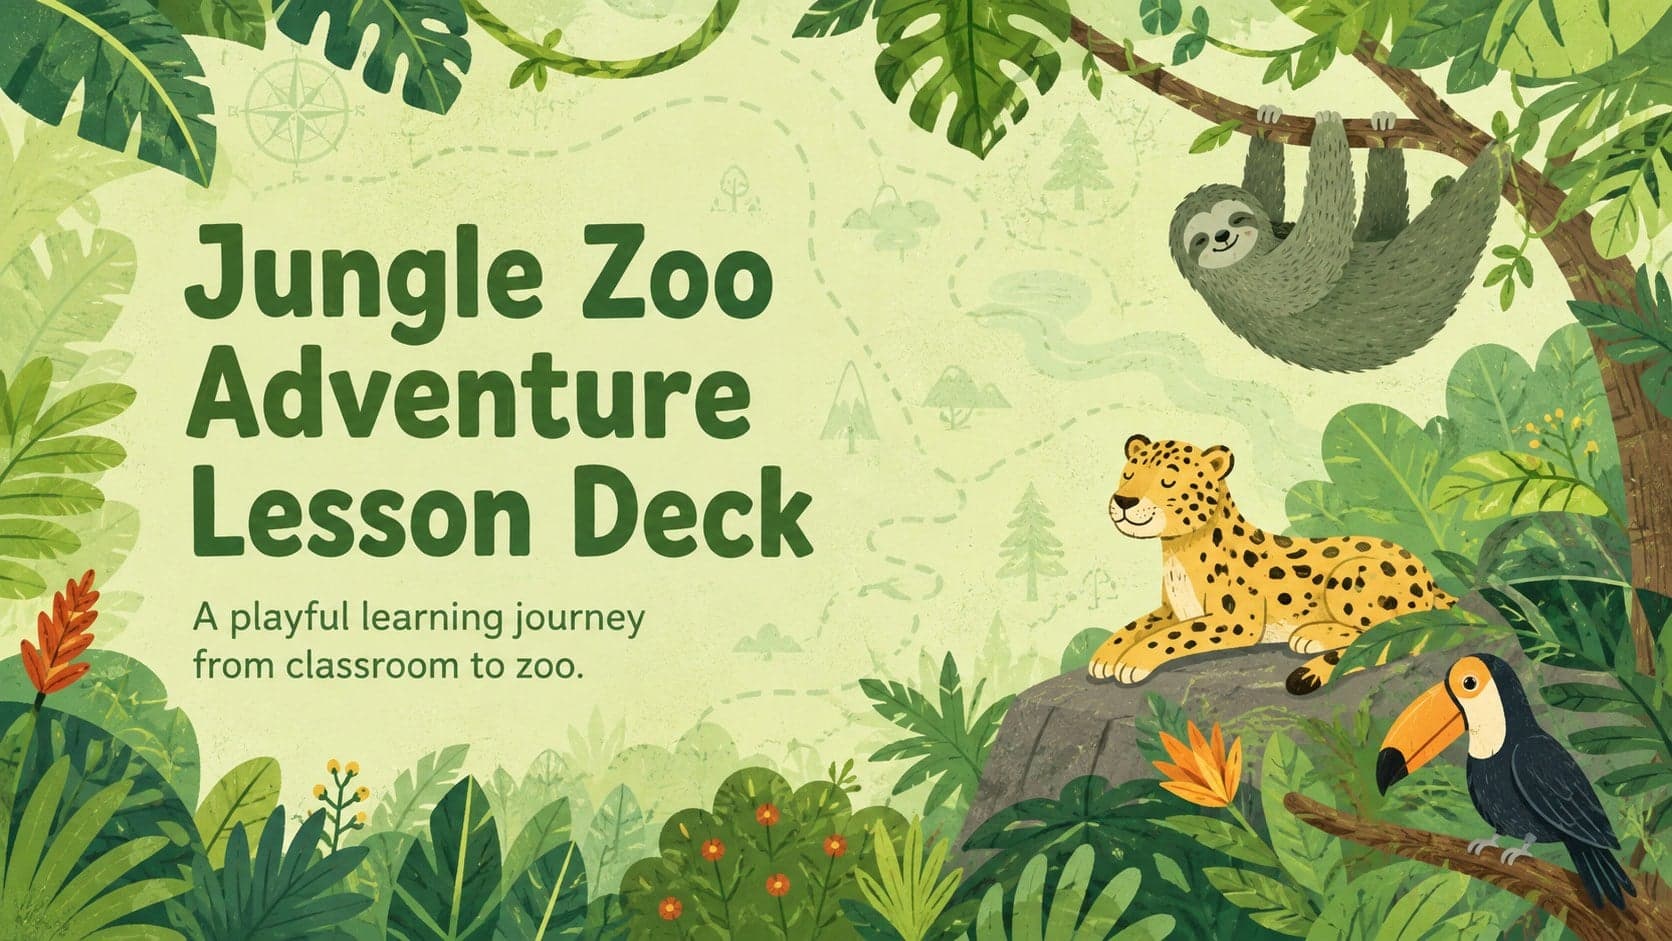
15Plan a lively animal-learning journey with this jungle zoo adventure lesson deck, ready to customize in PowerPoint and Google Slides for young learners.
 16
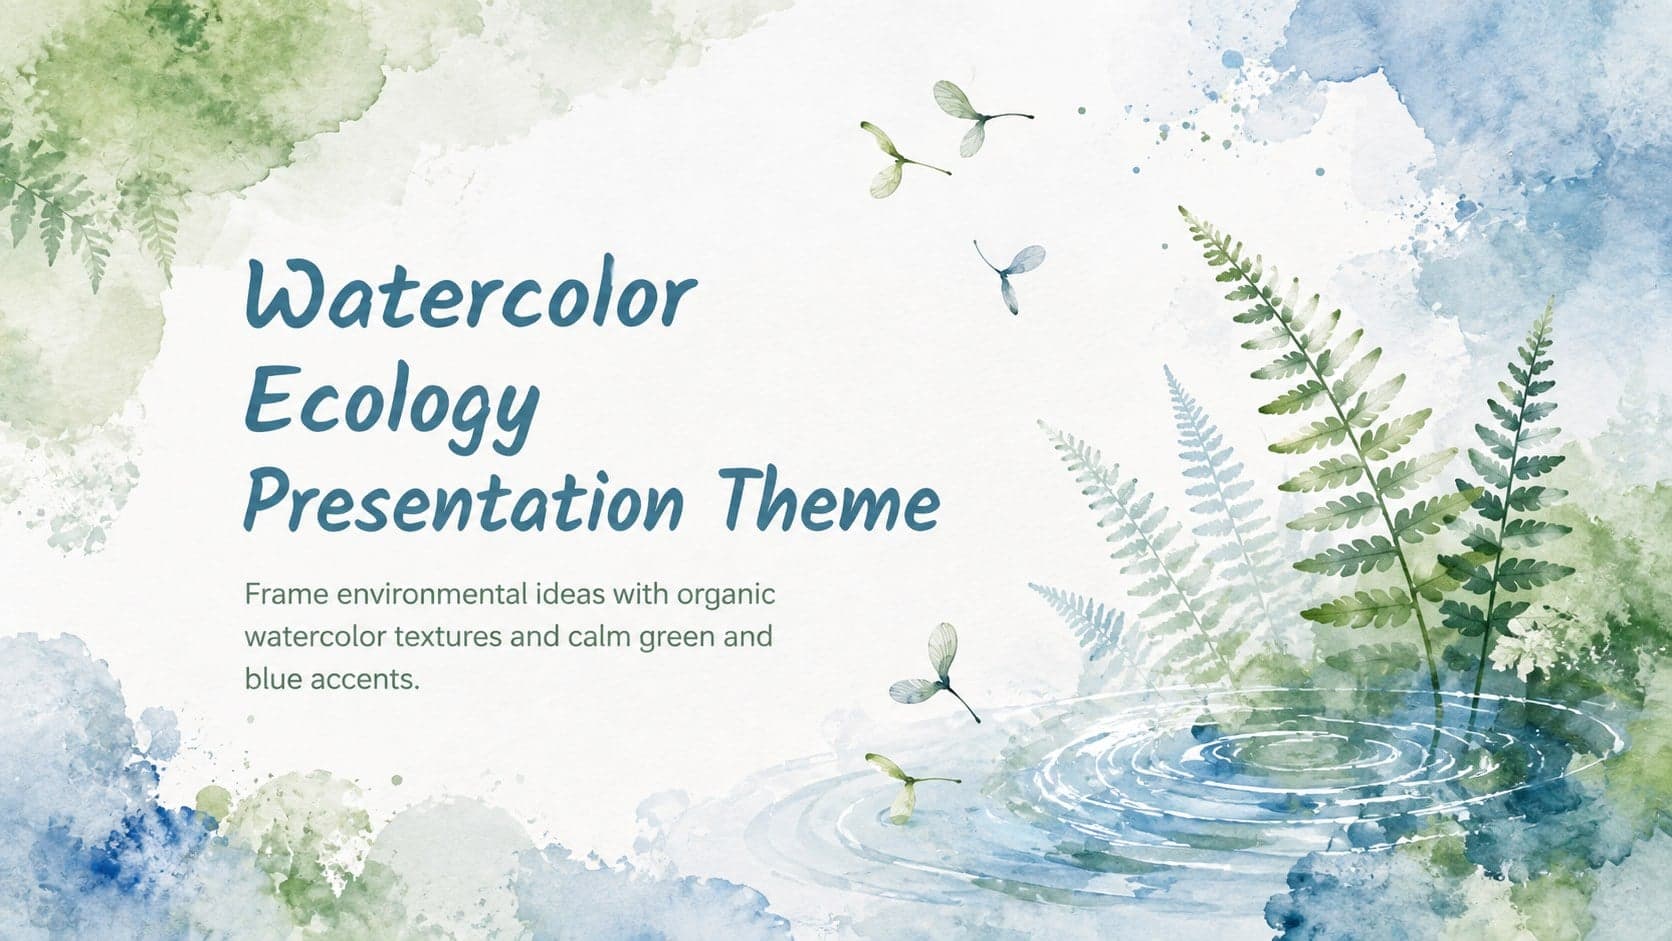
16Turn environmental research into a clear story with a Watercolor Ecology Presentation Theme for PowerPoint and Google Slides in calming green and blue.
 16
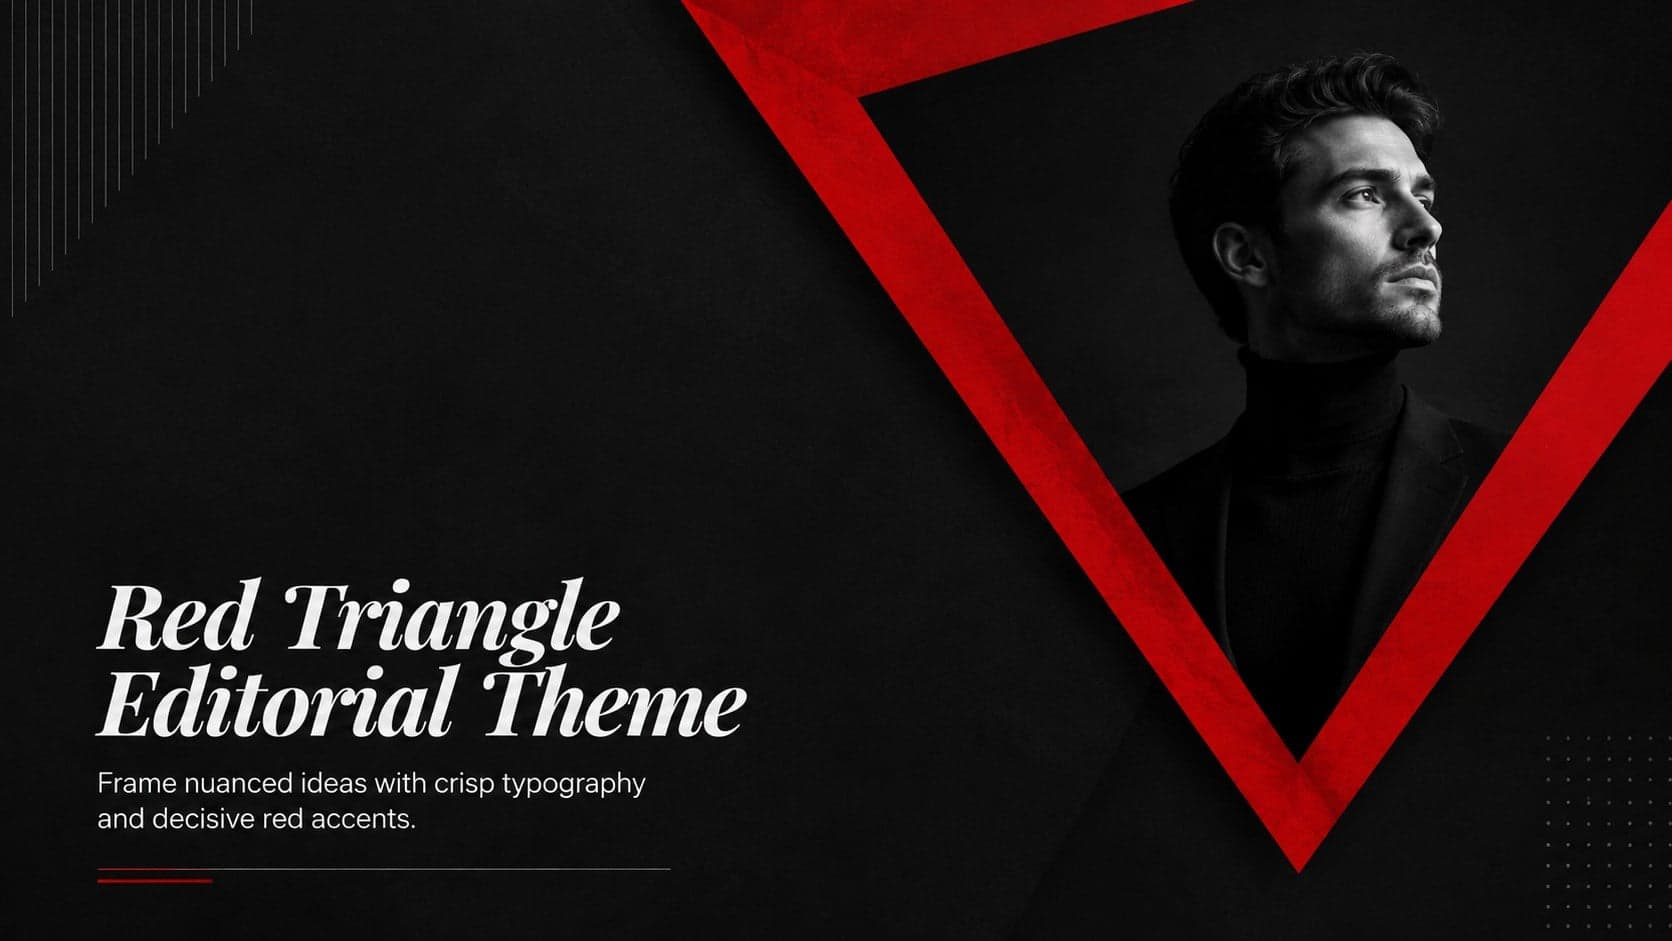
16Build focused fashion, literature, and humanities presentations with the Red Triangle Editorial Theme, editable in PowerPoint and Google Slides.
 15
15Turn streaming stats, favorite tracks, and concert highlights into a bold annual listening recap slide deck for PowerPoint and Google Slides.
 15
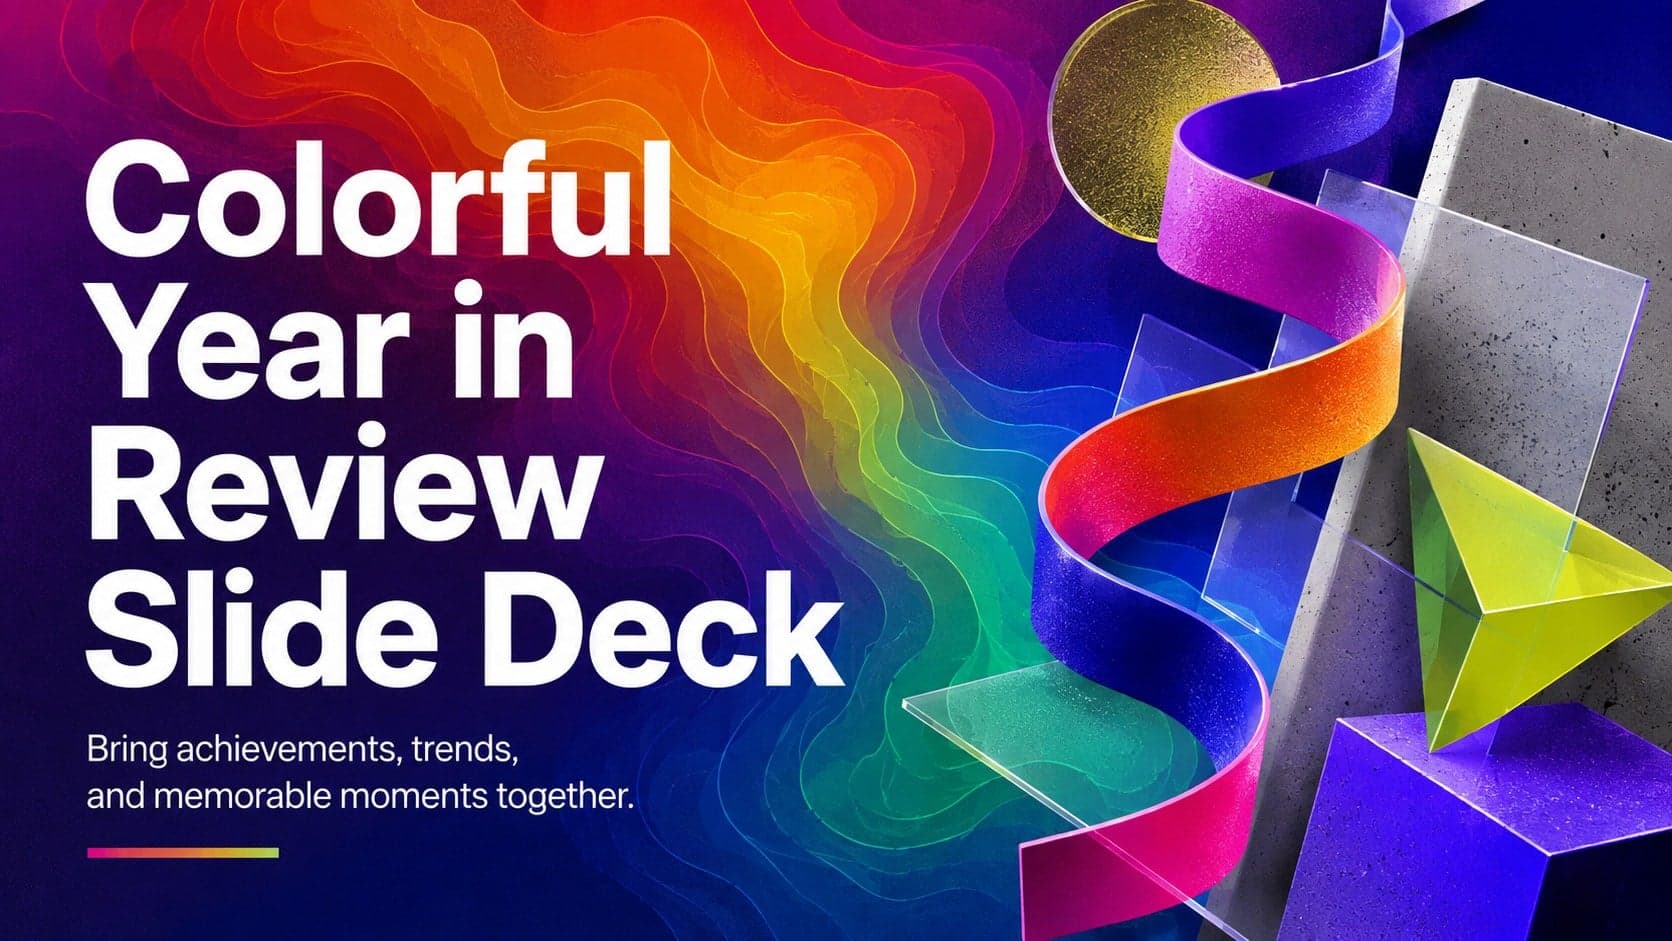
15Turn highlights, milestones, and favorite moments into a colorful year in review slide deck with bold 3D graphics for PowerPoint and Google Slides.
 3
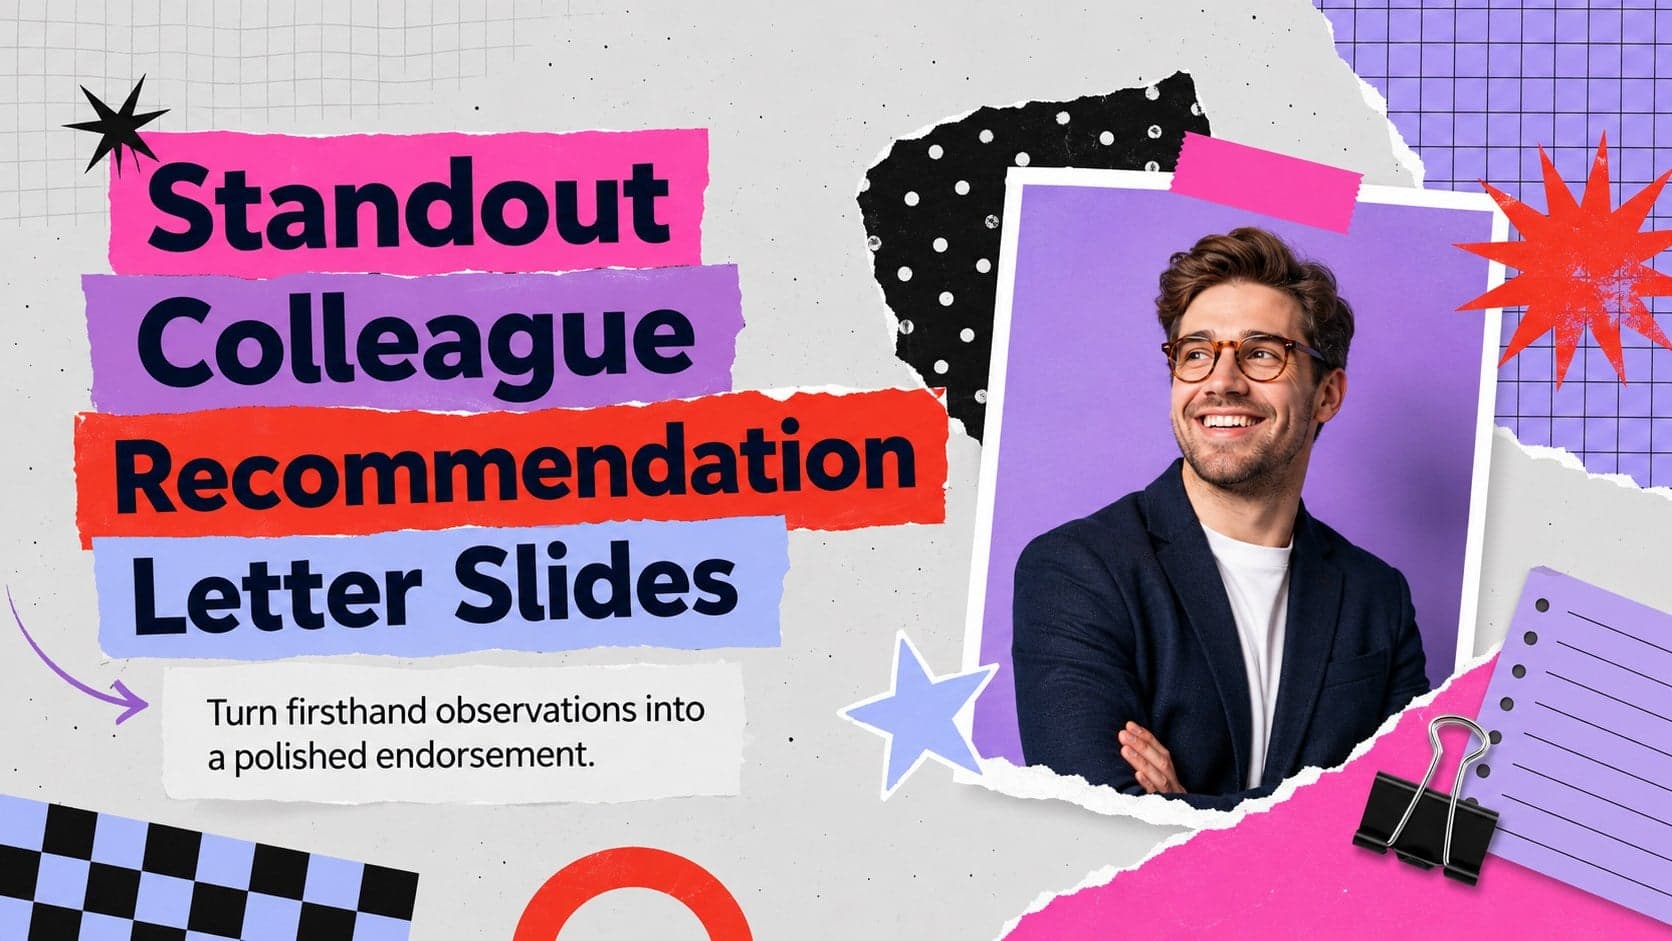
3Build a credible endorsement with Standout Colleague Recommendation Letter Slides, featuring colorful prompts for skills, achievements, and team impact.
 4
4Build clear beginner sessions with an ice hockey fundamentals training deck for coaches, PE teachers, and clubs, ready for PowerPoint and Google Slides.