
 15
15presentation
Flying Saucer History Lesson Deck
Build an engaging World UFO Day session with this flying saucer history lesson deck, featuring retro green-and-brown slides for PowerPoint and Google Slides.
Google SlidesPowerPoint
presentation · English
Build a sharp basketball game stat tracker with bold black-and-white visuals for coaches, fans, and tournament recaps. Edit every slide free.
Design notes
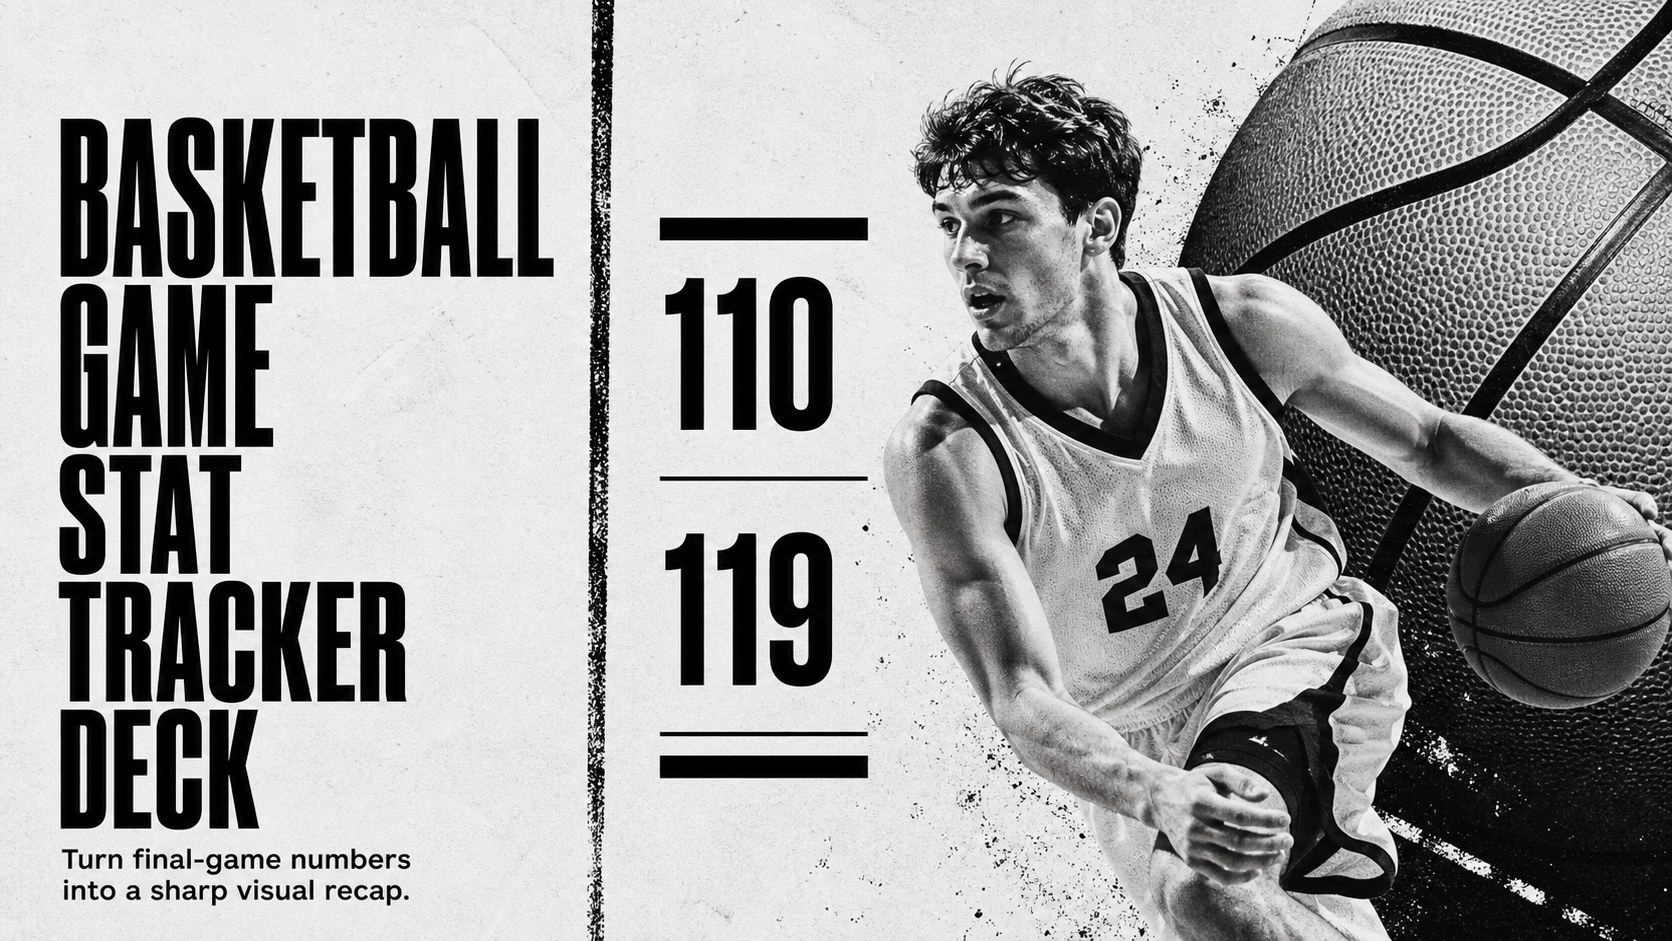
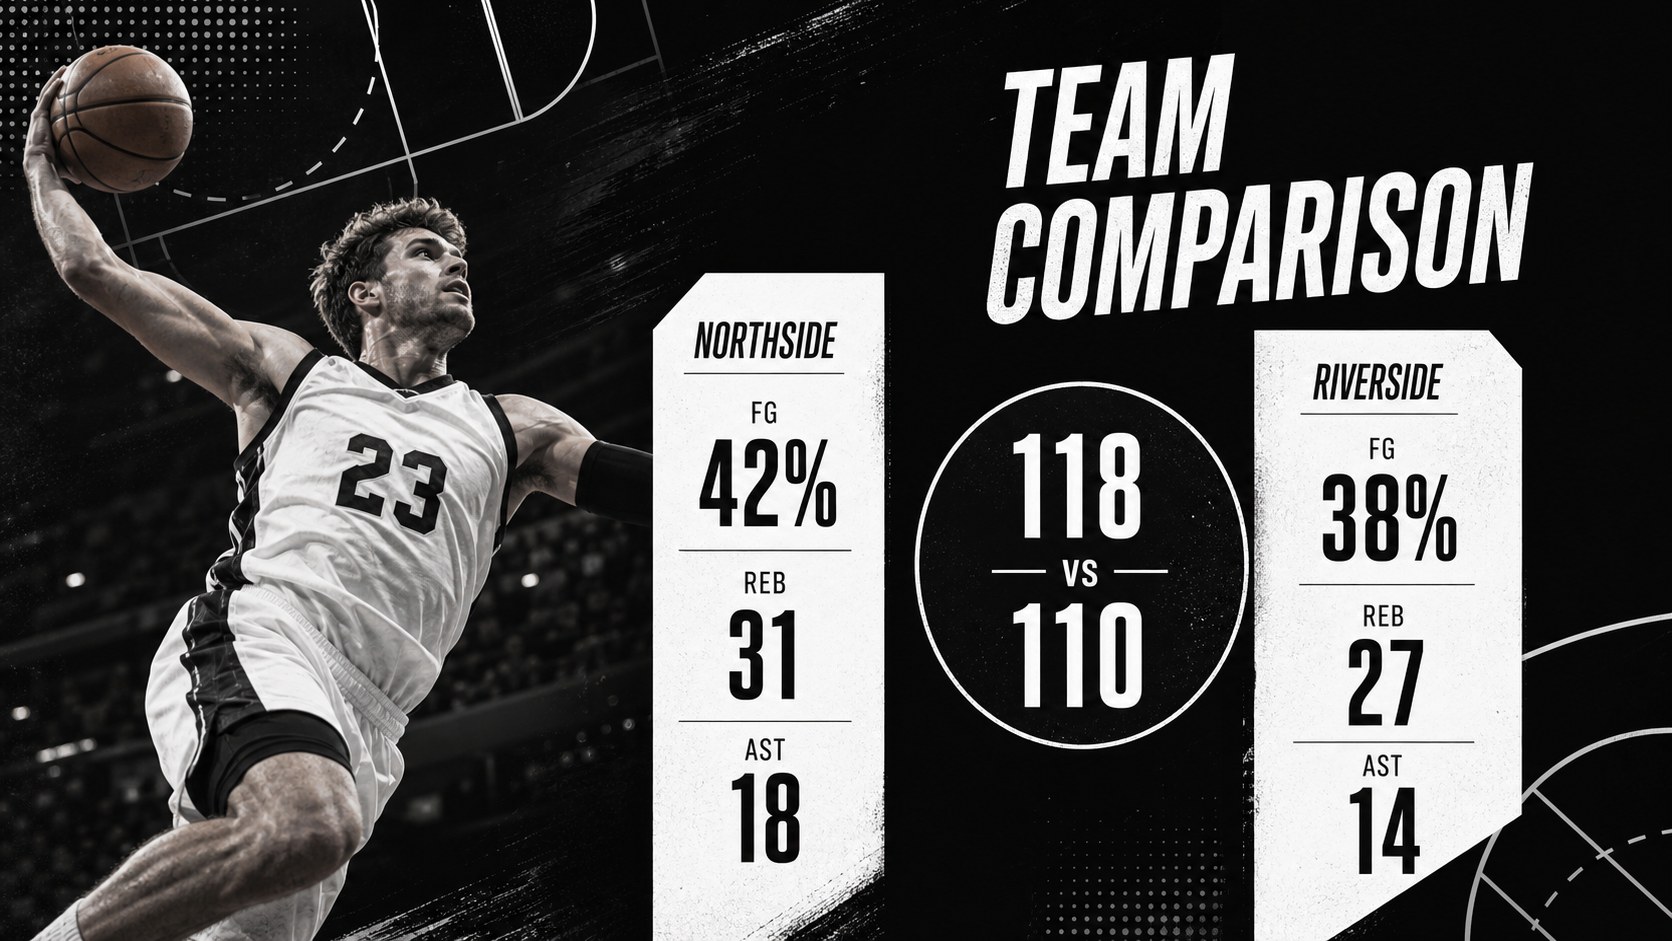
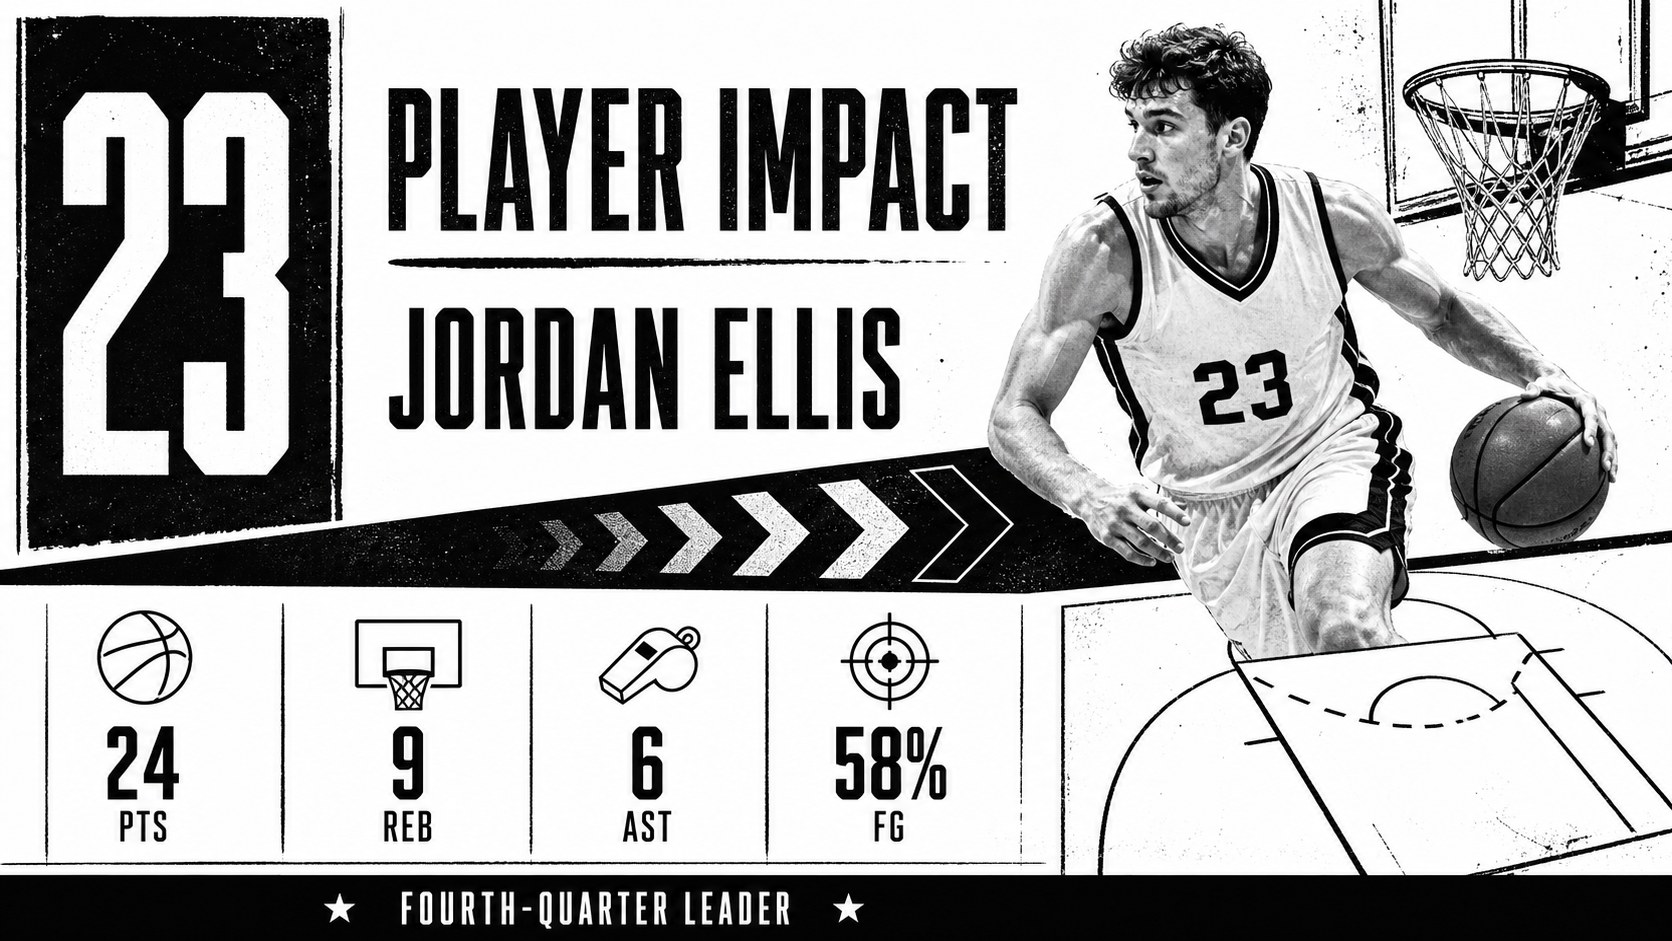
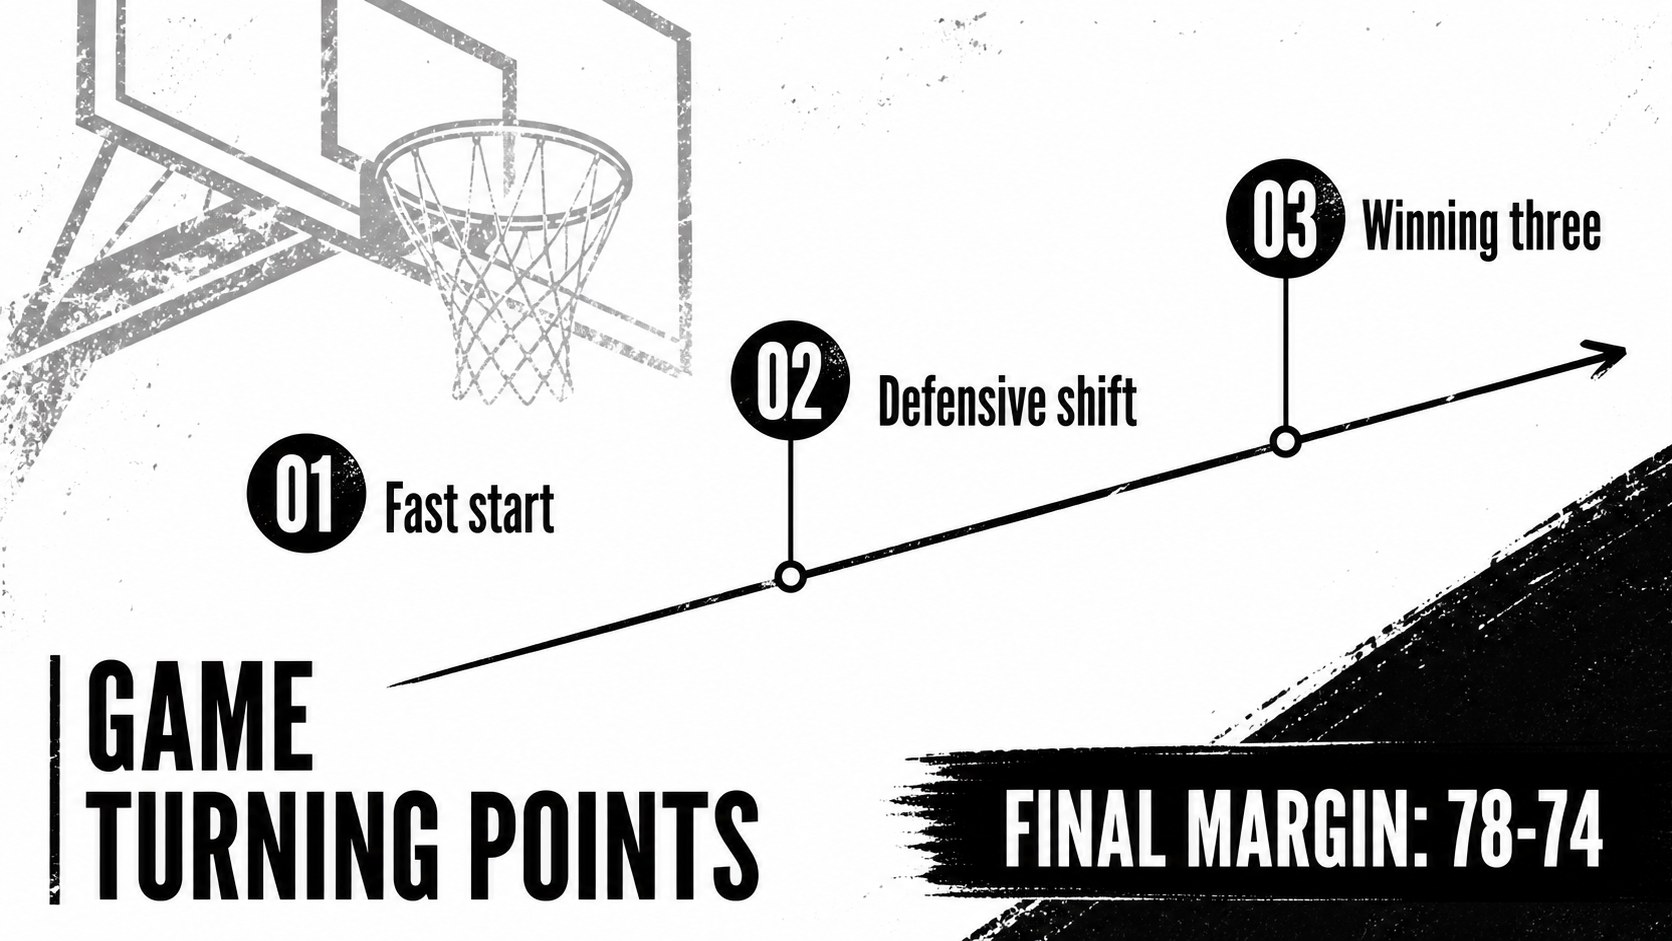
Turn final-game numbers into a sharp visual recap for the people who follow every possession. This basketball game stat tracker combines a white-and-black palette with restrained grunge textures, bold display type, and clean infographic structures that keep scores and performance details easy to scan.
Inside, you will find four customizable A4 infographic layouts for a final score, team comparison, player performance statistics presentation, and memorable game moments. Add field goals, rebounds, assists, fouls, shooting percentages, quarter-by-quarter results, or short notes about the turning point of the match. The layouts can also be adapted into basketball tournament recap slides for newsletters, social posts, locker-room reviews, or event screens.
The deck is designed for coaches, athletic departments, tournament organizers, sports journalists, school teams, and dedicated fans. Edit text, colors, charts, images, and typography, then export the finished work for PowerPoint, Google Slides, PDF, or online sharing. It uses Bebas Neue and League Gothic to create a strong scoreboard-inspired hierarchy while keeping the overall presentation modern and uncluttered.
Perfect for: post-game team review; basketball tournament recap; school athletics newsletter; coach performance briefing; sports social media update.
Frequently asked questions
Can I edit the basketball statistics? Yes. Open the template to replace scores, player names, charts, labels, colors, and images using the drag-and-drop editor. The layouts are structured so you can update game data without rebuilding the design.
Practical details
Yes. Open the template to replace scores, player names, charts, labels, colors, and images using the drag-and-drop editor. The layouts are structured so you can update game data without rebuilding the design.
Yes. After editing, use the Share menu to export a PPTX file or send an editable copy to Google Drive for Google Slides. PDF and image exports are also available for reports and social media.
Use the layouts for final scores, quarter breakdowns, team comparisons, player statistics, shooting percentages, and game highlights. You can also replace the sports data with tournament schedules or short match summaries.
The design uses Bebas Neue and League Gothic for its condensed, high-impact headings. Both fonts support the bold scoreboard feel and can be replaced with other typefaces.
Keep exploring
15Build an engaging World UFO Day session with this flying saucer history lesson deck, featuring retro green-and-brown slides for PowerPoint and Google Slides.
 15
15Plan a lively animal-learning journey with this jungle zoo adventure lesson deck, ready to customize in PowerPoint and Google Slides for young learners.
 16
16Turn environmental research into a clear story with a Watercolor Ecology Presentation Theme for PowerPoint and Google Slides in calming green and blue.
 16
16Build focused fashion, literature, and humanities presentations with the Red Triangle Editorial Theme, editable in PowerPoint and Google Slides.
 15
15Turn streaming stats, favorite tracks, and concert highlights into a bold annual listening recap slide deck for PowerPoint and Google Slides.
 15
15Turn highlights, milestones, and favorite moments into a colorful year in review slide deck with bold 3D graphics for PowerPoint and Google Slides.
 3
3Build a credible endorsement with Standout Colleague Recommendation Letter Slides, featuring colorful prompts for skills, achievements, and team impact.
 4
4Build clear beginner sessions with an ice hockey fundamentals training deck for coaches, PE teachers, and clubs, ready for PowerPoint and Google Slides.