
 15
presentation
Yoga Workshop Marketing Presentation
Promote classes with a yoga workshop marketing presentation featuring playful beige, pink, and purple illustrations for PowerPoint and Google Slides.
Google SlidesPowerPoint
presentation · English
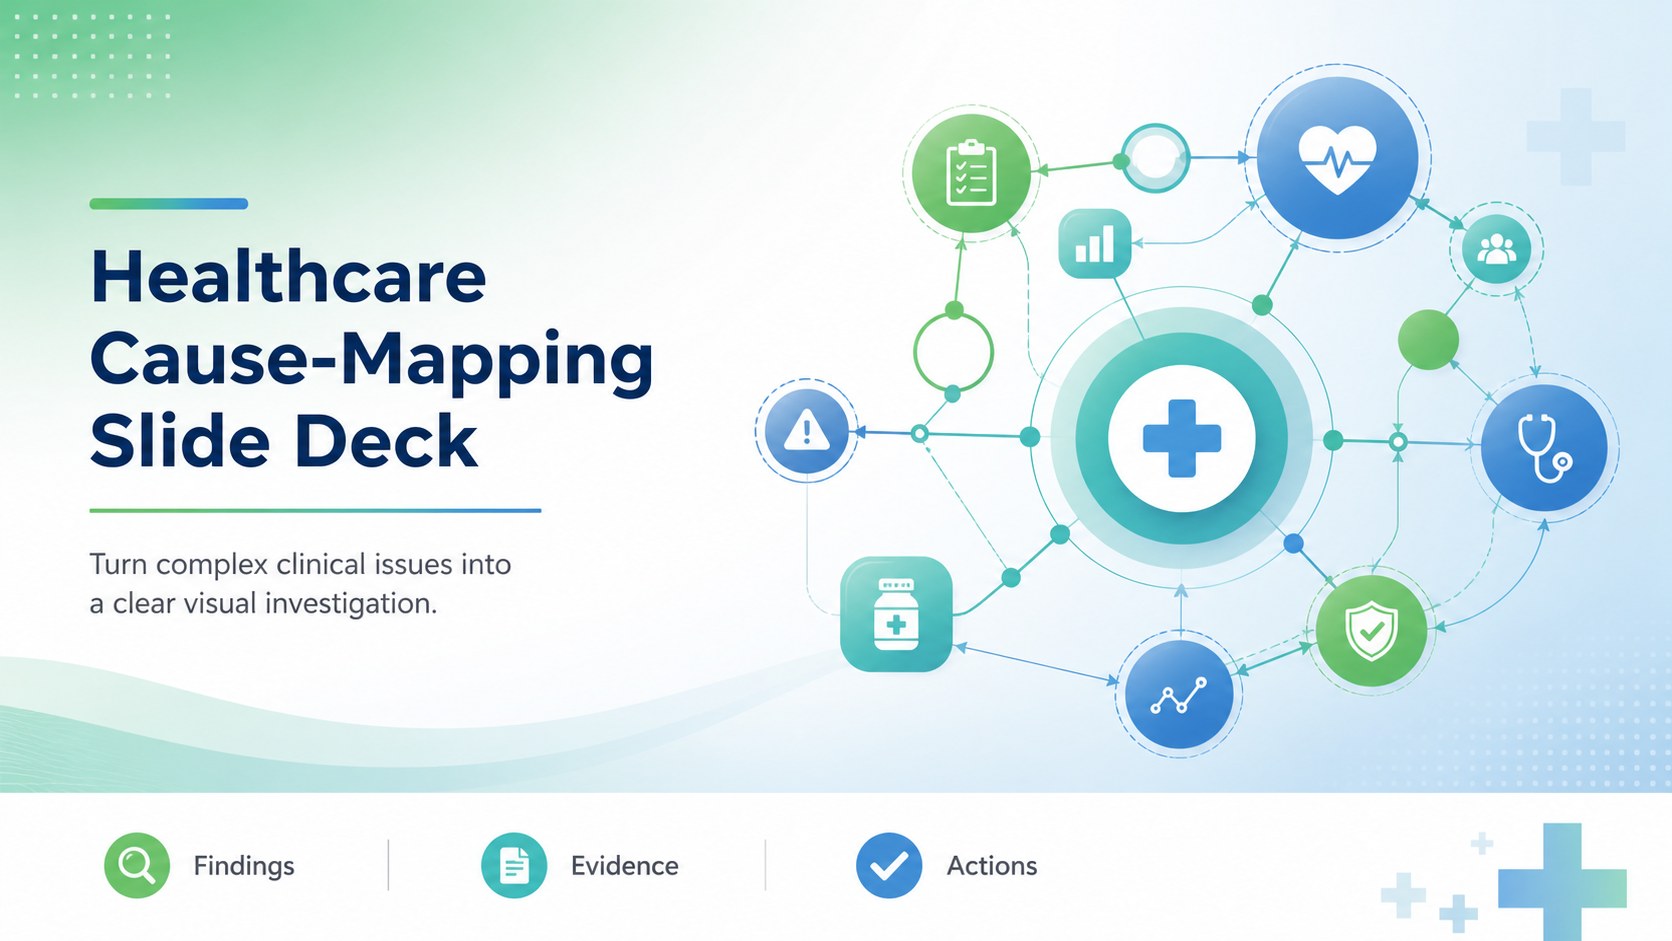
Build clearer healthcare investigations with a green, white, and blue cause-mapping slide deck for workflows, audits, training, and data-led team reviews.
Design notes
Healthcare Cause-Mapping Slide Deck is built for professionals who need to explain why a clinical, operational, or patient-service problem occurred. Its green, white, and blue gradient palette, spacious layouts, and restrained visual language make complicated findings easier to review in meetings, workshops, and improvement programs.
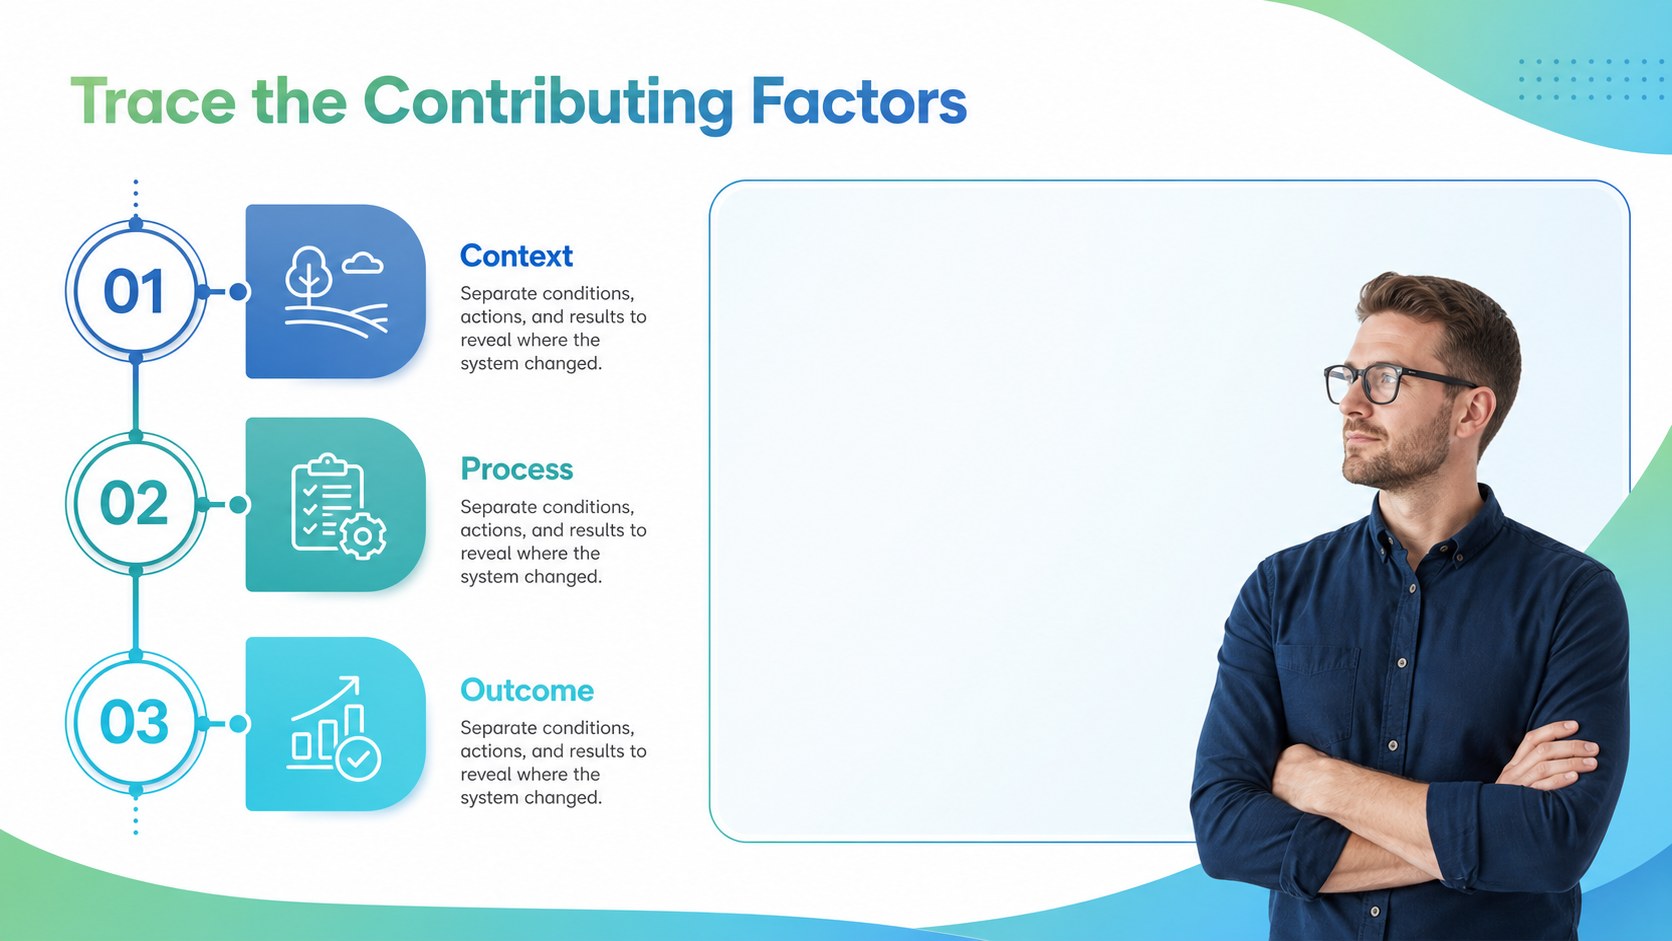
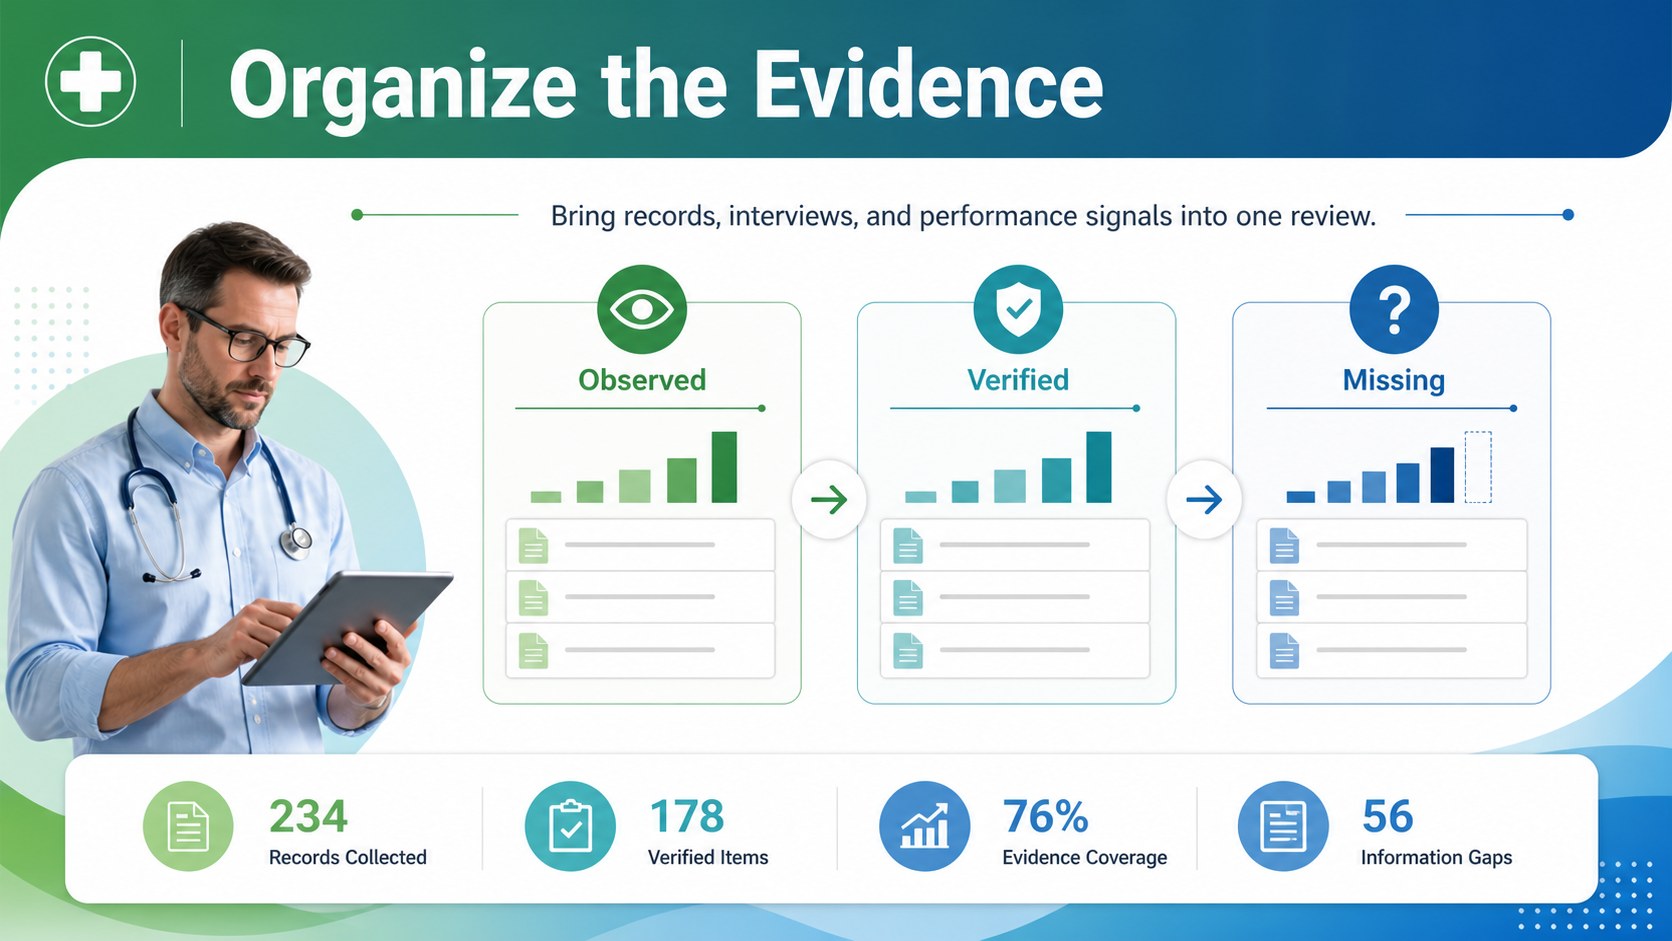
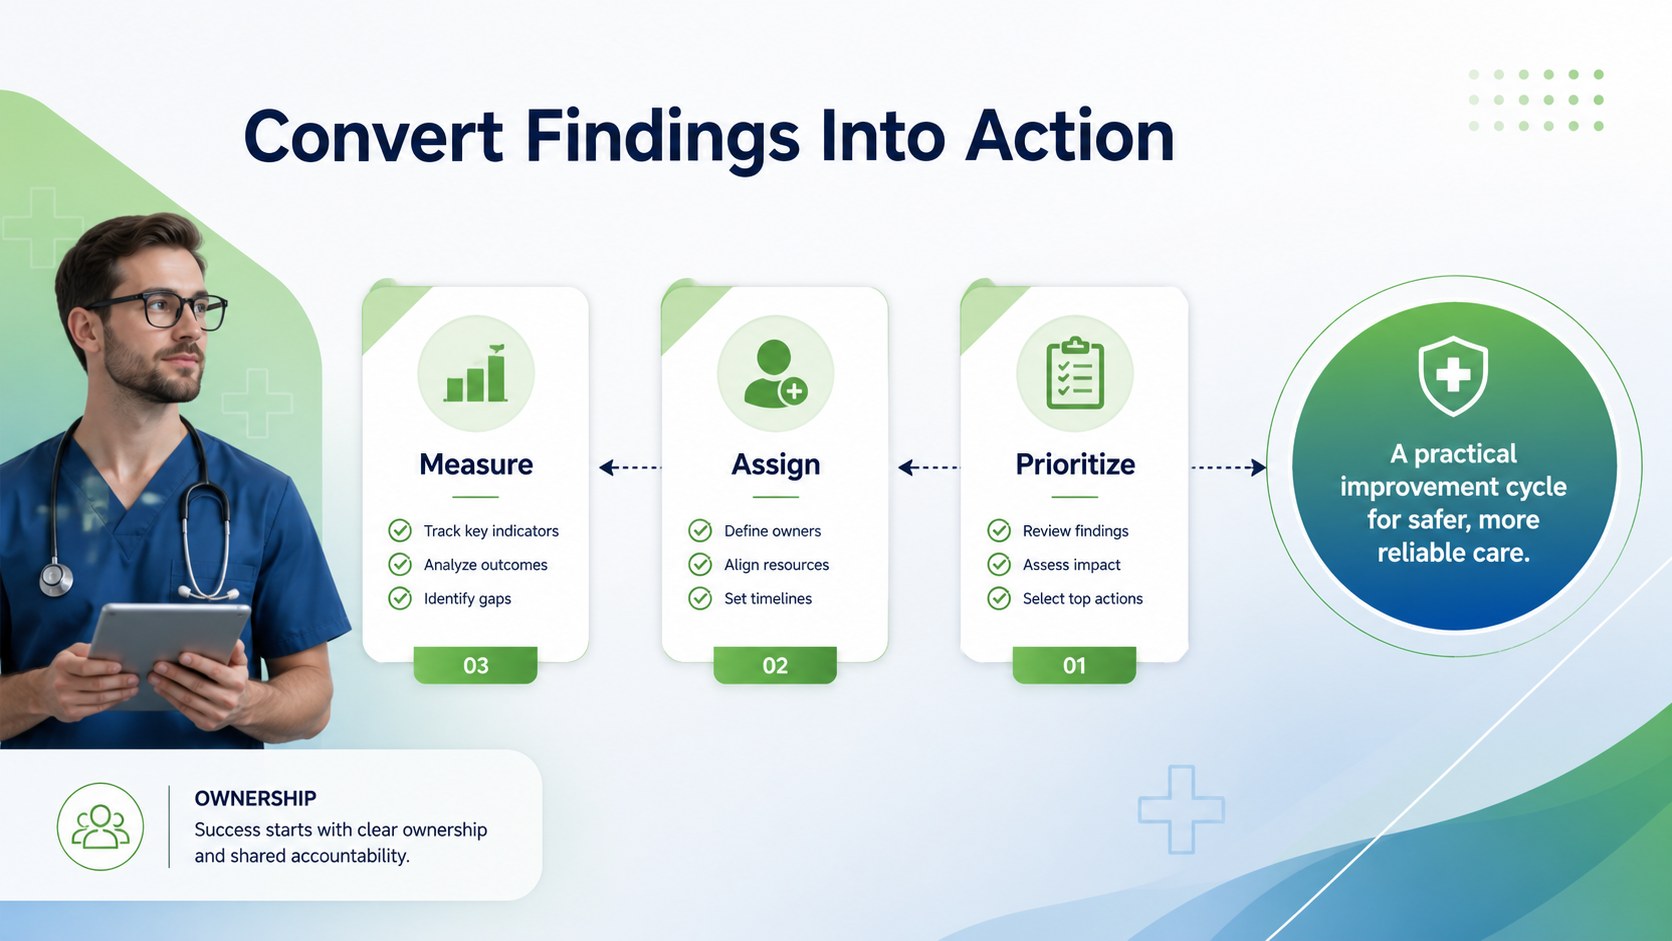
Use the deck to structure a healthcare root cause presentation, map contributing conditions, compare evidence, and connect findings with corrective actions. The editable infographic layouts support process reviews, quality assurance updates, incident analysis, compliance discussions, and staff training without overwhelming the audience. Clear labels, chart areas, connectors, and content blocks help transform scattered observations into an organized visual story.
Inside are four A4-style infographic slides that can be adapted for executive briefings, clinical operations teams, hospital administrators, analysts, and educators. Edit text, colors, diagrams, charts, and shapes in PowerPoint or Google Slides, then export the finished work for digital sharing or print. Use the layouts as a healthcare process improvement deck, a patient safety review, or a practical cause-and-effect analysis presentation. The design uses Almarai and Bai Jamjuree, with flexible spaces for metrics, notes, findings, and next steps.
Perfect for: hospital quality review; patient safety workshop; clinical incident briefing; healthcare operations meeting; staff training session.
Frequently asked questions
Can I edit this deck in PowerPoint? Yes. The layouts are designed for editing in PowerPoint, including text, shapes, charts, colors, and diagrams. Replace the sample content with your own clinical or operational findings.
Practical details
Yes. The layouts are designed for editing in PowerPoint, including text, shapes, charts, colors, and diagrams. Replace the sample content with your own clinical or operational findings.
Yes, you can open and customize the presentation in Google Slides. Check fonts and spacing after import, then adjust any elements that need platform-specific formatting.
Use the layouts for contributing factors, process breakdowns, evidence summaries, corrective actions, and quality metrics. They can support clinical incidents, patient experience reviews, compliance updates, and operational investigations.
Yes. All main colors can be adapted to match your department or organization. Keep the white space and contrast structure intact so charts, labels, and findings remain easy to scan.
Keep exploring
15Promote classes with a yoga workshop marketing presentation featuring playful beige, pink, and purple illustrations for PowerPoint and Google Slides.
 15
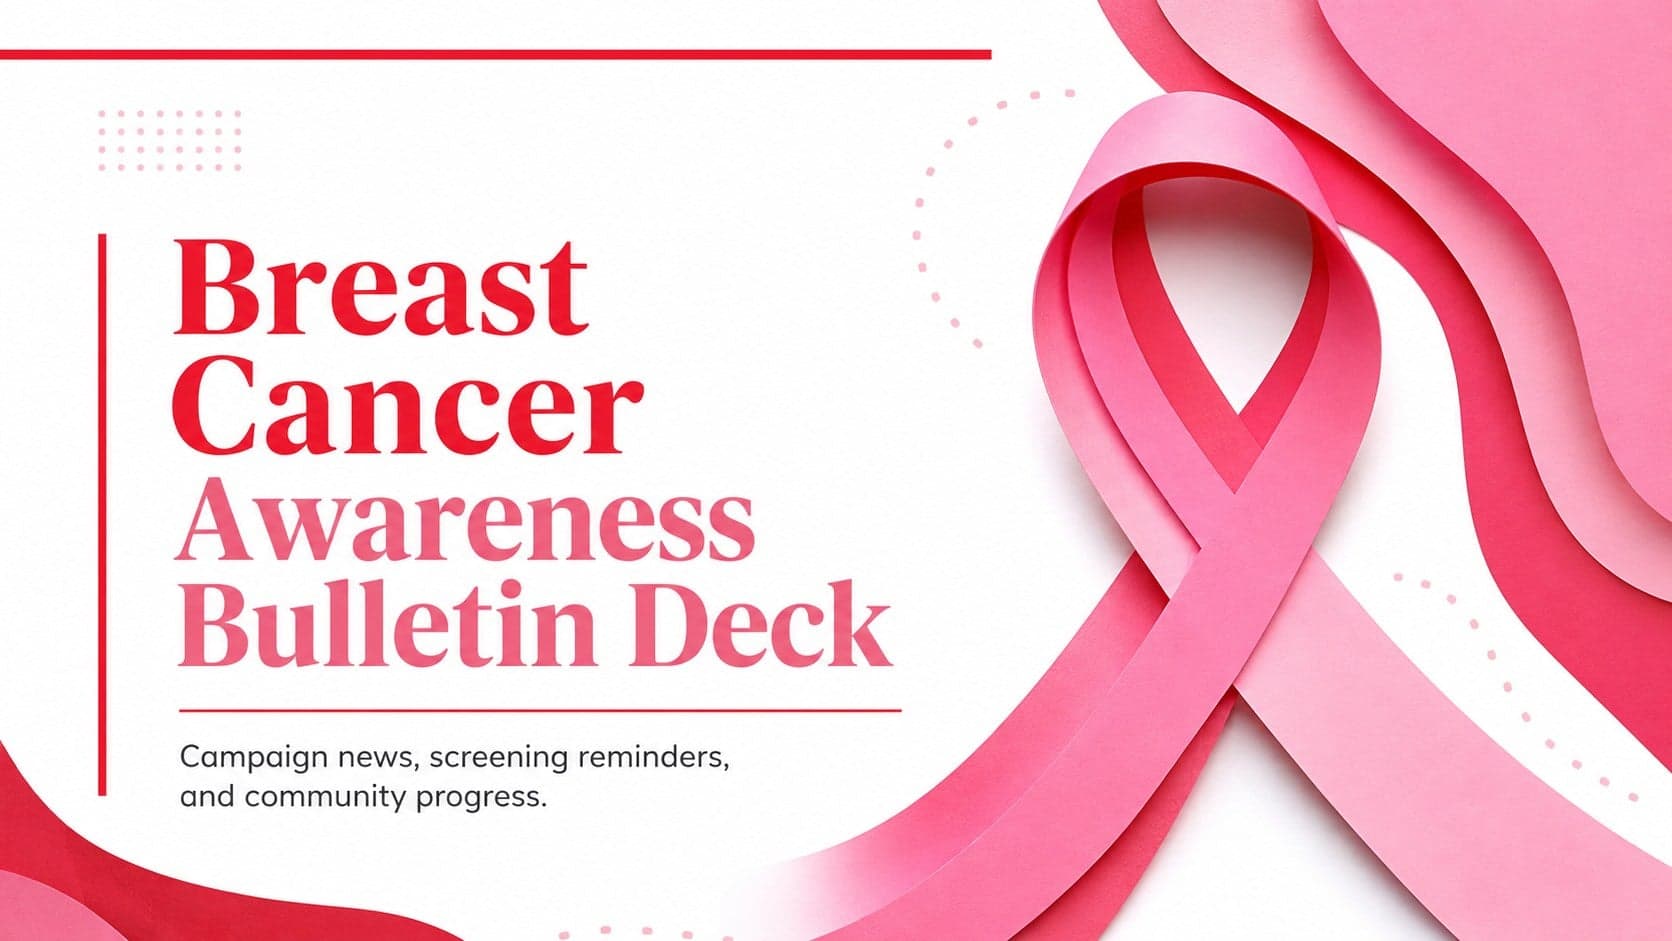
Build a clear breast cancer awareness bulletin with bold pink-and-red slides for campaign news, screening reminders, impact data, and community updates.
 15
Build a clear World Cancer Day message with this global cancer awareness campaign deck, featuring editable blue-green layouts for PowerPoint and Google Slides.
 4
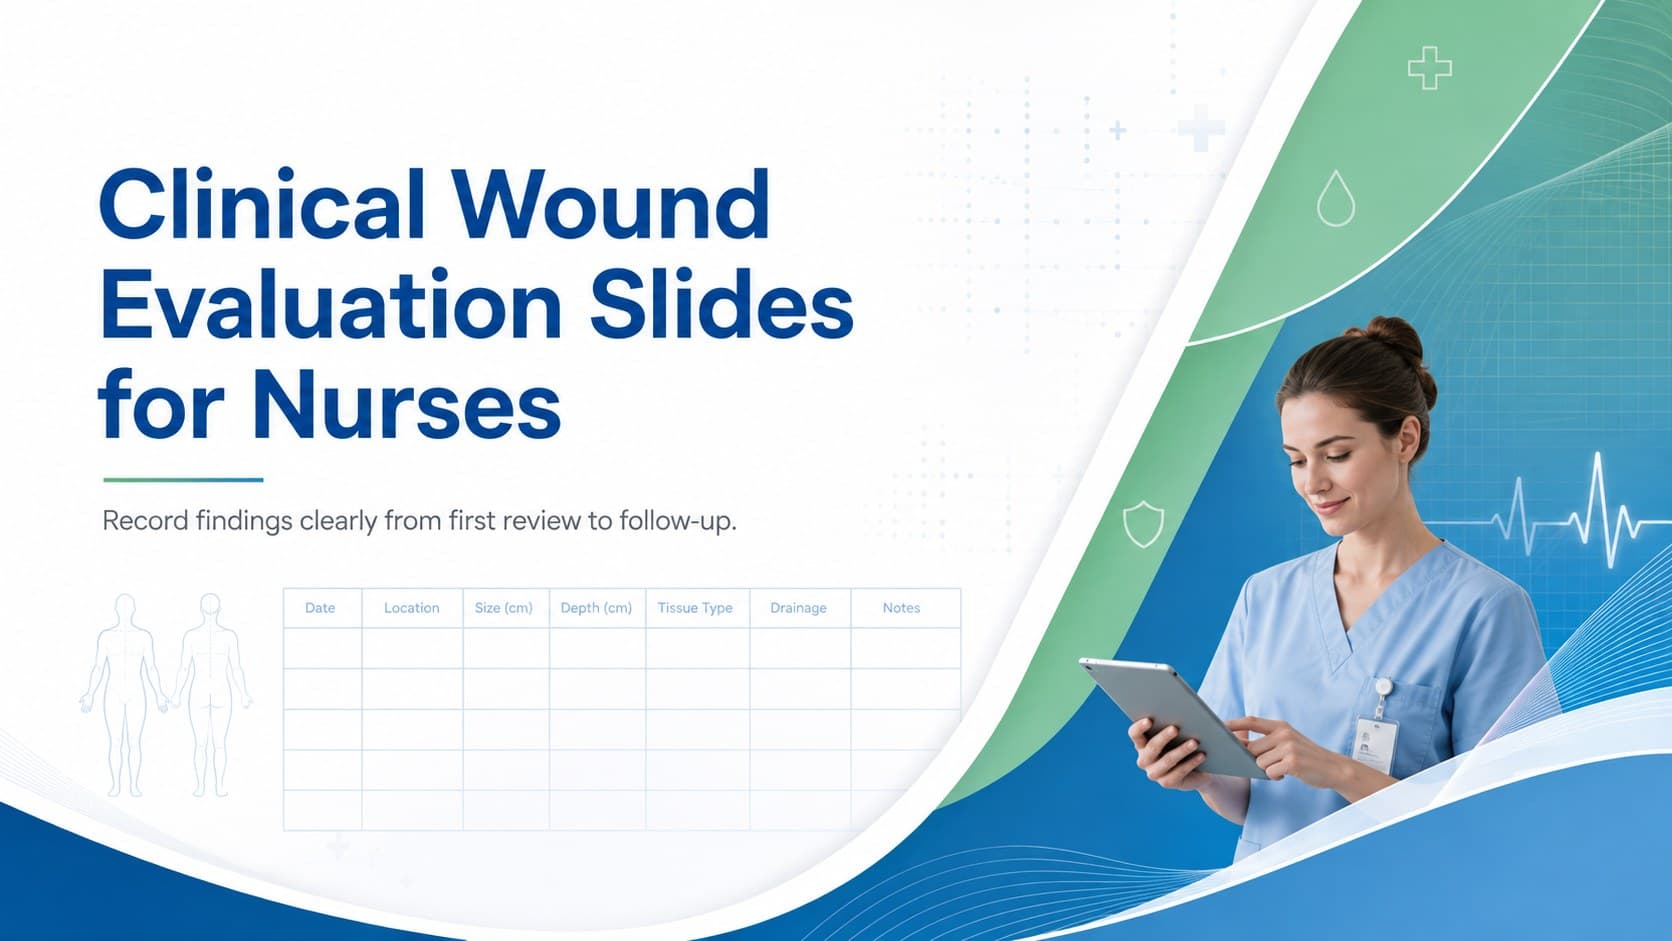
Document wound findings, treatment decisions, and healing progress with clinical wound evaluation slides for nurses in PowerPoint and Google Slides.
 14
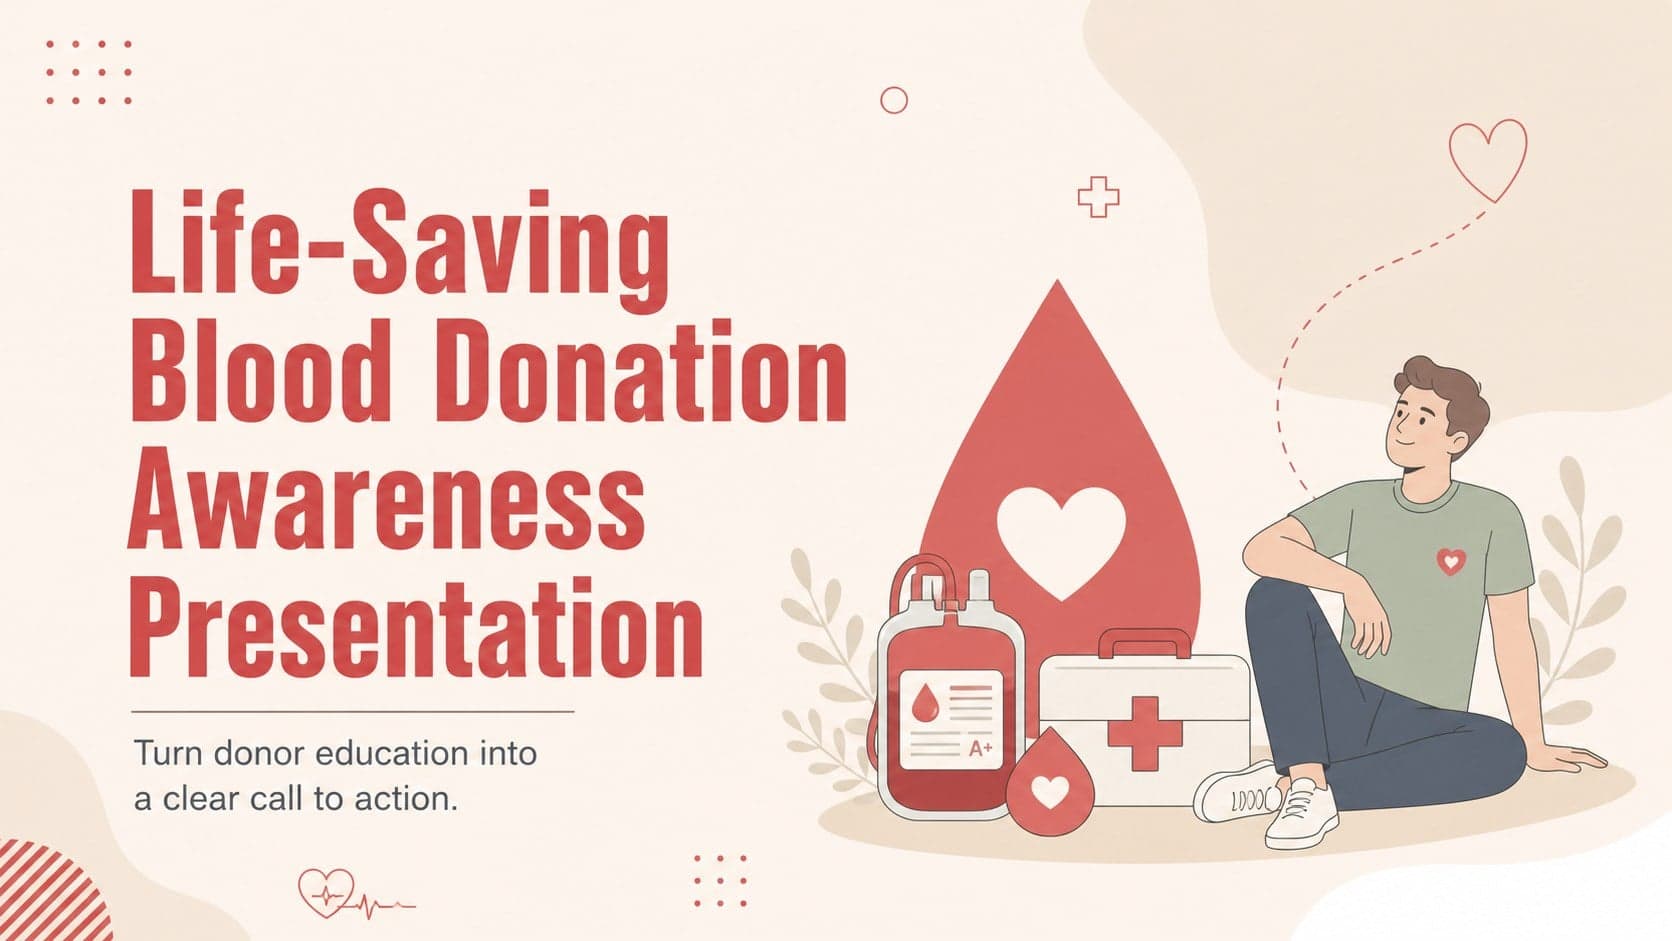
Plan a clear donor campaign with this blood donation awareness presentation, featuring editable beige-and-red visuals for PowerPoint and Google Slides.
 15
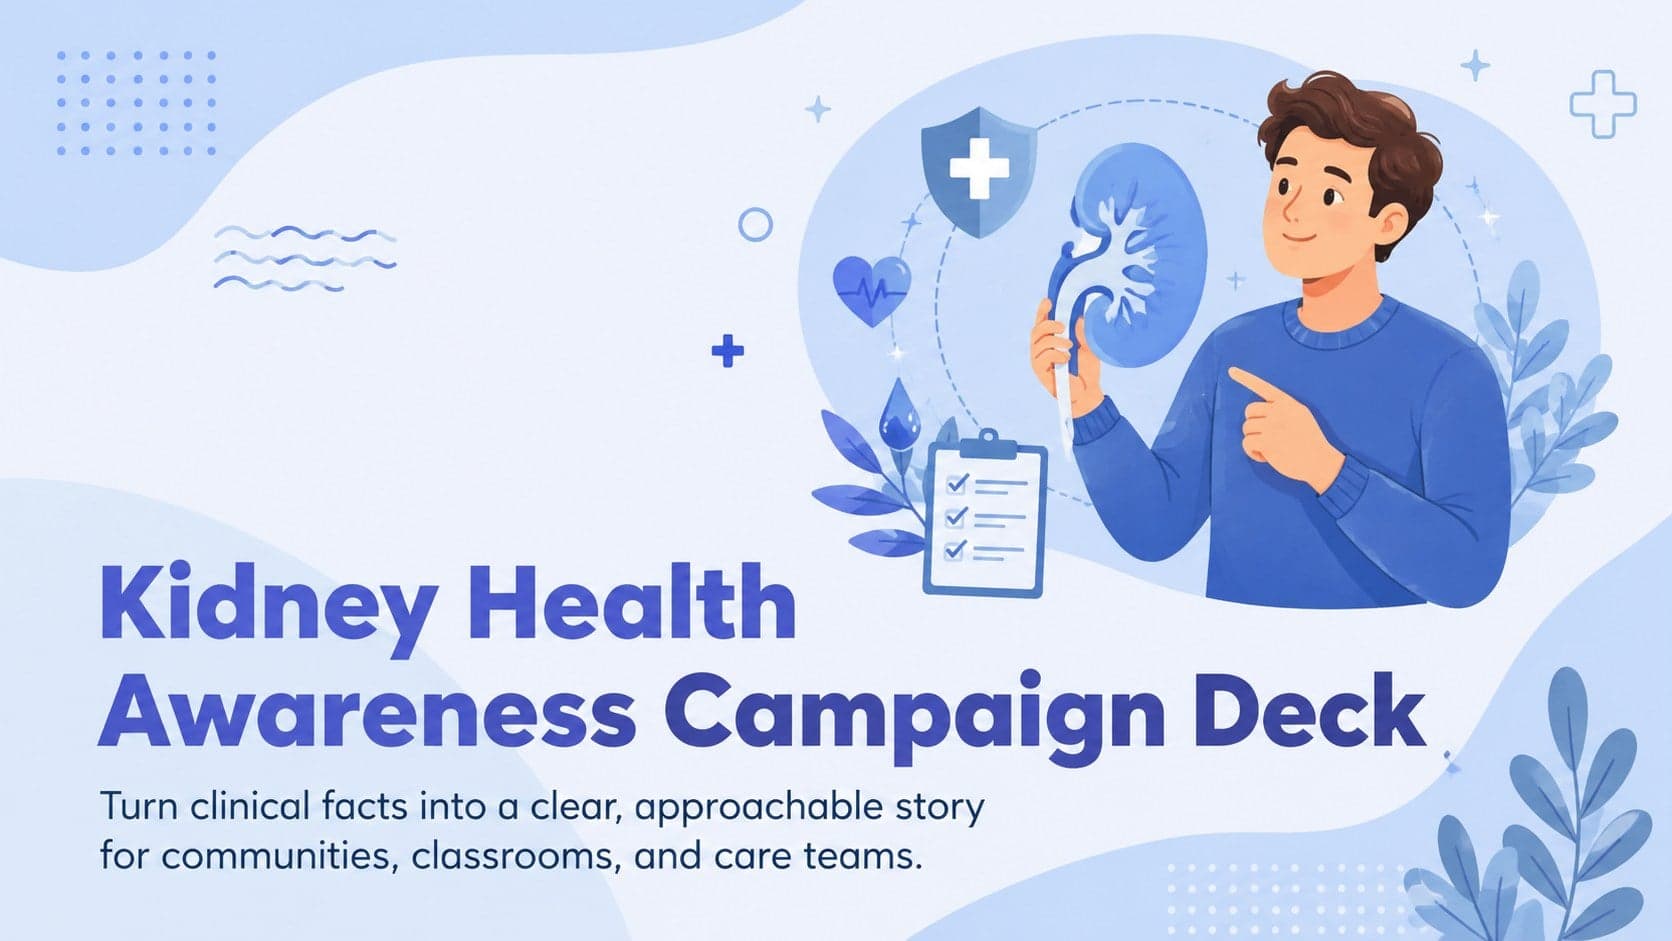
Build a Kidney Health Awareness Campaign Deck with blue illustrated slides for prevention tips, risk education, screening events, and outreach.
 15
Build an actionable training session with this fitness program workshop deck, using energetic yellow geometry and editable PowerPoint and Google Slides layouts.
 15
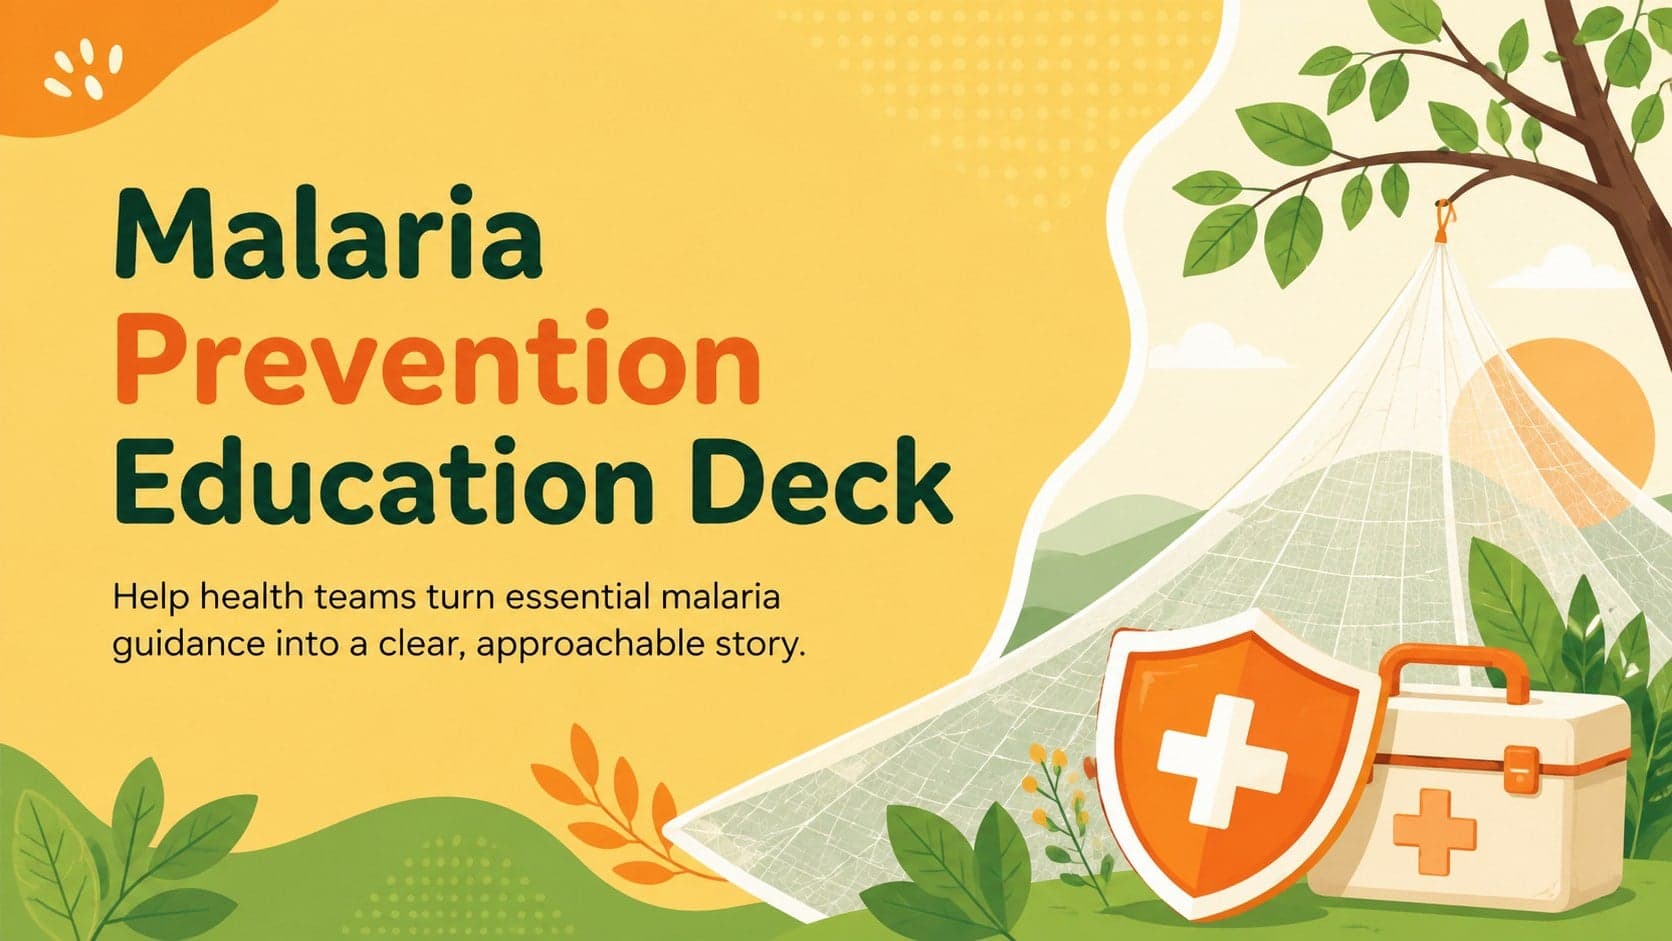
Equip health teams with this malaria prevention education deck for workshops, community outreach, and policy briefings in PowerPoint or Google Slides.