
 15
15presentation
College Essay Thesis Builder Slides
Build stronger academic arguments with a college essay thesis builder featuring guided examples, revision prompts, and editable PowerPoint and Google Slides.
Google SlidesPowerPoint
presentation · English
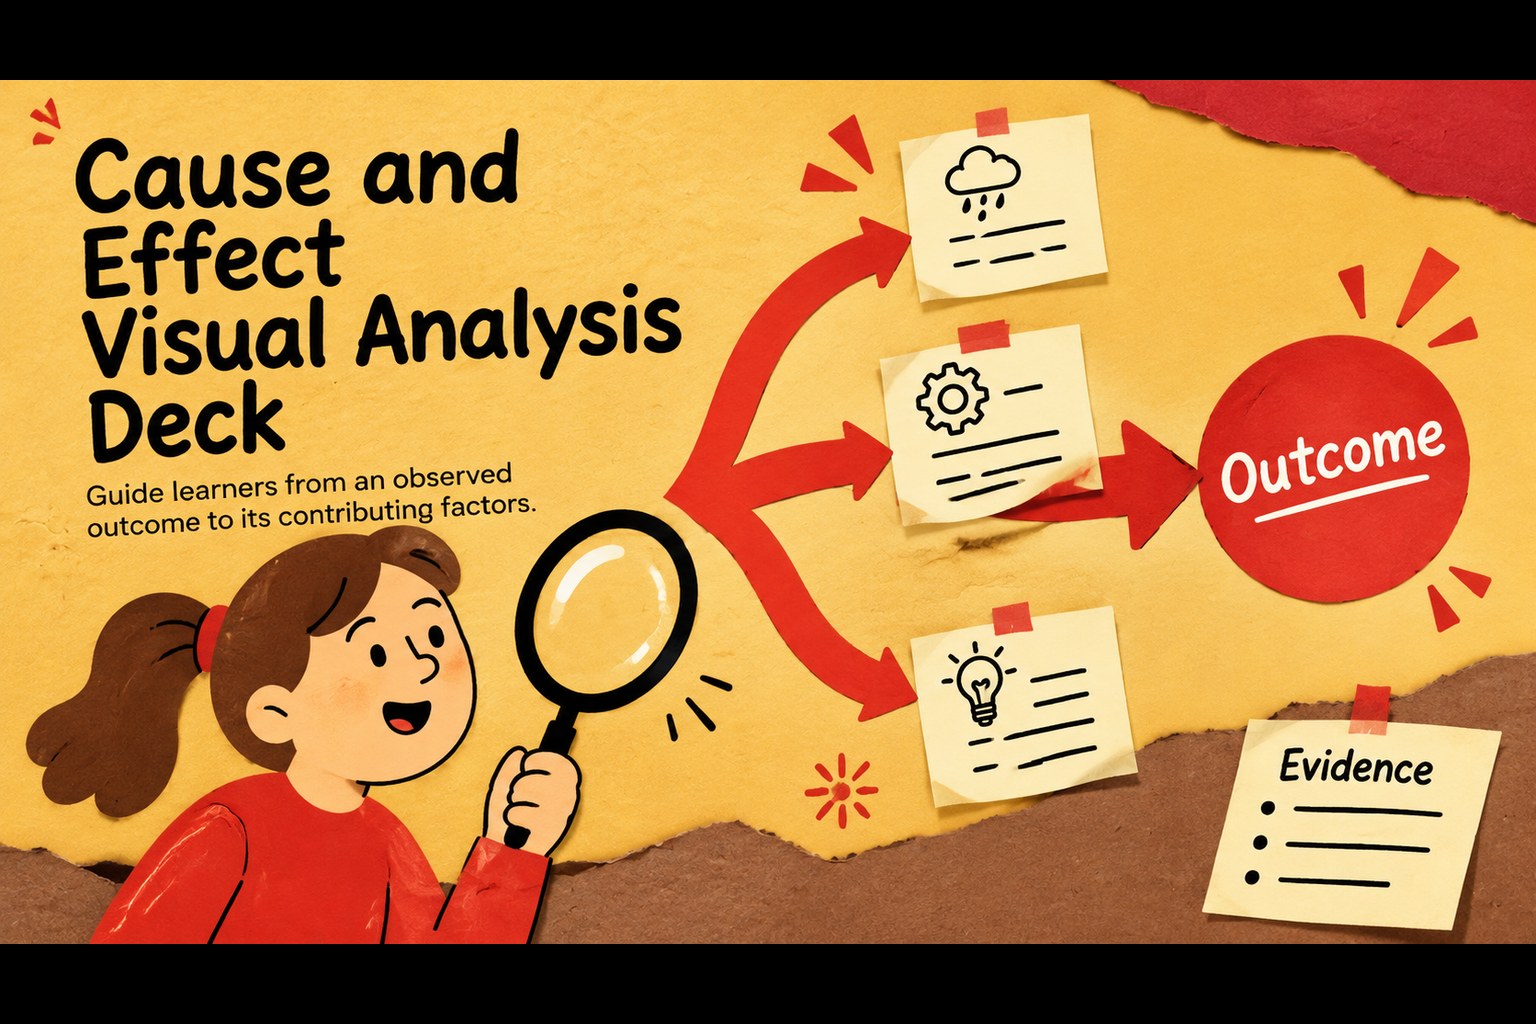
Turn complex relationships into clear stories with a Cause and Effect Visual Analysis Deck for classroom inquiry, research, and group discussion.
Design notes
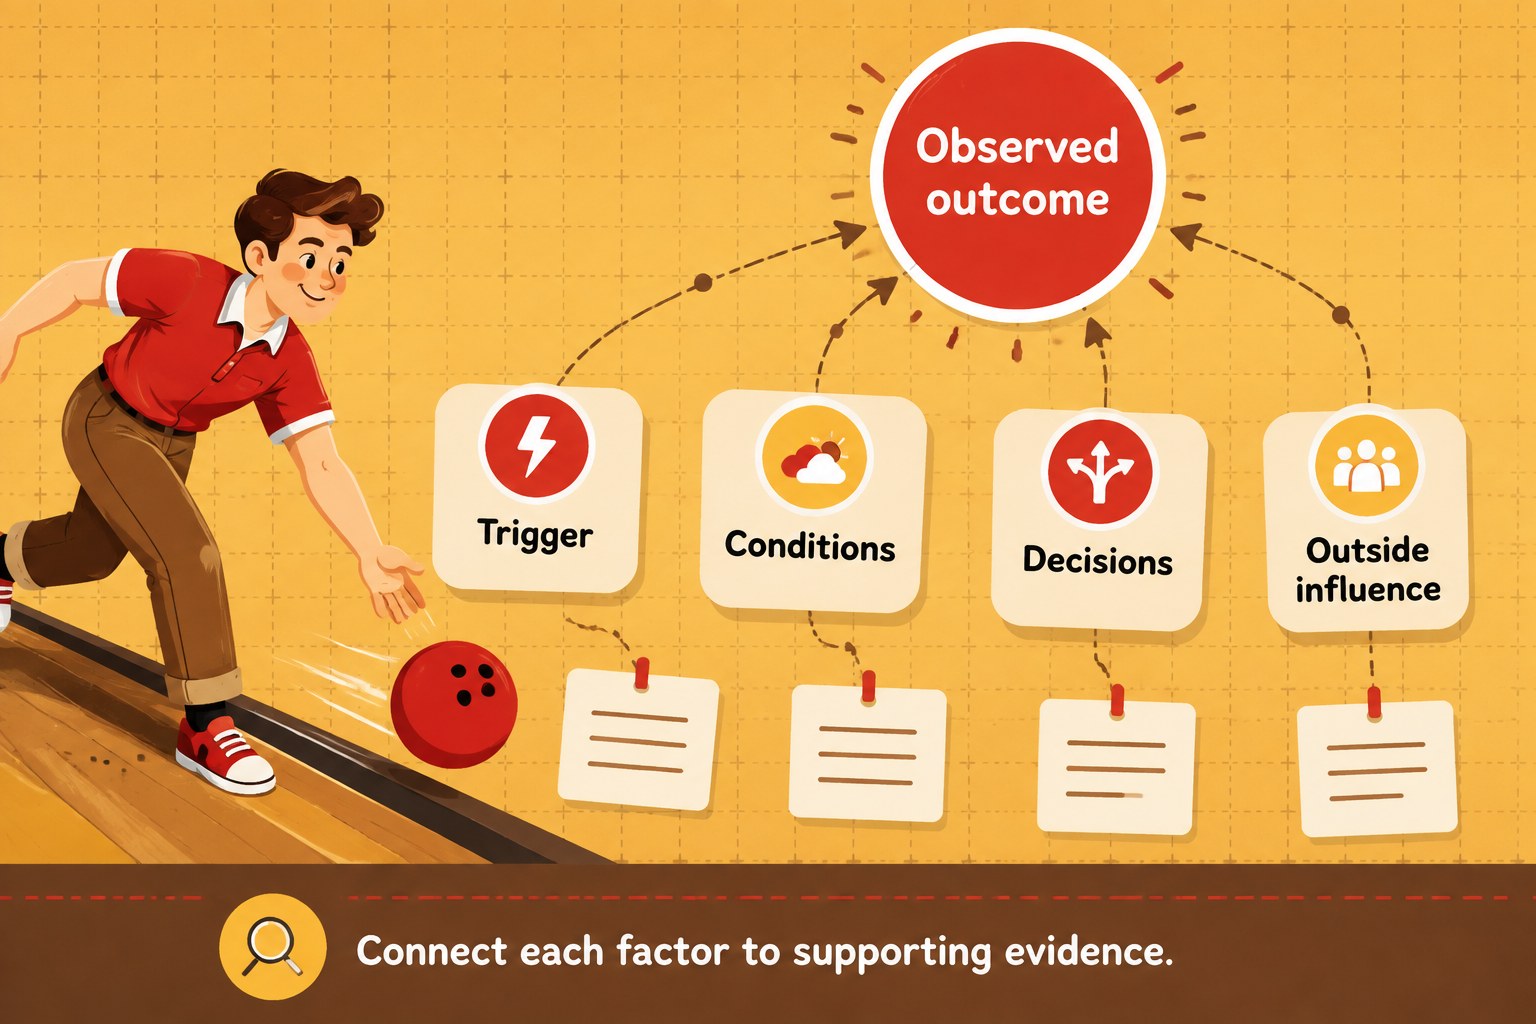
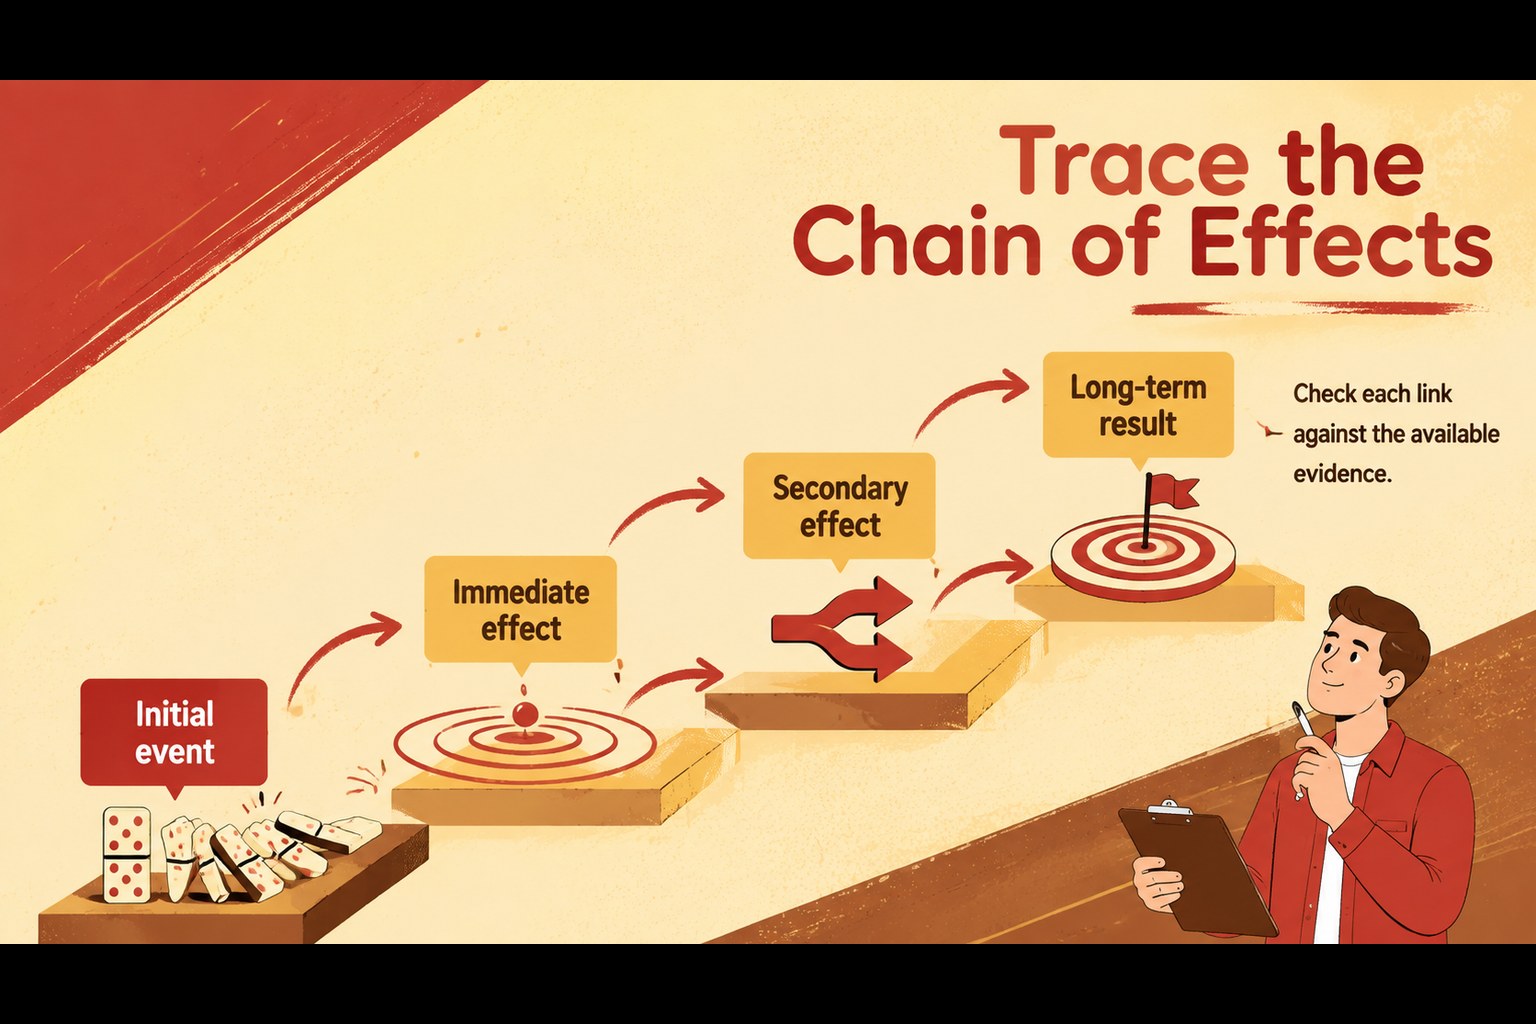
Turn connected events into a story your audience can follow with this cause and effect visual analysis deck. Warm red, yellow, and brown illustrations give each idea energy while keeping relationships between actions, influences, and outcomes easy to scan. Every layout is designed to help presenters move beyond a basic list and show how evidence supports a conclusion.
Inside are three editable infographic slides for introducing a topic, mapping contributing factors, and tracing consequences. Use the cause and effect diagram presentation as a starting point, then replace the sample wording, adjust labels, recolor shapes, or reorganize the visual paths. The layouts also work as a visual cause mapping template for comparing direct causes, indirect influences, short-term effects, and longer-term results. Fonts, icons, connectors, and illustrated accents can be customized in PowerPoint or Google Slides.
This deck suits students, teachers, tutors, researchers, and workshop facilitators who need to explain why something happened and what followed. It can support a classroom cause consequence activity, a historical event review, a science investigation, a literary analysis, or an academic debate. The expressive style keeps school assignments engaging without sacrificing structure, making it useful for both individual presentations and collaborative discussions.
Perfect for: classroom cause analysis; historical event review; science investigation findings; literary consequence mapping; research discussion; academic debate.
Frequently asked questions
Can I edit every element in this deck? Yes. You can change the text, colors, fonts, illustrations, labels, and connecting shapes to fit your topic. Individual elements can also be moved or removed when you need a simpler diagram.
Practical details
Yes. You can change the text, colors, fonts, illustrations, labels, and connecting shapes to fit your topic. Individual elements can also be moved or removed when you need a simpler diagram.
The deck is designed for PowerPoint and Google Slides. Minor spacing or font adjustments may be needed when moving a presentation between the two platforms.
Replace the sample outcome and factor labels with details from your lesson, experiment, historical event, or research question. Add or remove branches so the visual hierarchy reflects the actual number of causes and effects.
Yes. Assign learners different branches of the diagram or ask groups to propose evidence for each relationship. The completed map can then serve as a discussion guide or presentation summary.
Keep exploring
15Build stronger academic arguments with a college essay thesis builder featuring guided examples, revision prompts, and editable PowerPoint and Google Slides.
 15
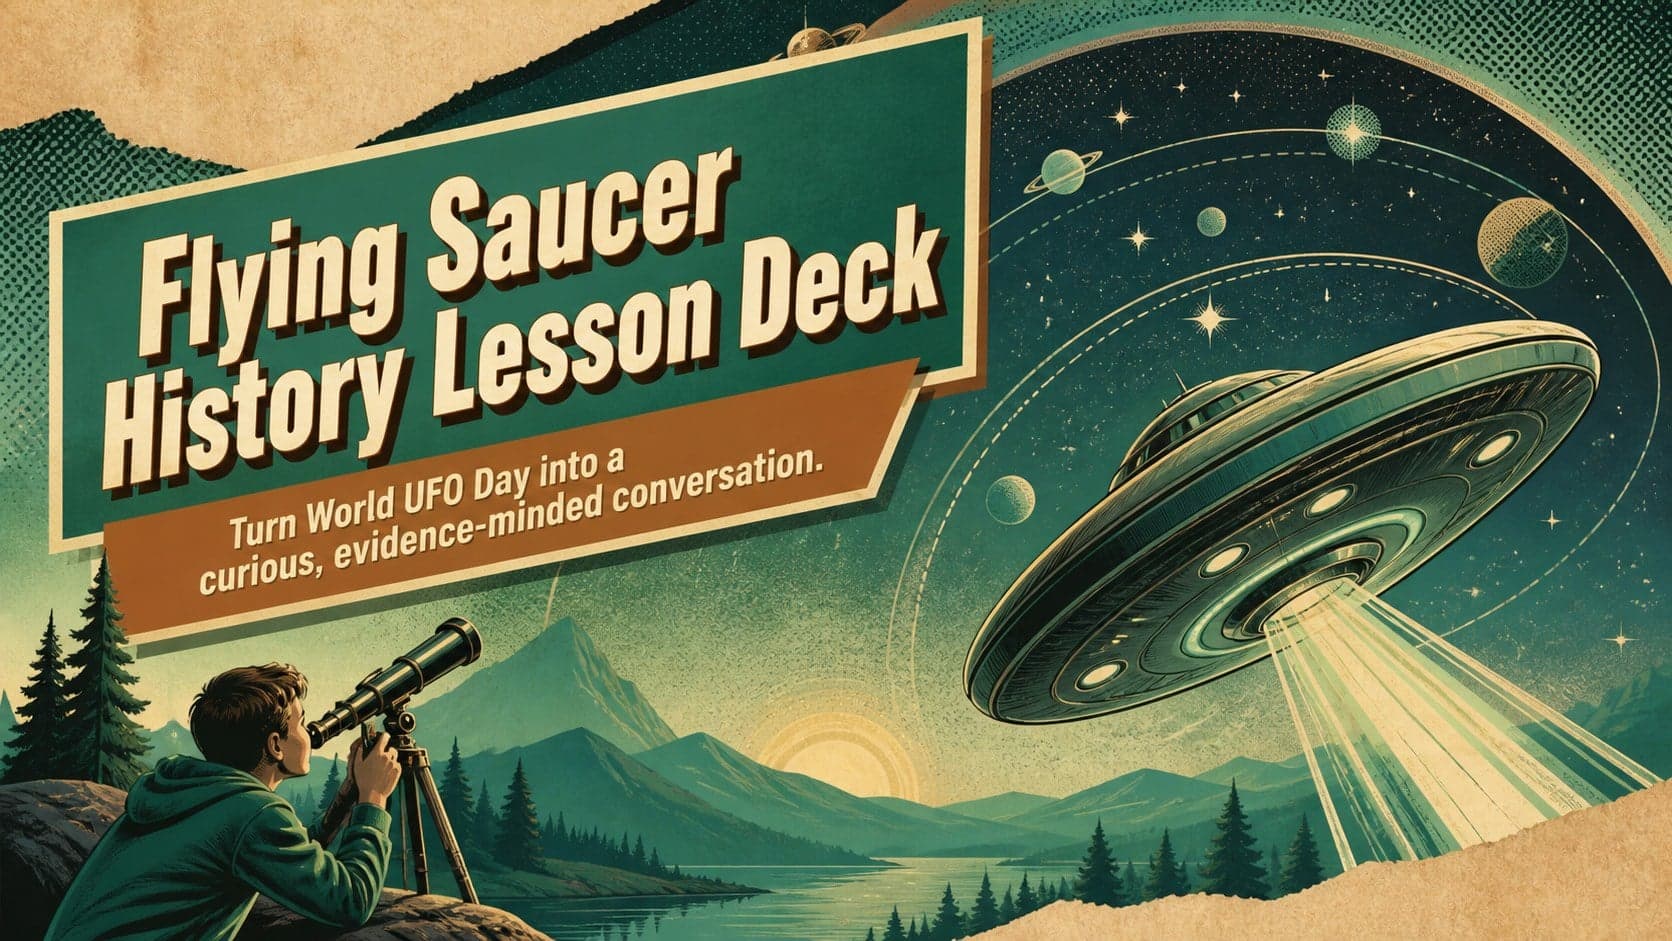
15Build an engaging World UFO Day session with this flying saucer history lesson deck, featuring retro green-and-brown slides for PowerPoint and Google Slides.
 14
14Plan a memorable Lunar New Year campaign with the 2036 Dragon Year Celebration Theme, featuring bold red-and-yellow slides for lessons and events.
 15
15Build a thoughtful classroom discussion with this interfaith awareness lesson deck, featuring editable blue-and-white slides for PowerPoint and Google Slides.
 15
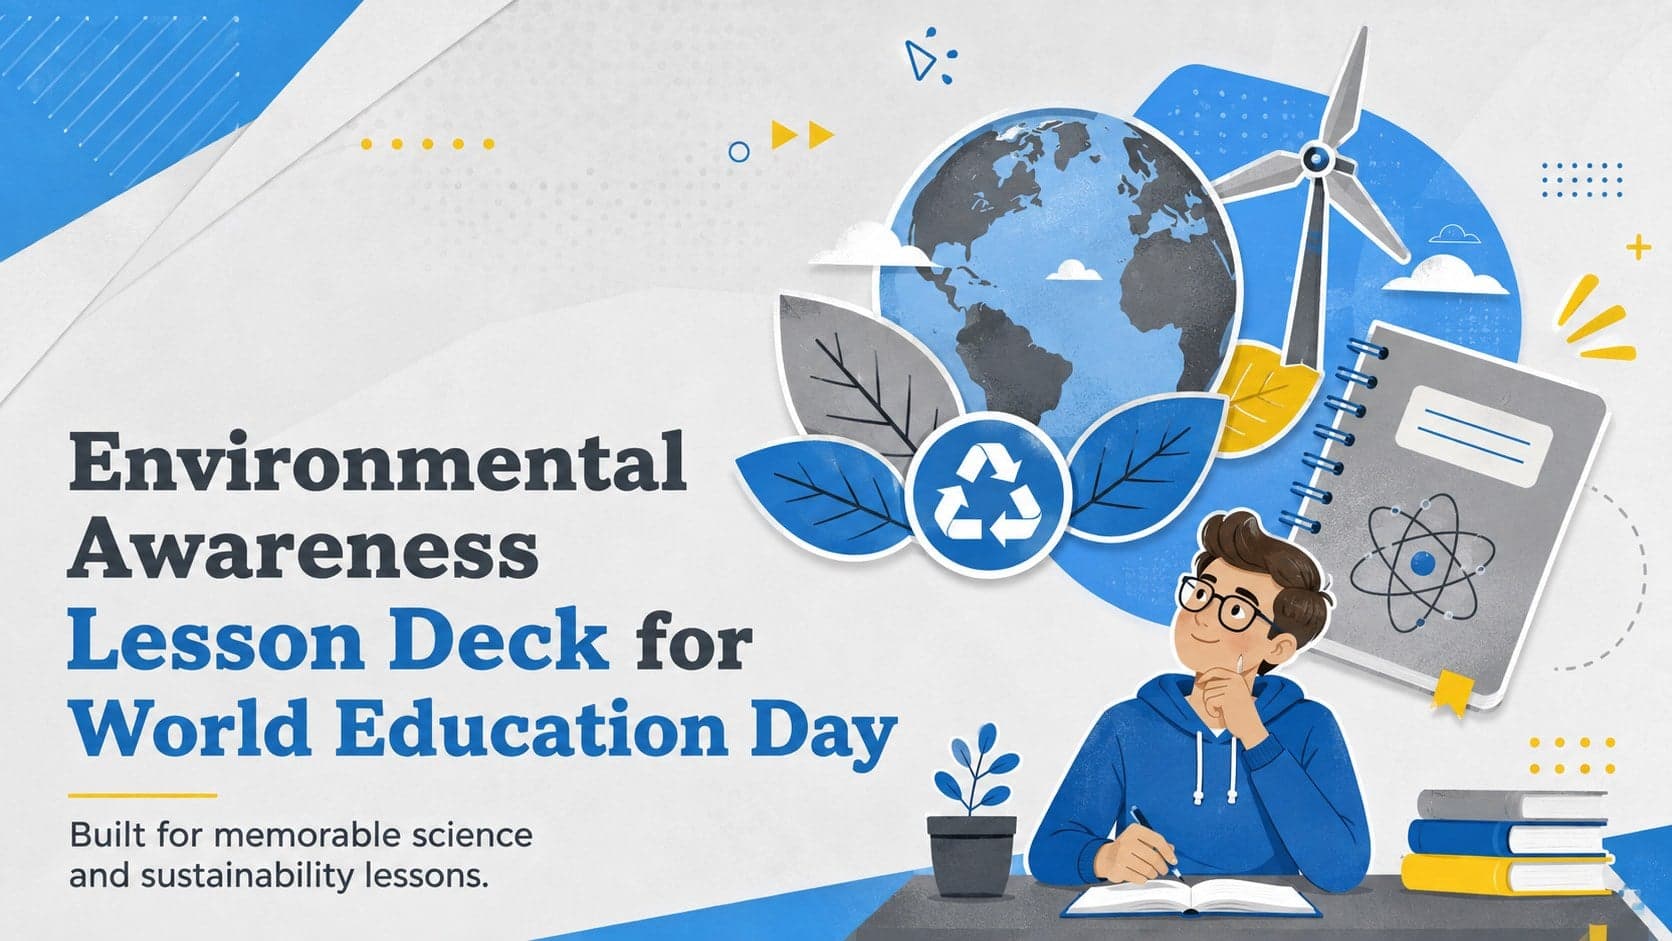
15Use this environmental awareness lesson deck to teach climate action through illustrated activities, discussion prompts, and ready-to-edit visuals.
 15
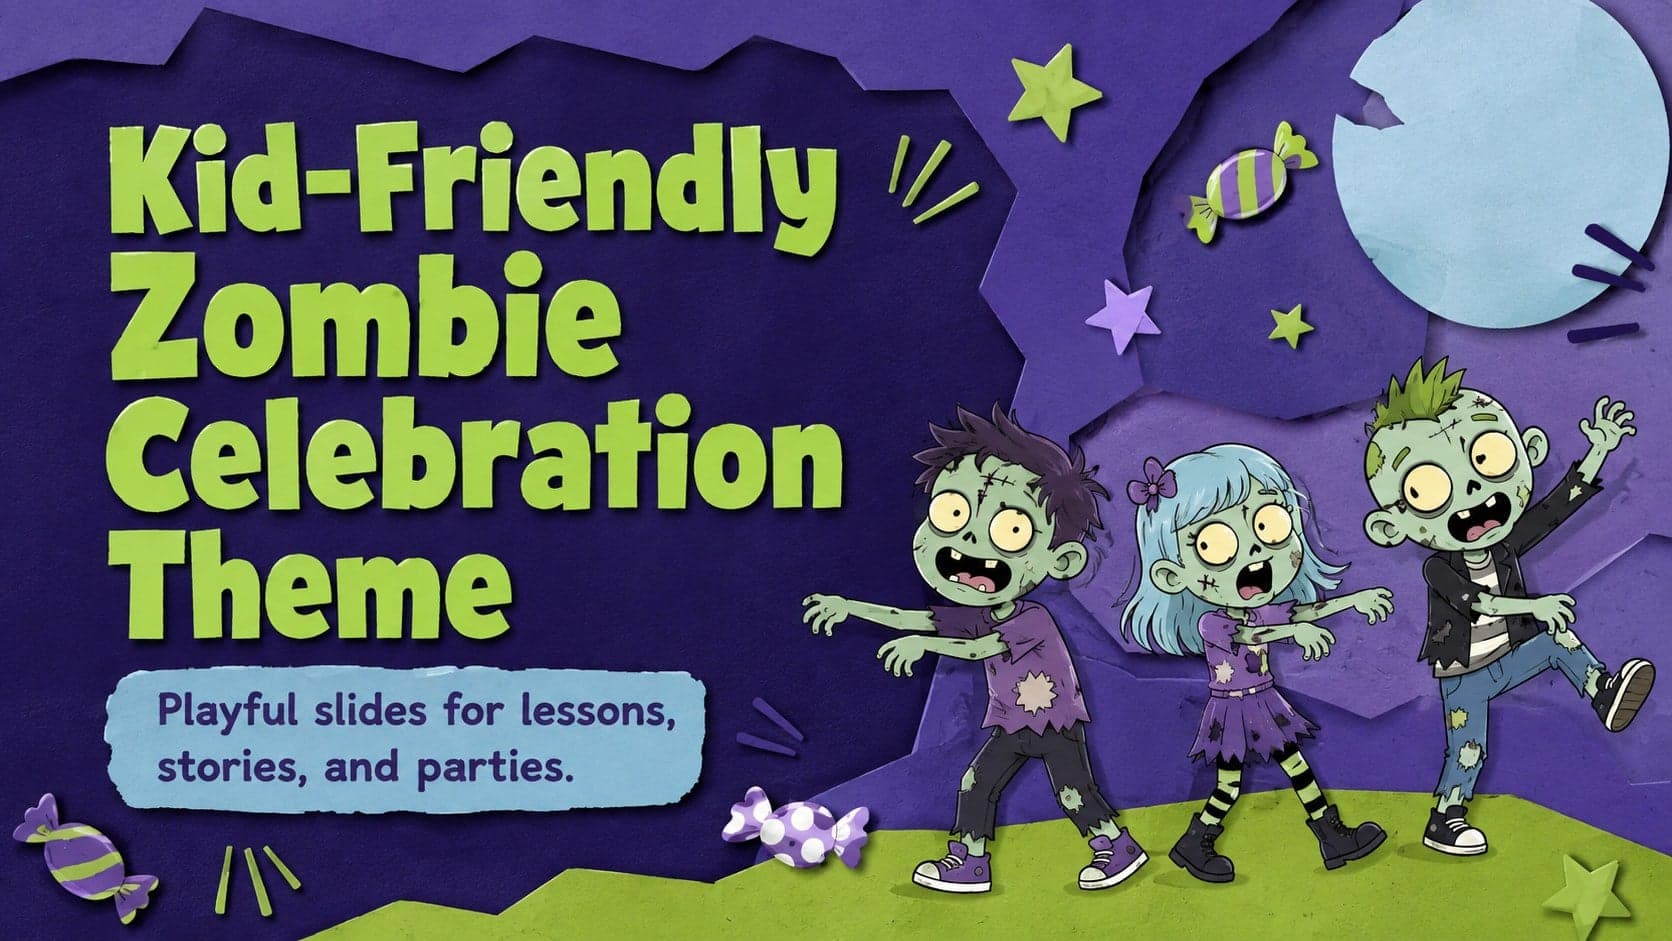
15Build playful lessons and party stories with a kid-friendly zombie celebration theme in purple, green and pastel blue for PowerPoint and Google Slides.
 15
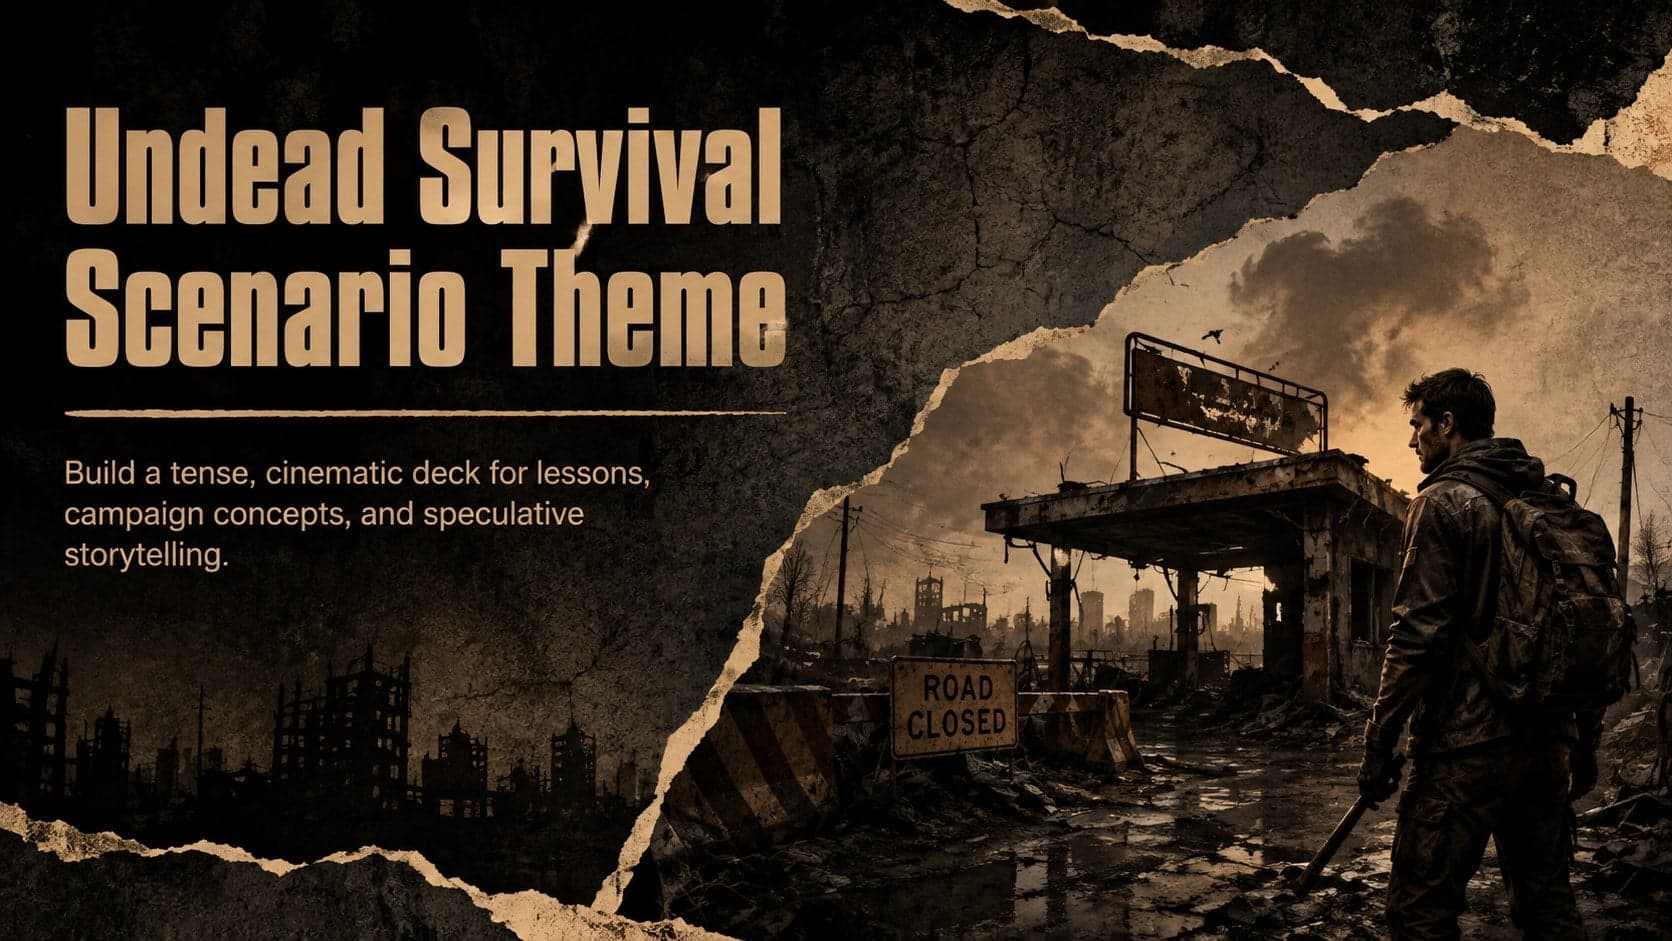
15Build eerie lessons, campaigns, and story pitches with an undead survival scenario theme featuring editable slides for PowerPoint and Google Slides.
 16
16Turn environmental research into a clear story with a Watercolor Ecology Presentation Theme for PowerPoint and Google Slides in calming green and blue.