
 15
presentation
Astrology Audience Insights Deck
Use this astrology audience insights deck to present zodiac-based segments, behaviors, and campaign findings in polished black-and-gold slides.
Google SlidesPowerPoint
presentation · English
Run sharper strategy sessions with an online business analysis webinar deck featuring clean green visuals, practical frameworks, and editable charts.

Design notes
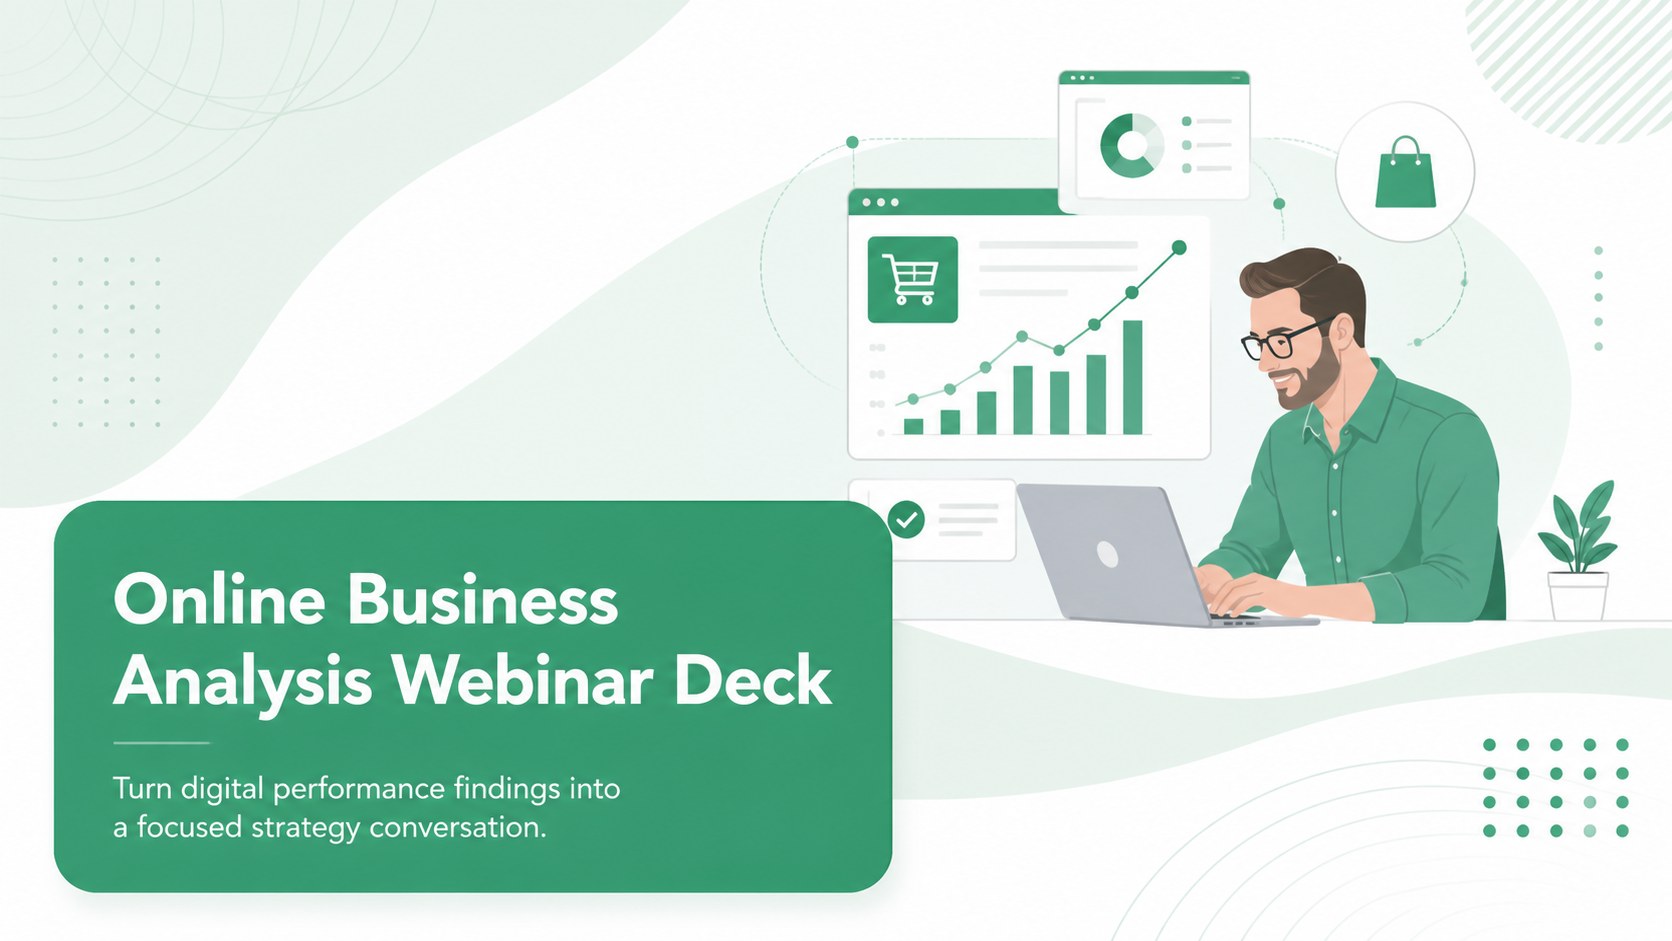
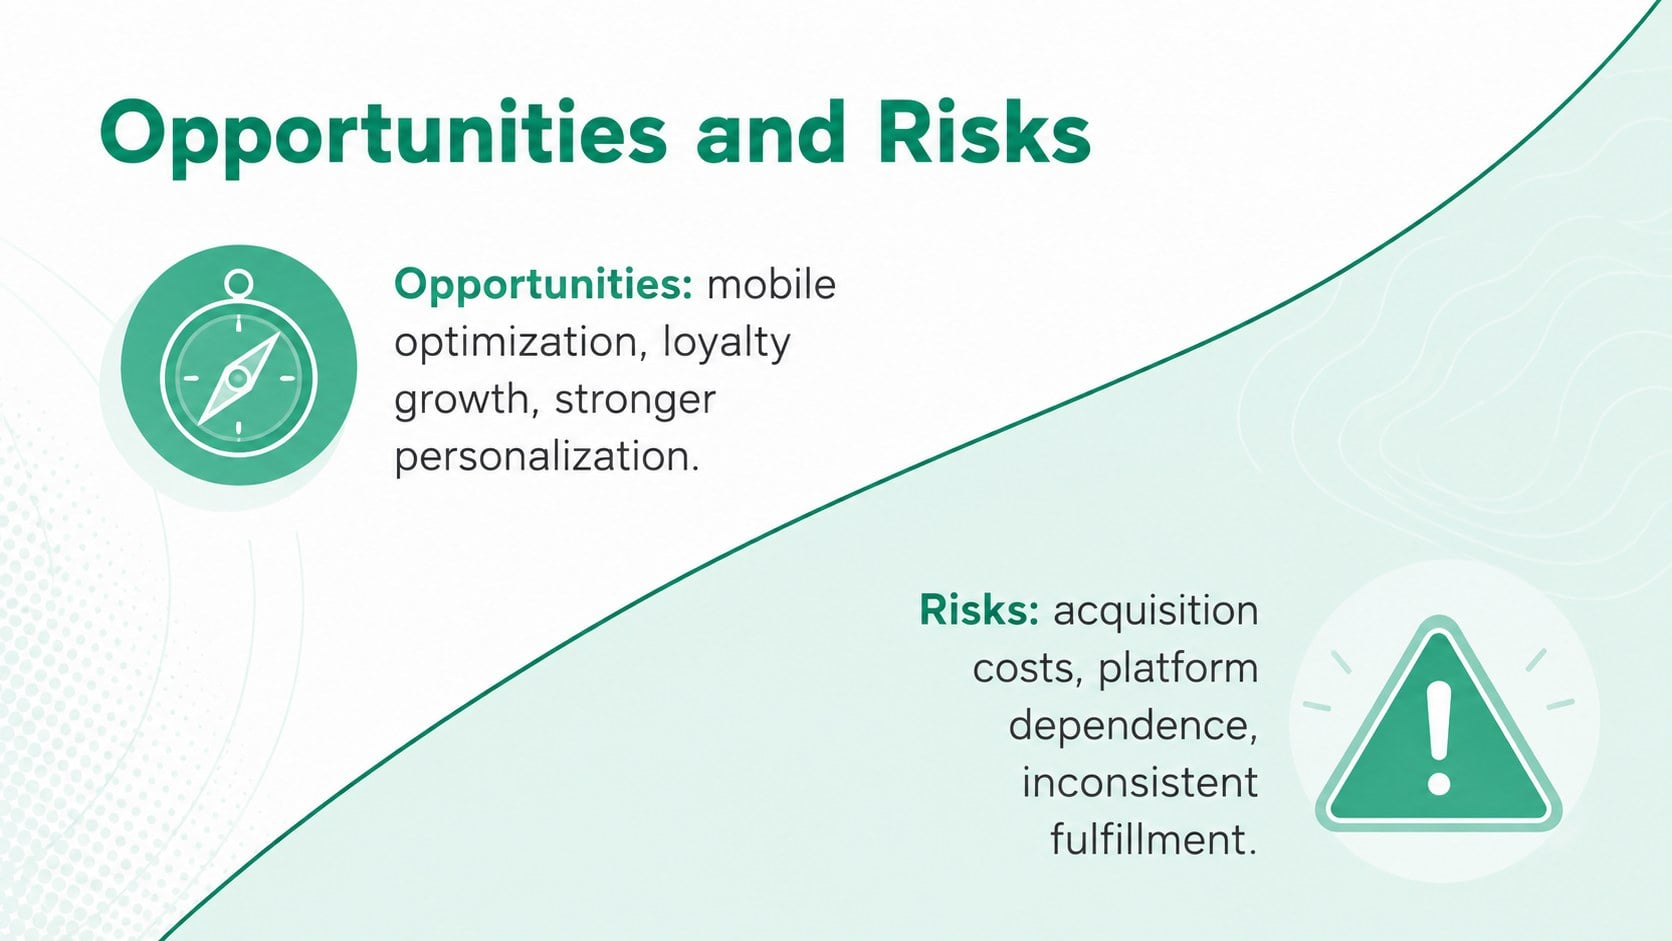
Turn research, performance data, and strategic recommendations into a clear narrative with this online business analysis webinar deck. Its fresh green-and-white palette, restrained typography, original illustrations, and structured layouts create a professional setting for virtual workshops, management briefings, and digital commerce reviews.
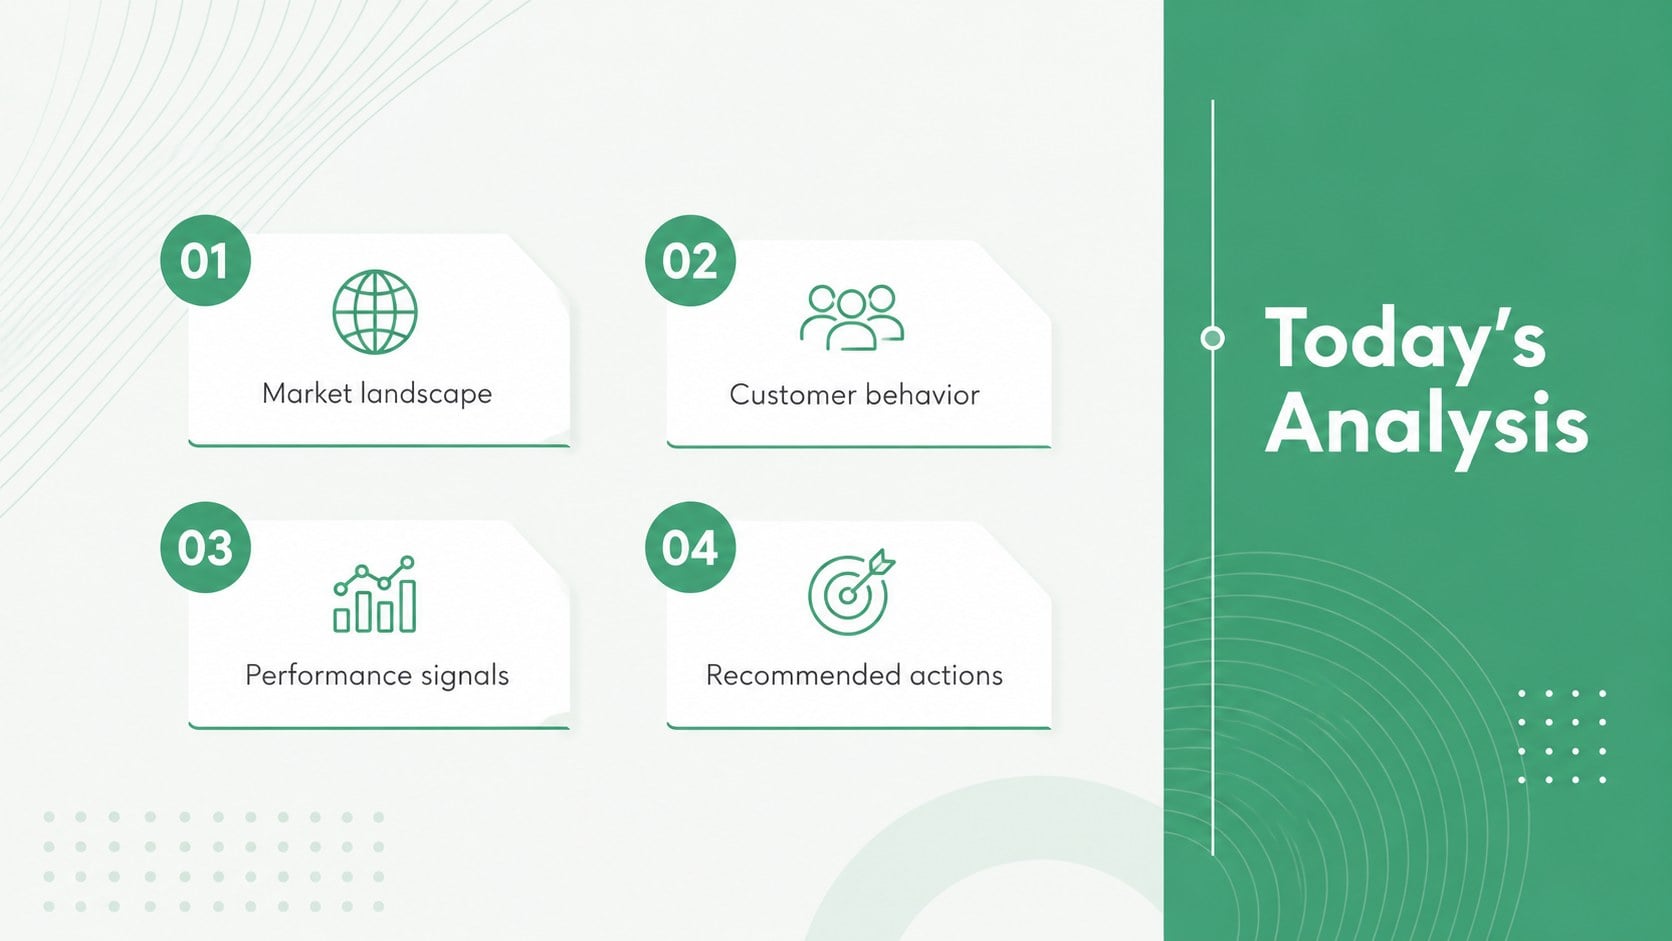
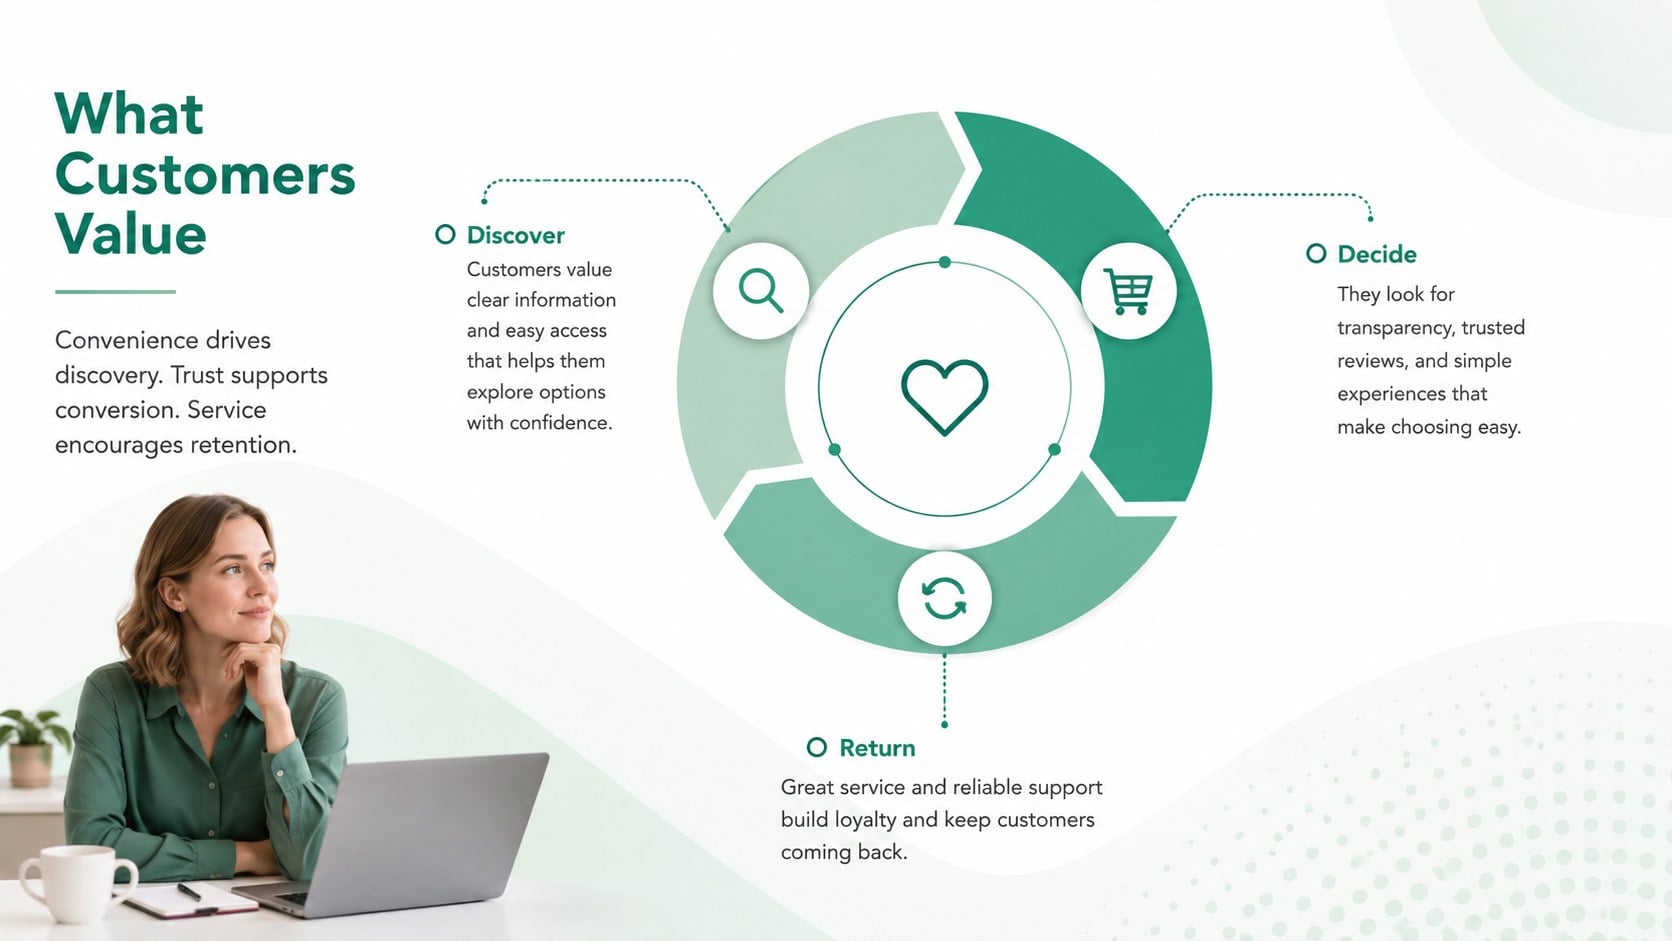
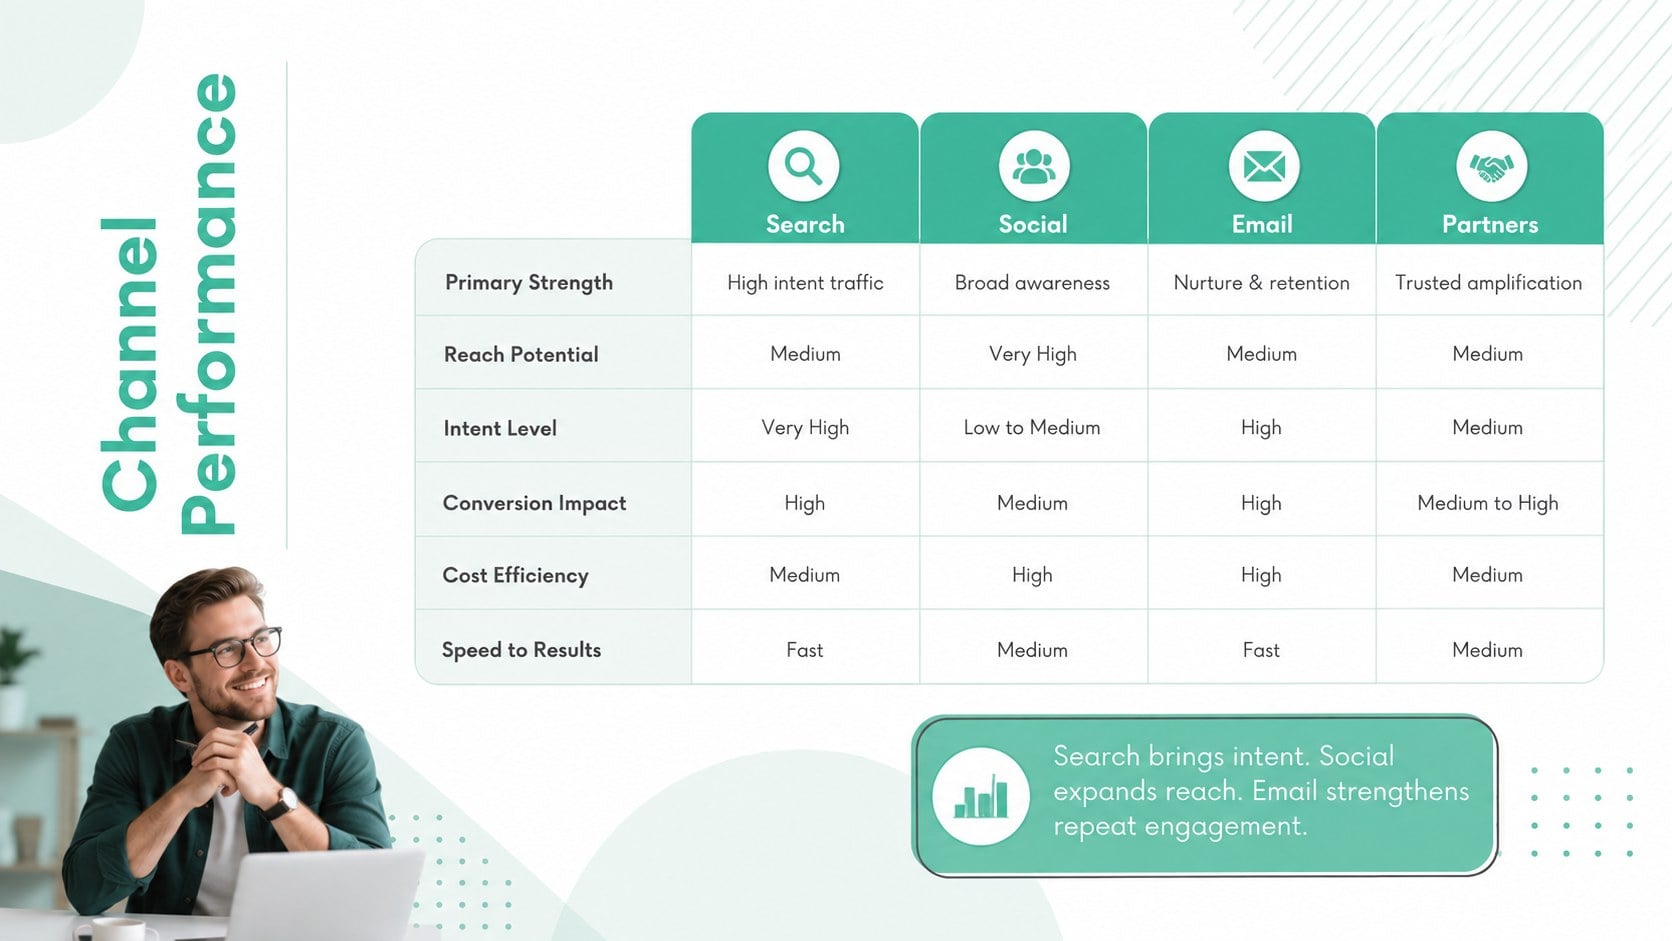
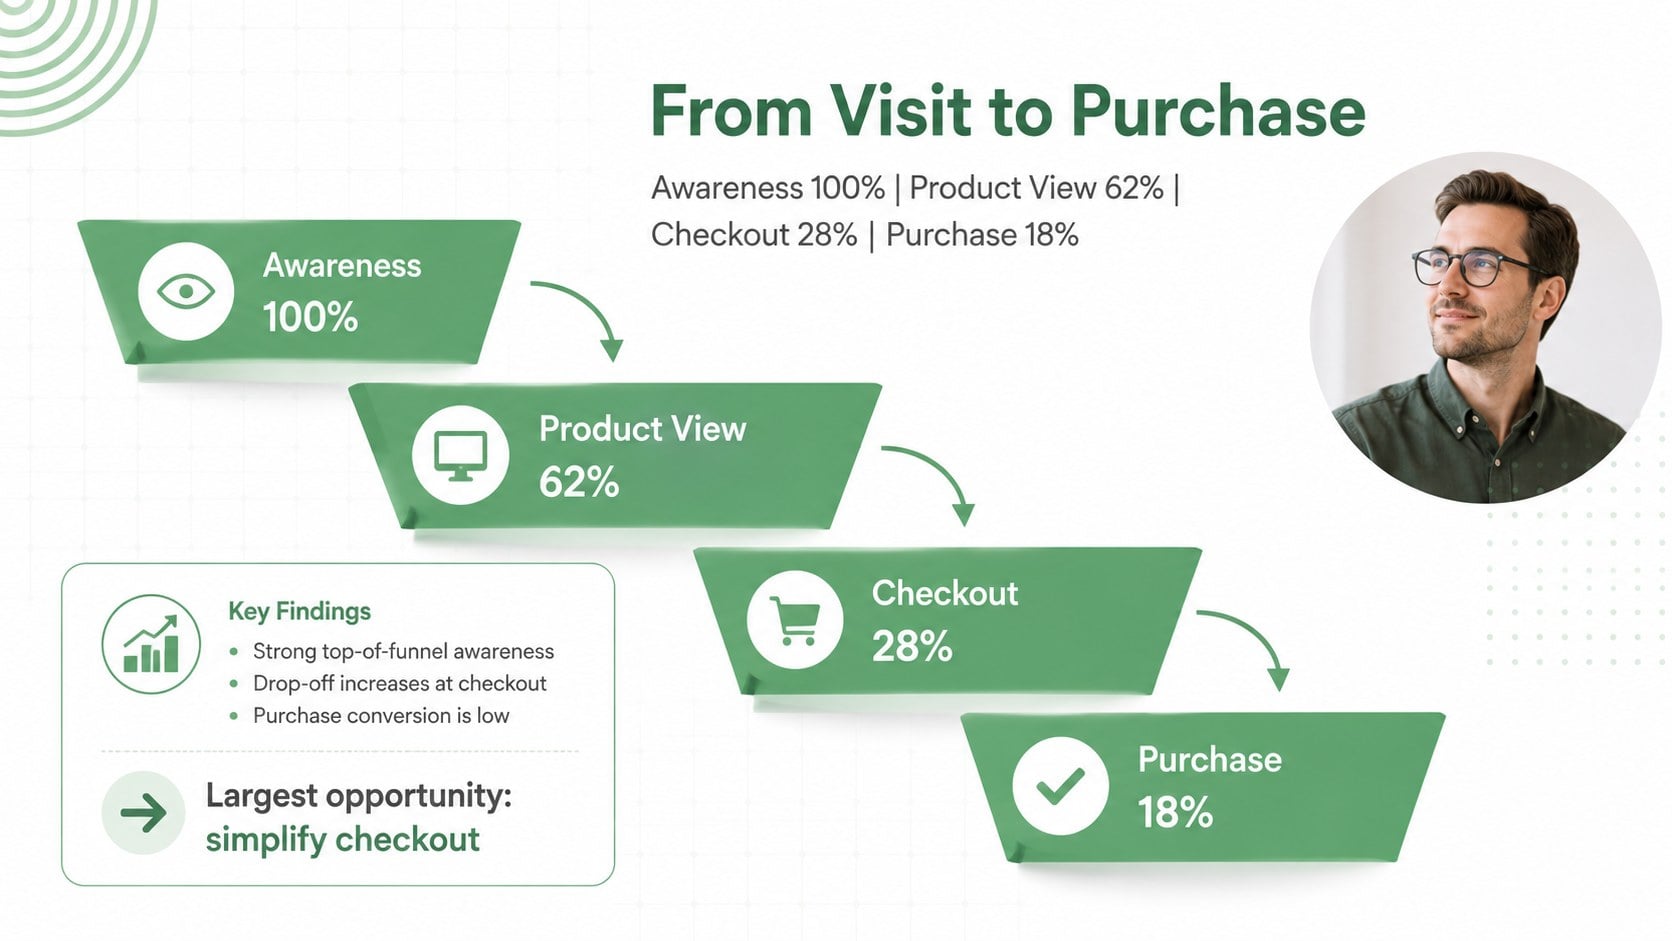
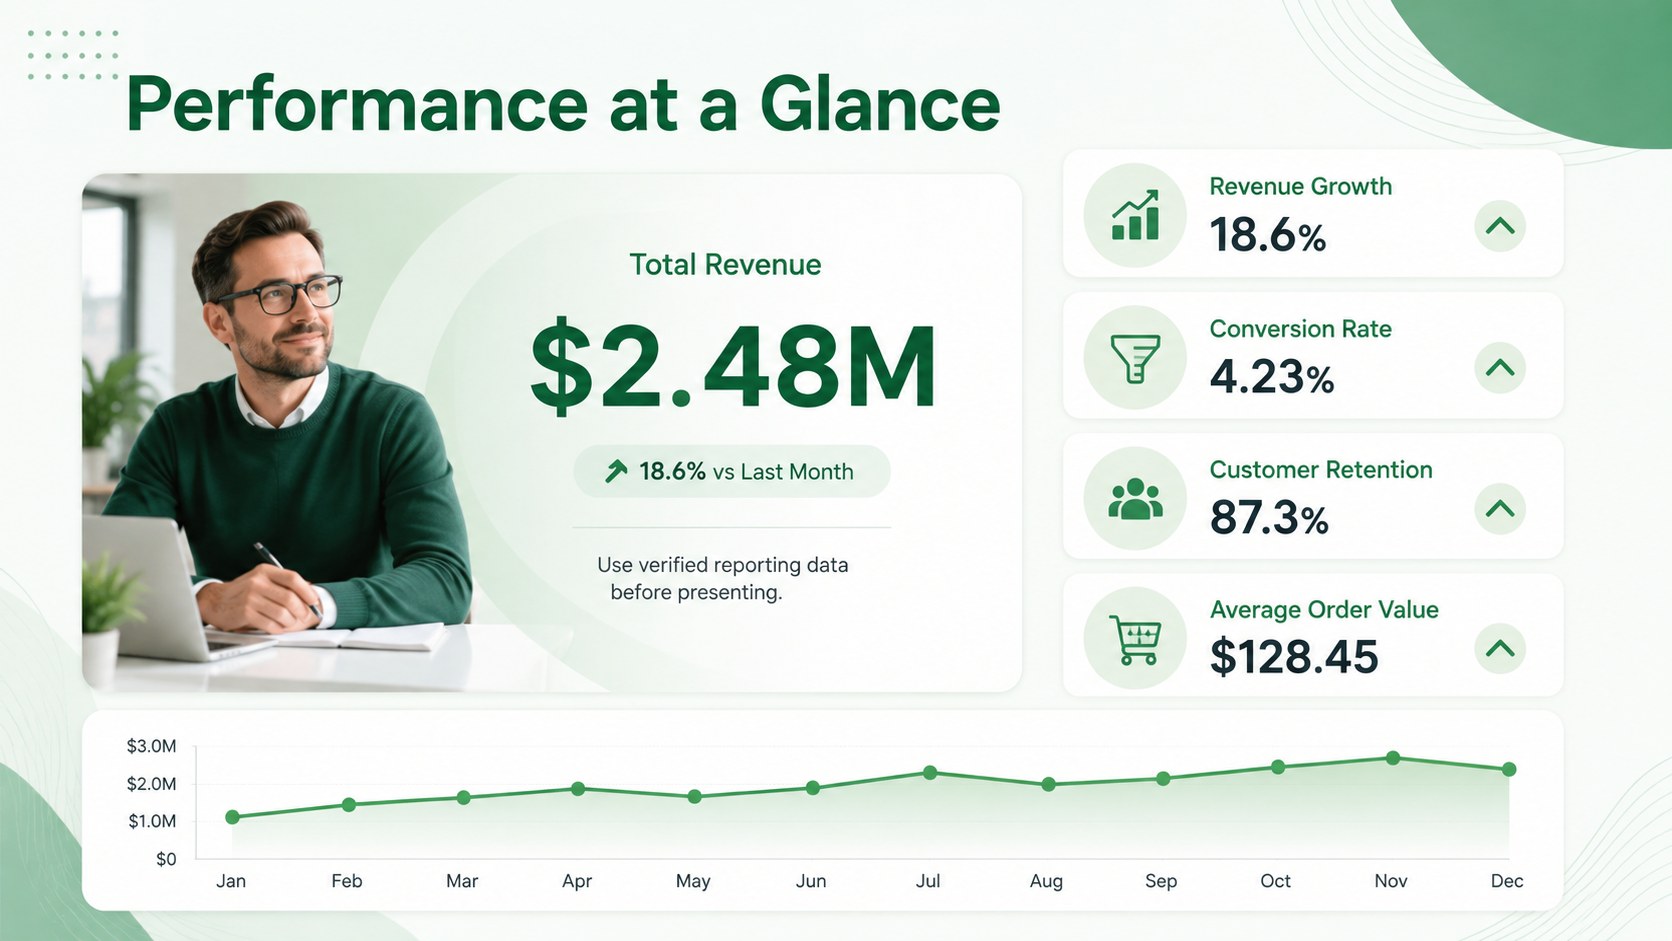
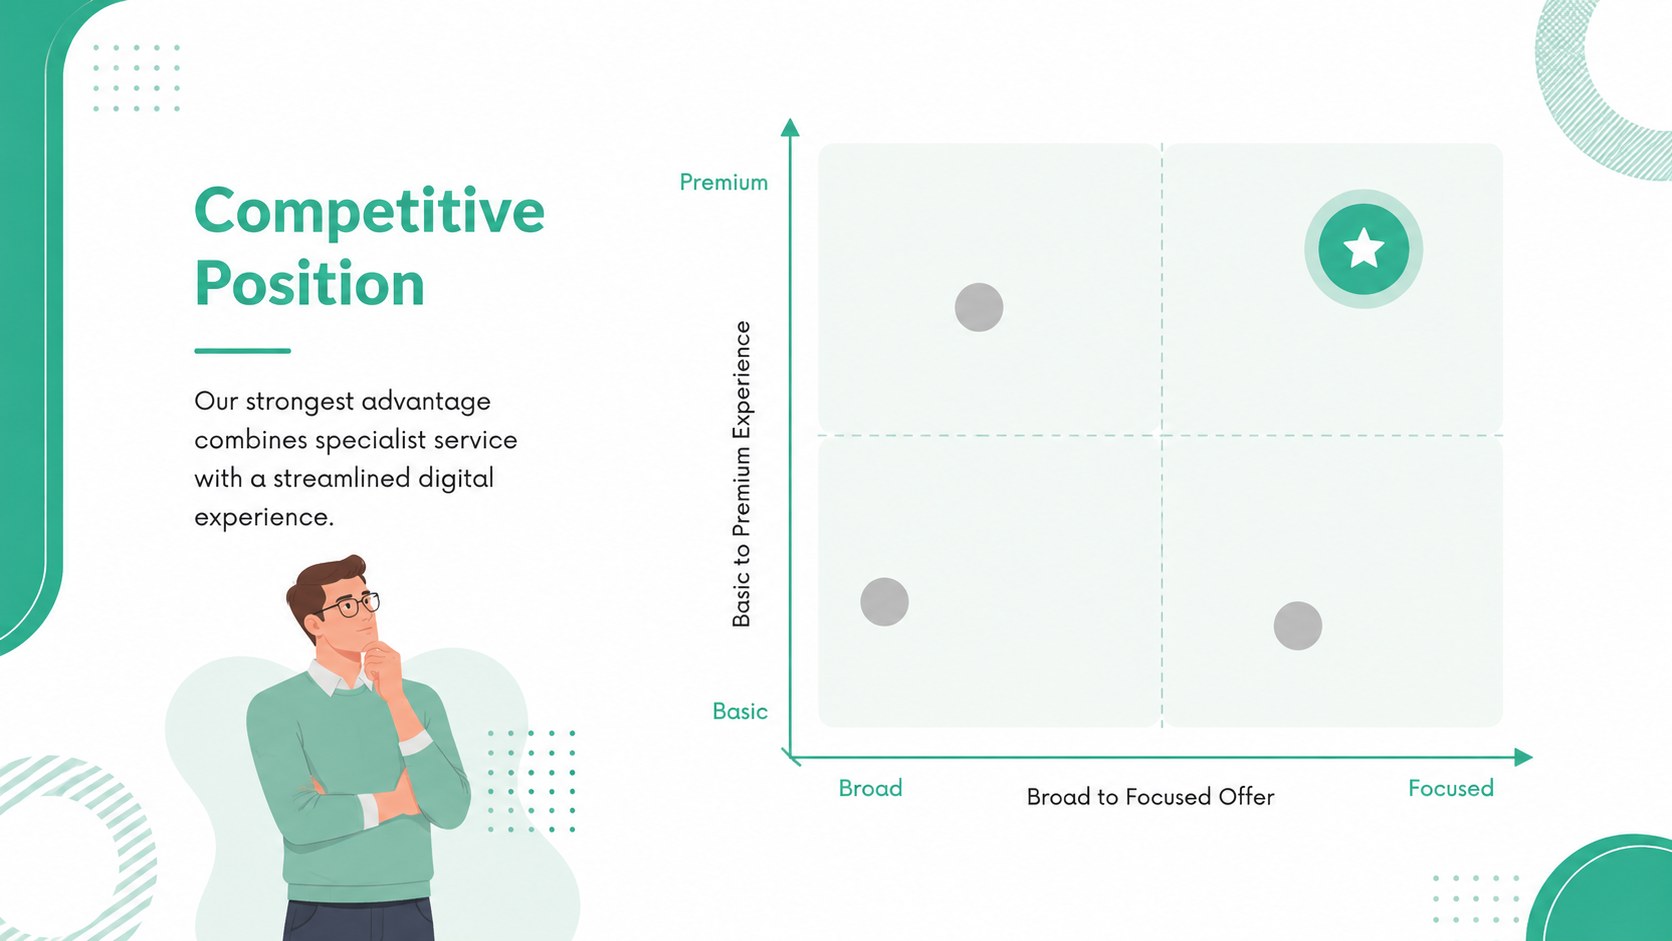
The deck includes adaptable layouts for an agenda, market snapshot, customer behavior findings, marketing channel comparisons, conversion funnel analysis, KPI reporting, competitor positioning, opportunities, risks, and an action roadmap. Use the online business performance presentation layouts to balance concise commentary with editable charts, timelines, diagrams, and data callouts. A digital commerce webinar template section also helps presenters explain sales patterns, customer journeys, and practical next steps without overwhelming the audience.
Designed for marketing teams, business analysts, consultants, retail managers, founders, and webinar hosts, these slides work in both PowerPoint and Google Slides. Adjust the colors, fonts, graphics, and data to match your organization or client. Whether you are leading a quarterly review, delivering a virtual business strategy workshop, or presenting an ecommerce growth analysis, the consistent visual system keeps attention on the evidence and the decisions that follow.
Perfect for: quarterly ecommerce review; virtual strategy workshop; marketing performance webinar; customer journey briefing; digital retail analysis; consulting recommendations meeting.
Frequently asked questions
Can I edit the charts and business data? Yes. Replace the sample figures, labels, colors, and chart elements with your own research or performance metrics. Keep the visual hierarchy consistent so comparisons remain easy to scan.
Practical details
Yes. Replace the sample figures, labels, colors, and chart elements with your own research or performance metrics. Keep the visual hierarchy consistent so comparisons remain easy to scan.
The deck is designed for PowerPoint and Google Slides. Some transitions, fonts, or chart formatting may vary slightly when moving between platforms.
Yes. Update the theme colors, typography, illustrations, and background treatments to align with your organization or client. Master layouts can be used to apply recurring changes efficiently.
Yes. The concise text blocks, clear section breaks, and data-focused layouts support screen sharing and live narration. Presenter notes can be added in PowerPoint or Google Slides for talking points.
Keep exploring
15Use this astrology audience insights deck to present zodiac-based segments, behaviors, and campaign findings in polished black-and-gold slides.
 14
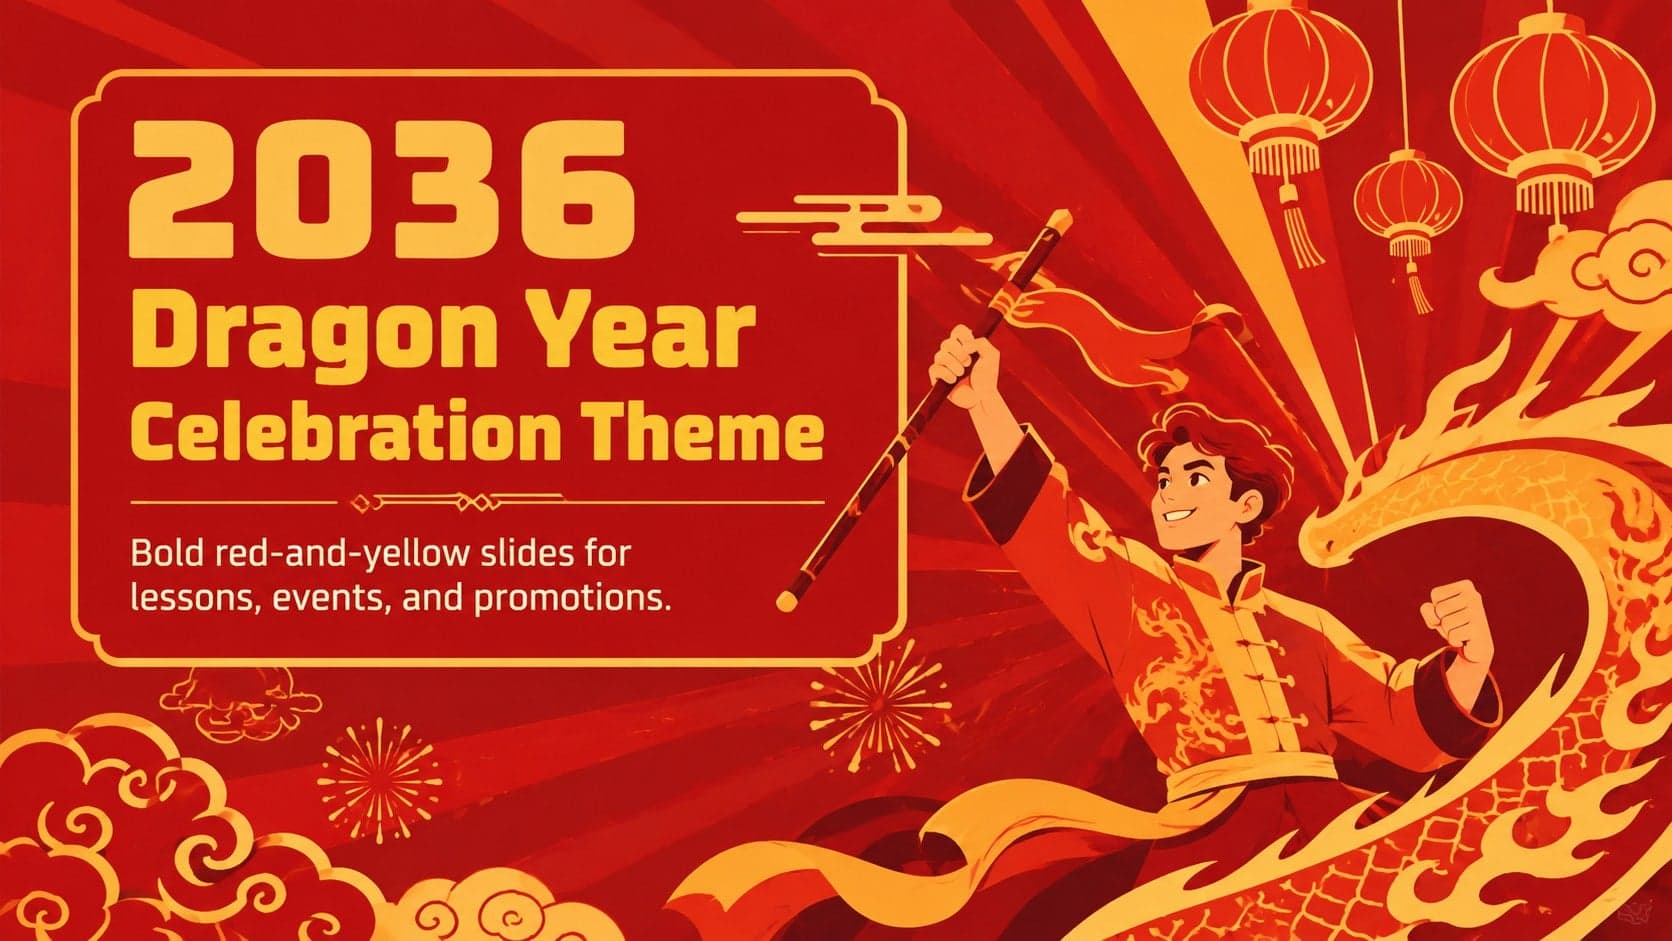
Plan a memorable Lunar New Year campaign with the 2036 Dragon Year Celebration Theme, featuring bold red-and-yellow slides for lessons and events.
 15
Build eerie lessons, campaigns, and story pitches with an undead survival scenario theme featuring editable slides for PowerPoint and Google Slides.
 15
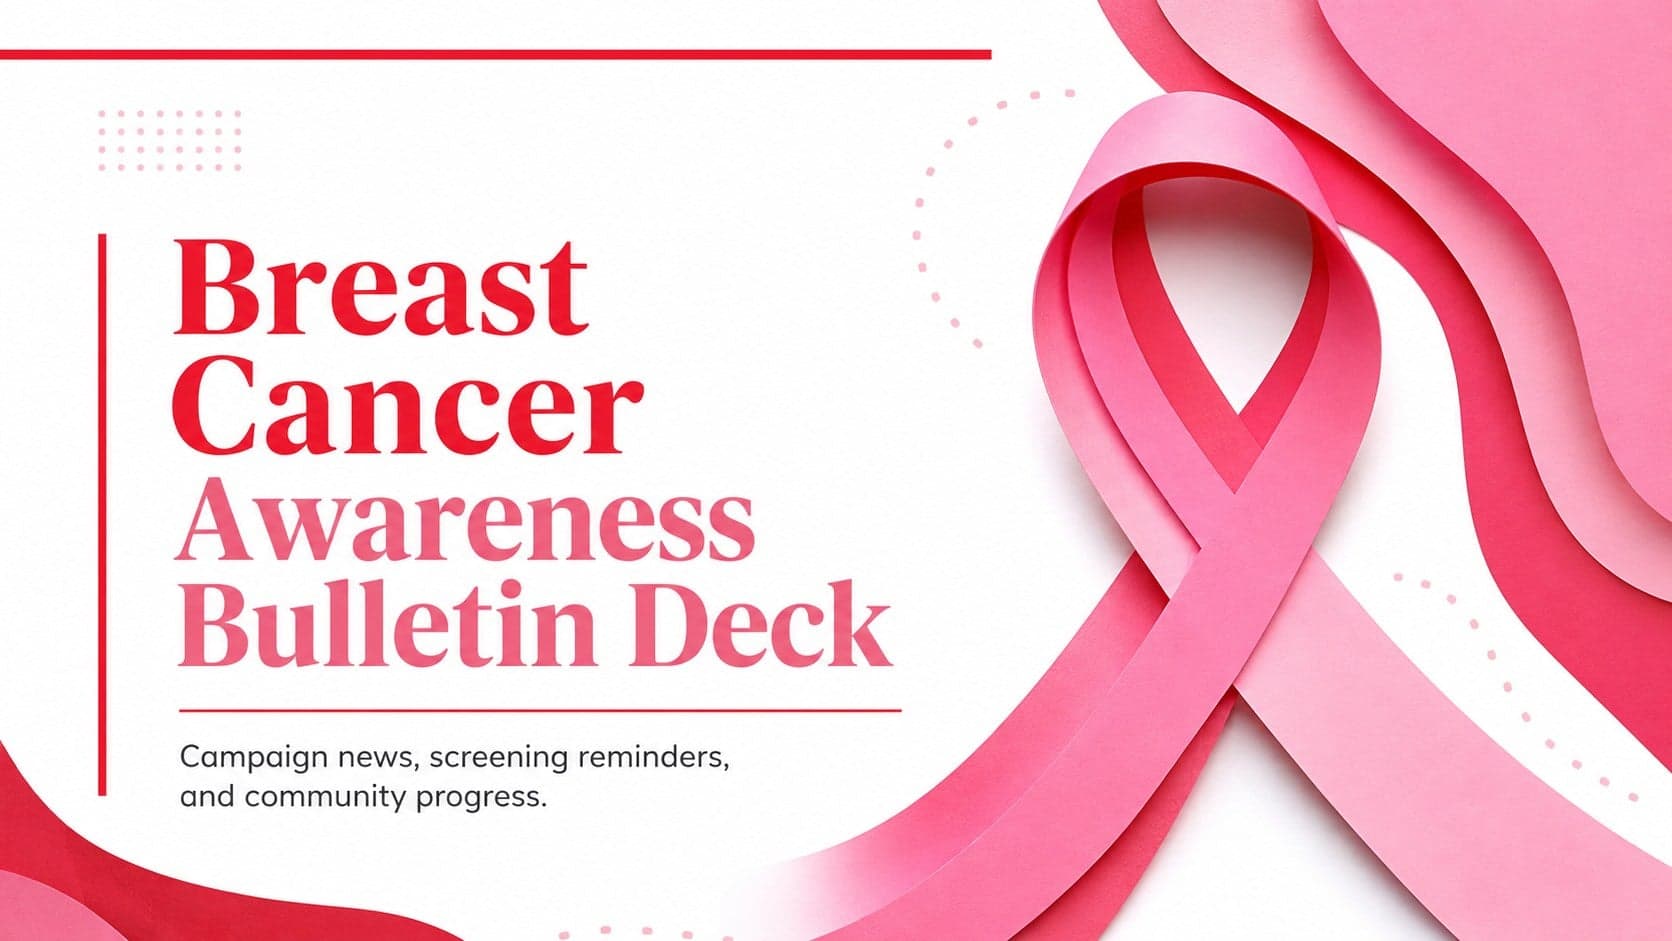
Build a clear breast cancer awareness bulletin with bold pink-and-red slides for campaign news, screening reminders, impact data, and community updates.
 15
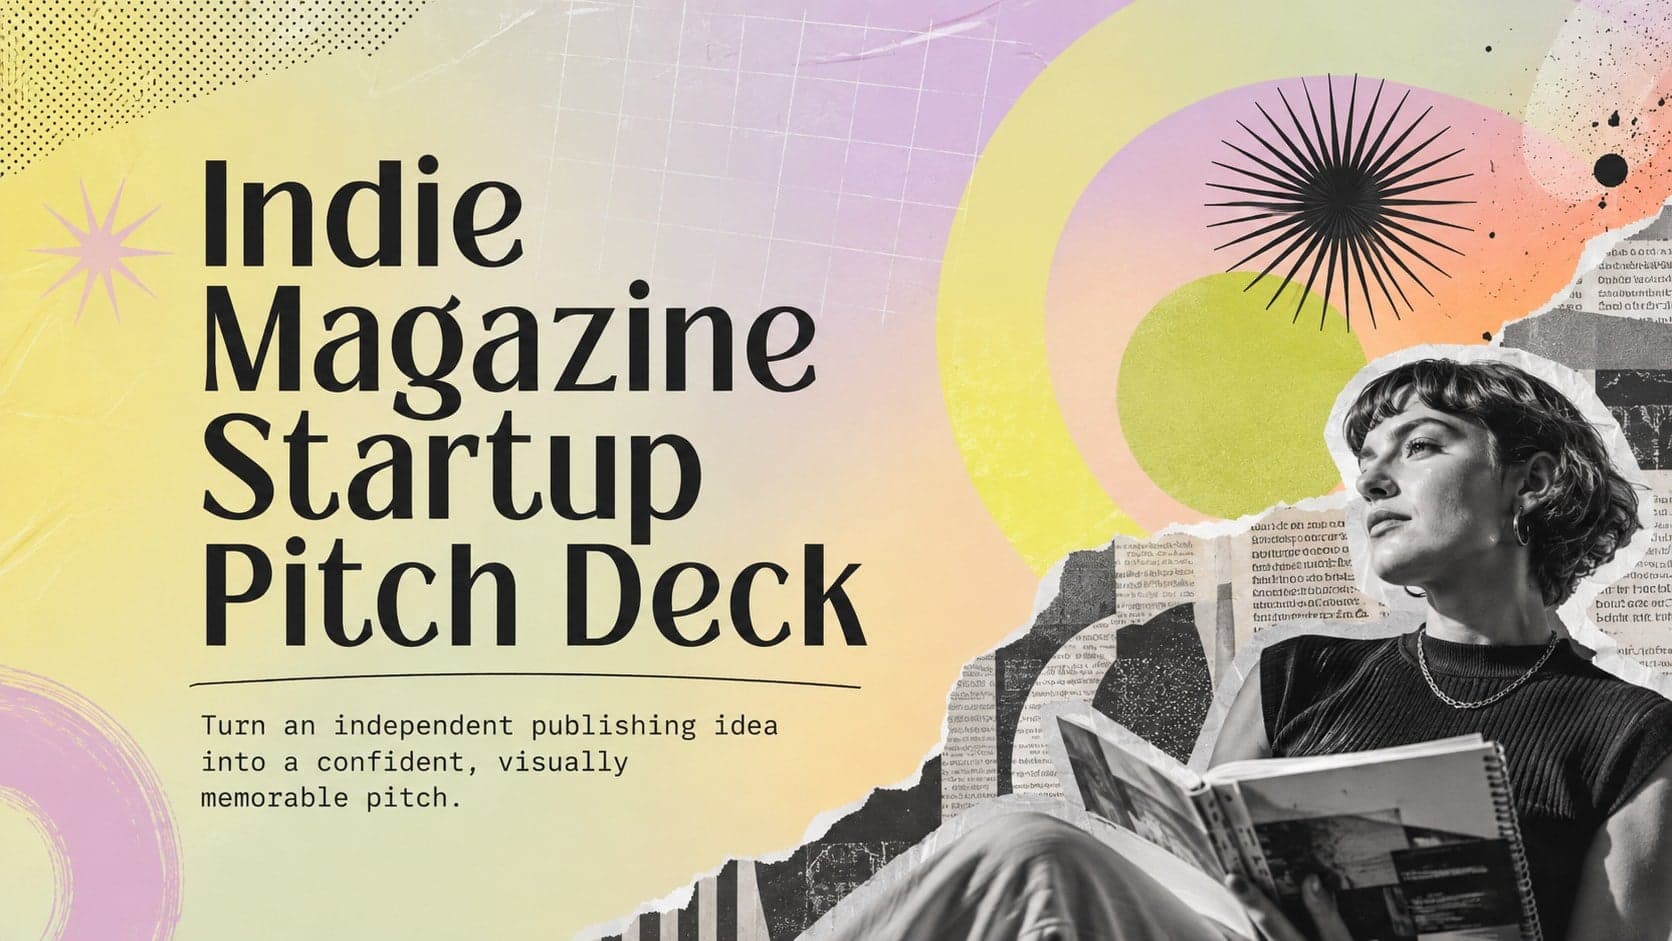
Shape your publishing concept with an indie magazine startup pitch deck featuring pastel gradients, bold collage layouts, and editable planning slides.
 15
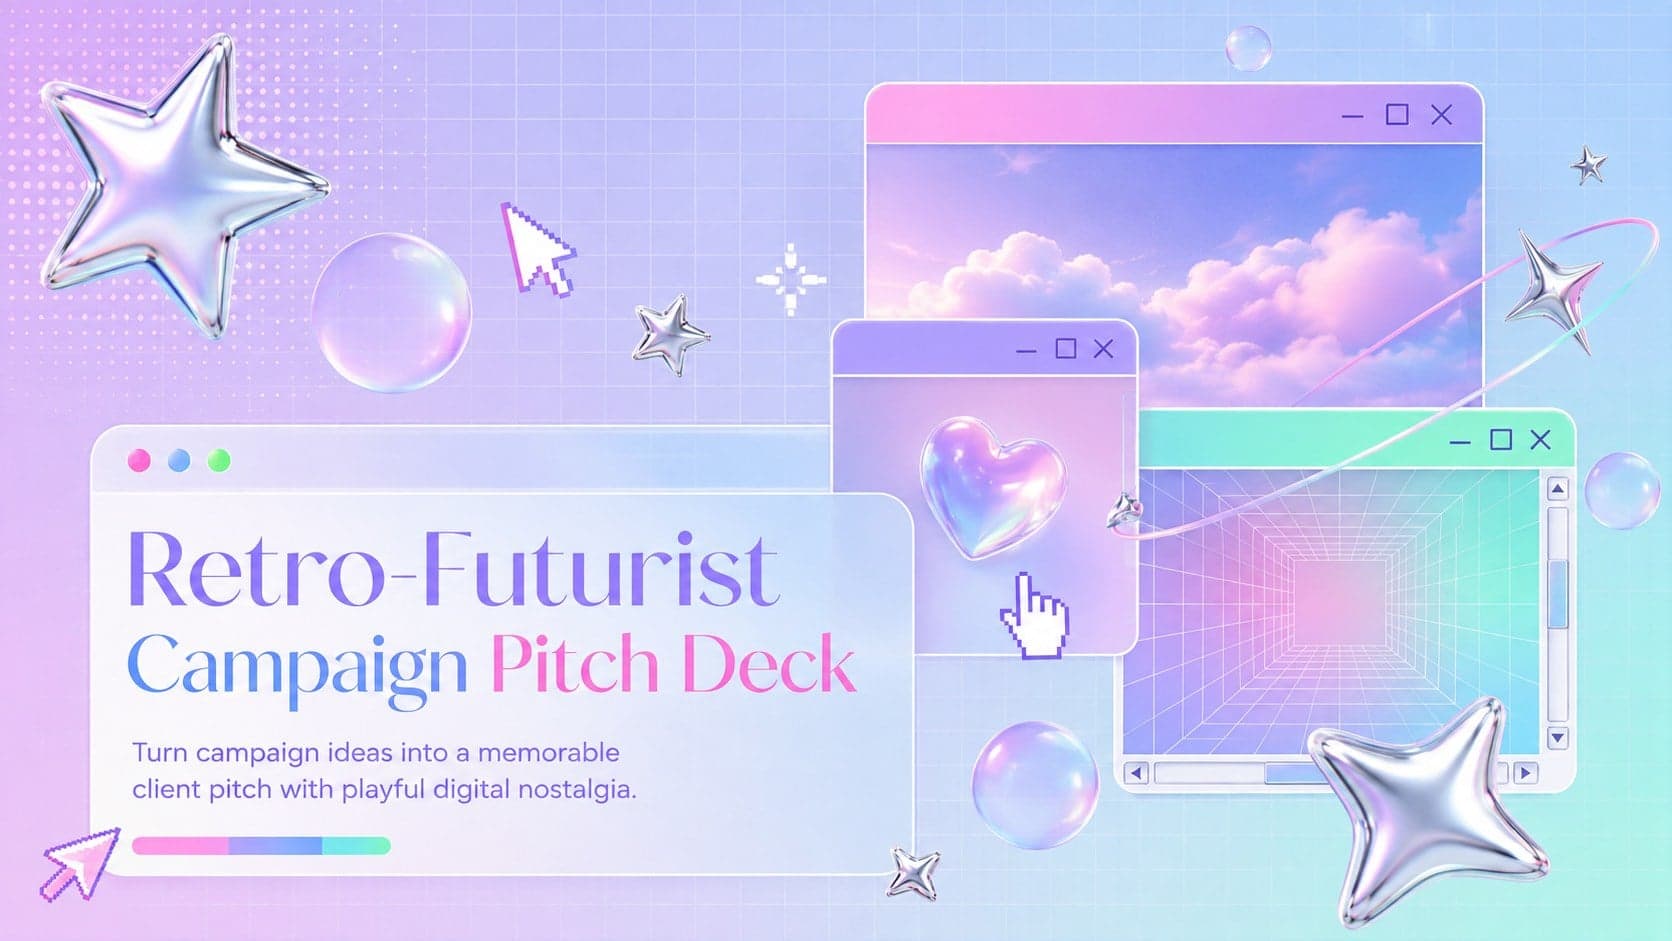
Build a bold retro-futurist campaign pitch deck for client meetings, with editable strategy layouts and playful pastel Y2K-inspired visuals.
 16
Build a consistent presence with a social channel identity playbook covering voice, visuals, content formats, publishing rules, and approvals.
 15
Celebrate online learners with webinar completion certificate slides, featuring editable violet artwork for university events in PowerPoint and Google Slides.