
 15
15presentation
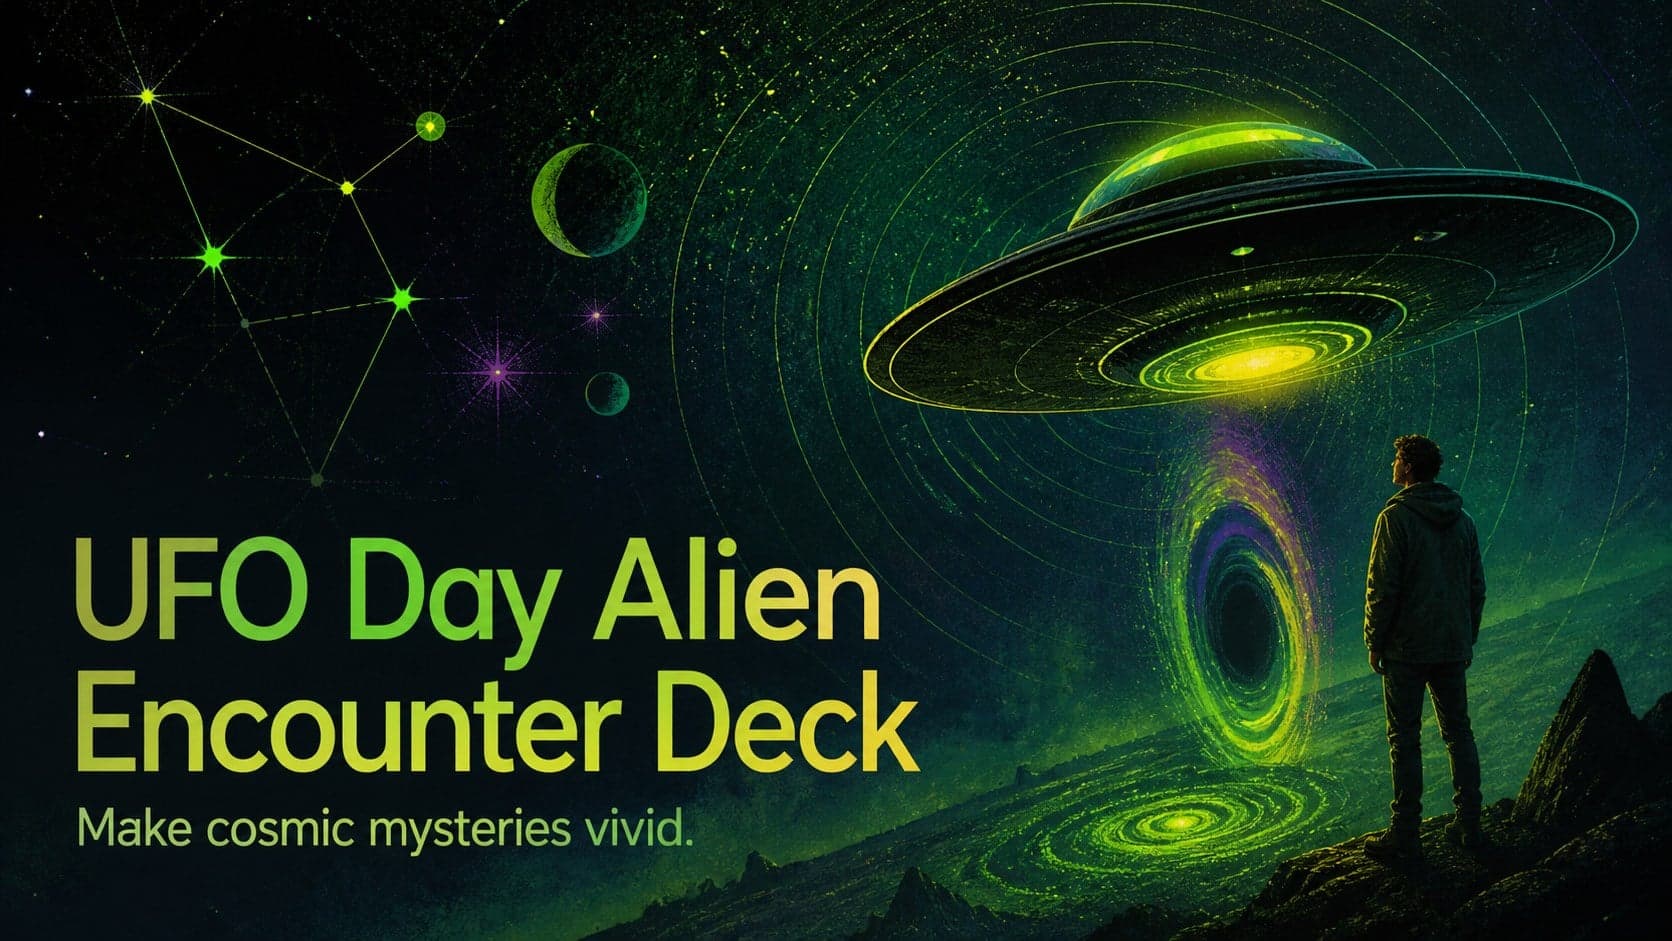
UFO Day Alien Encounter Deck
Build a bold cosmic story with this UFO Day alien encounter deck, featuring surreal green-and-black layouts for PowerPoint and Google Slides events.
Google SlidesPowerPoint
presentation · English
Turn complex technology reports into clear visual narratives with neon tech infographic slides for PowerPoint and Google Slides, ready to customize.



Design notes
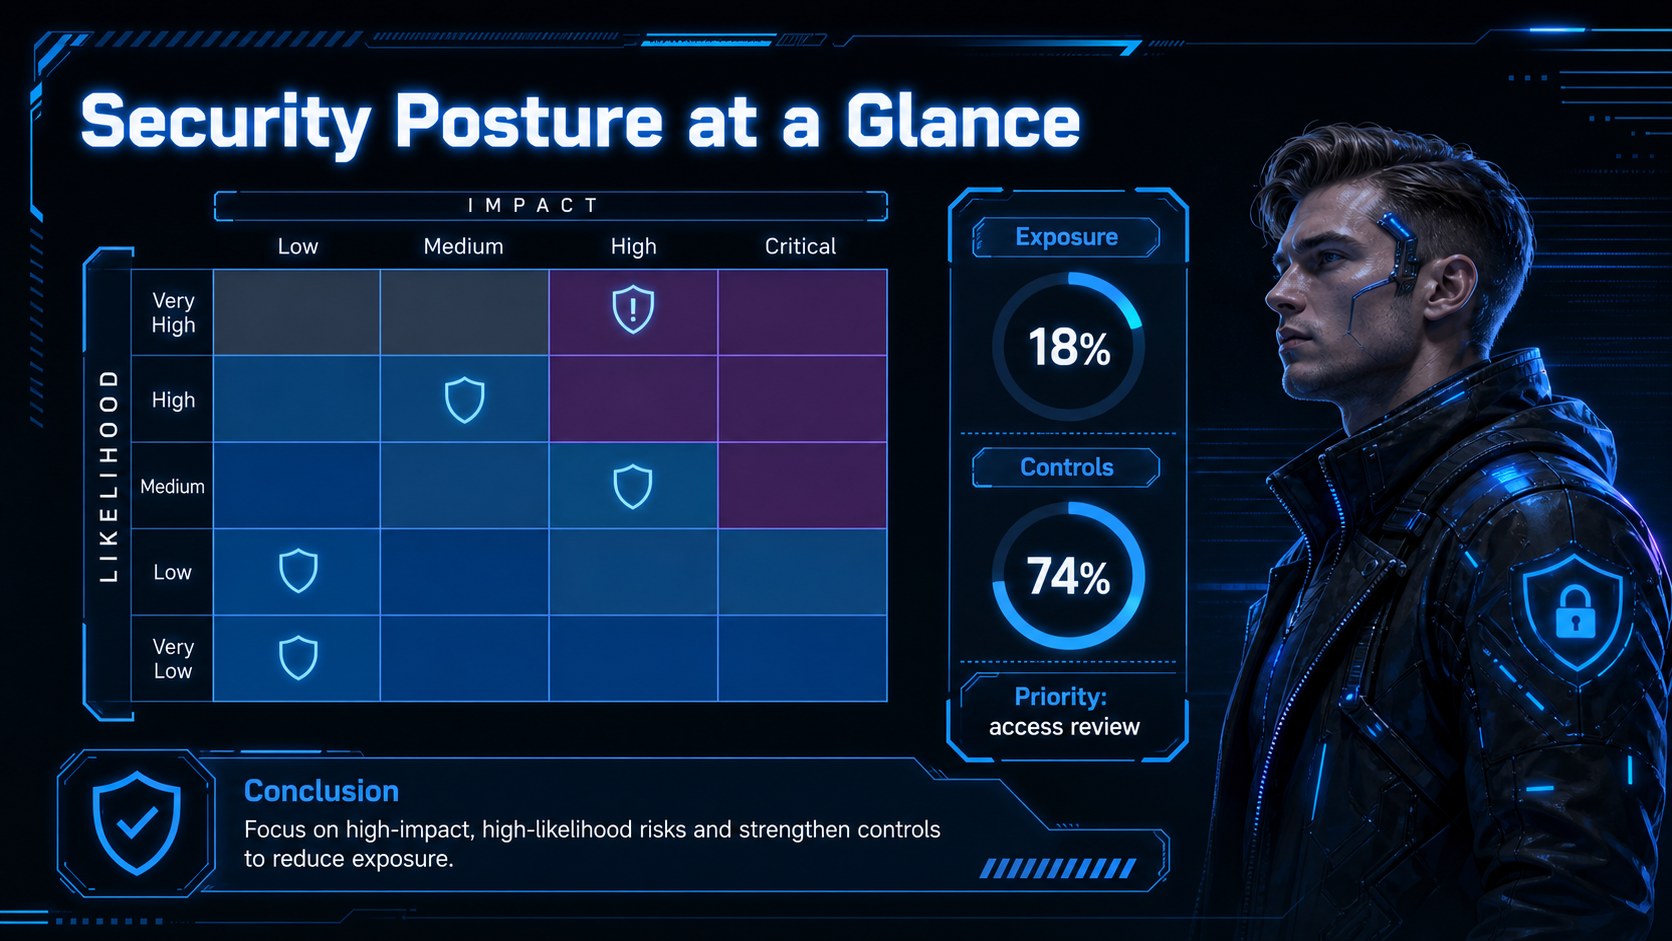
Neon tech infographic slides for data stories give technology-focused presentations a sharp, high-impact visual system. The electric blue palette, dark cyberpunk atmosphere, glowing lines, and structured data layouts help audiences follow complex information without losing the energy of a modern digital theme. Use the deck to explain emerging tech trends, compare performance metrics, outline a security program, present a product roadmap, or make a digital transformation strategy more memorable.
The presentation includes more than 25 editable slide layouts with charts, comparison panels, timeline structures, KPI blocks, process diagrams, image frames, and section dividers. It is designed for PowerPoint and Google Slides, so you can adjust text, colors, icons, diagrams, and data to fit your project. The layouts also work well as technology trend presentation templates, cybersecurity report slides, or a digital strategy pitch deck.
This resource is suited to startup teams, IT consultants, product managers, cybersecurity professionals, educators, students, and digital marketers. Use the reusable visual components to turn research into an executive briefing, classroom lesson, client proposal, or internal planning session. The bold neon treatment adds personality while the consistent grid keeps every message organized and presentation-ready.
Perfect for: startup technology pitch; cybersecurity status report; digital transformation briefing; IT classroom lesson; product roadmap review.
Frequently asked questions
Which presentation platforms are supported? The template is designed for PowerPoint and Google Slides. You can edit the deck in either platform and export it in common presentation or PDF formats.
Practical details
The template is designed for PowerPoint and Google Slides. You can edit the deck in either platform and export it in common presentation or PDF formats.
Yes. Replace the blue accents, background tones, fonts, icons, images, and sample data with your own visual system. The layouts are built to keep charts and text aligned as you make changes.
Yes. It includes KPI panels, comparison layouts, process diagrams, charts, timelines, and roadmap slides for organizing detailed information. Keep each slide focused on one conclusion for the clearest result.
Yes. The visual structure works for technology lessons, research summaries, project reviews, and classroom presentations. Editable diagrams make technical subjects easier to present in a structured way.
Keep exploring
15Build a bold cosmic story with this UFO Day alien encounter deck, featuring surreal green-and-black layouts for PowerPoint and Google Slides events.
 16
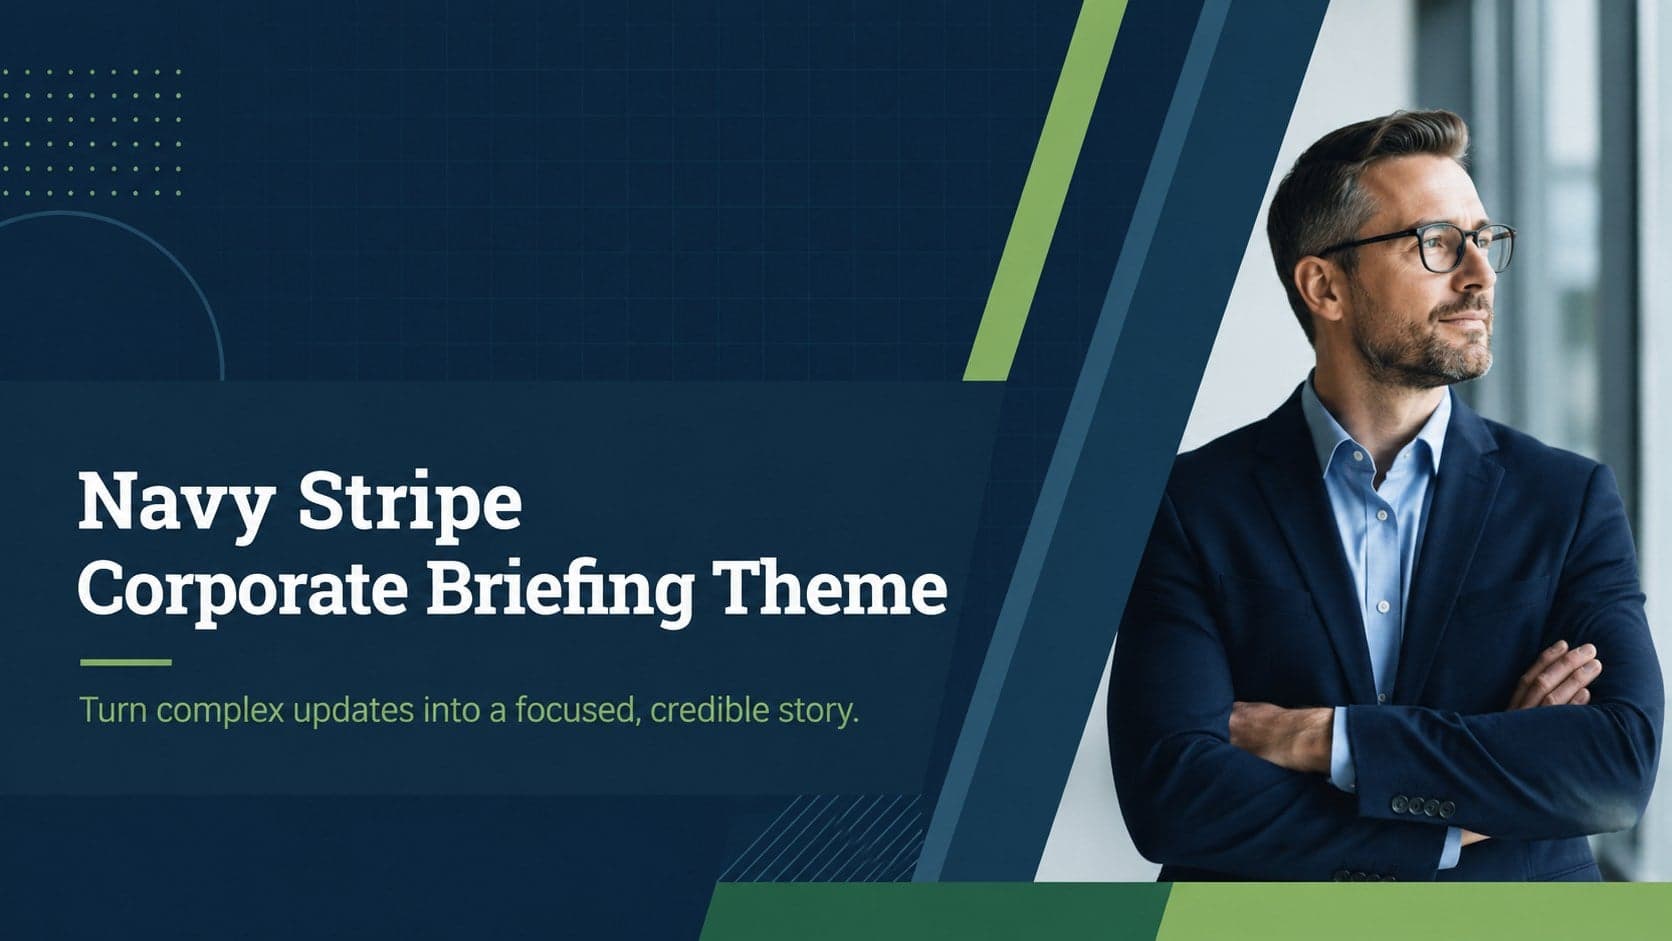
16Use the Navy Stripe Corporate Briefing Theme to present plans, results, and proposals with credible blue-green layouts for PowerPoint and Google Slides.
 5
5Turn customer research into clear decisions with product experience mapping slides in a dark navy and green style for PowerPoint and Google Slides.
 16
16Win stakeholder approval with website launch proposal slides that organize strategy, UX, rollout, and results in editable PowerPoint and Google Slides formats.
 15
15Build clearer campaign plans with an AI marketing strategy deck featuring neon blue-green visuals, editable workflows, data slides, and practical examples.
 15
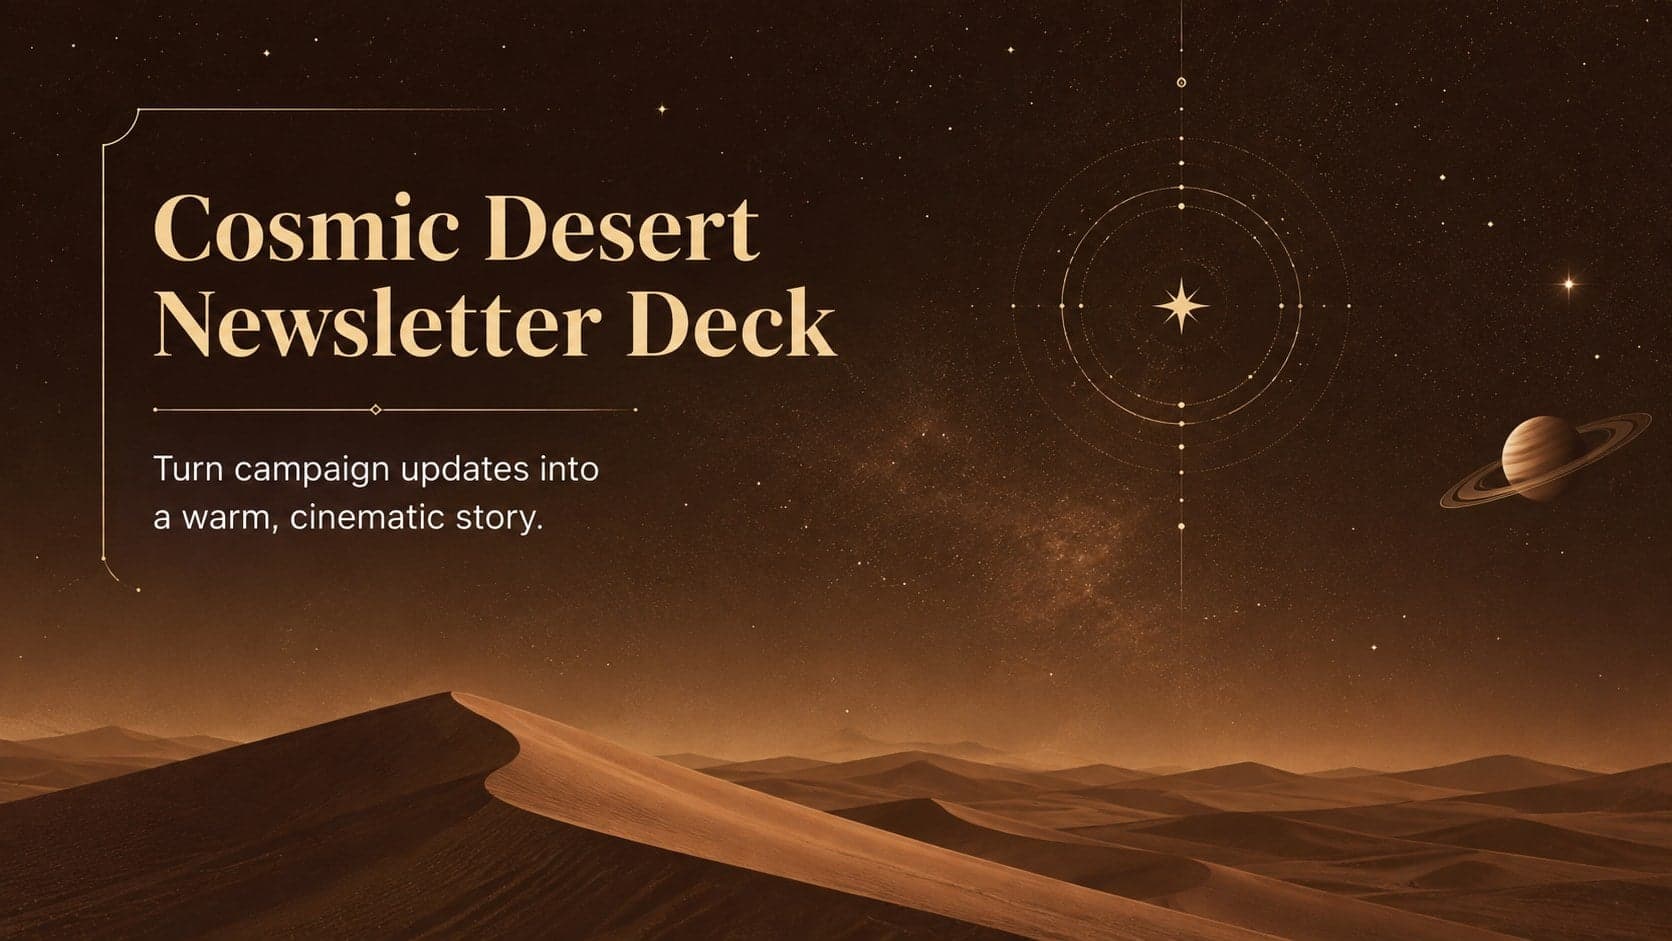
15Build memorable campaign updates with a Cosmic Desert Newsletter Deck, featuring warm beige-brown slides for PowerPoint and Google Slides teams.
 15
15Lead productive urban-tech meetings with a smart city business briefing deck in vivid violet and pink, ready to edit in PowerPoint or Google Slides.
 16
16Build a lively sales story with the Interactive Tech Product Showcase, using colorful illustrated layouts made for PowerPoint and Google Slides.