
 15
presentation
Astrology Audience Insights Deck
Use this astrology audience insights deck to present zodiac-based segments, behaviors, and campaign findings in polished black-and-gold slides.
Google SlidesPowerPoint
presentation · English
Run a sharper webinar with the Neon Online Business Performance Audit Deck, designed to clarify digital metrics in bold PowerPoint and Google Slides layouts.

Design notes
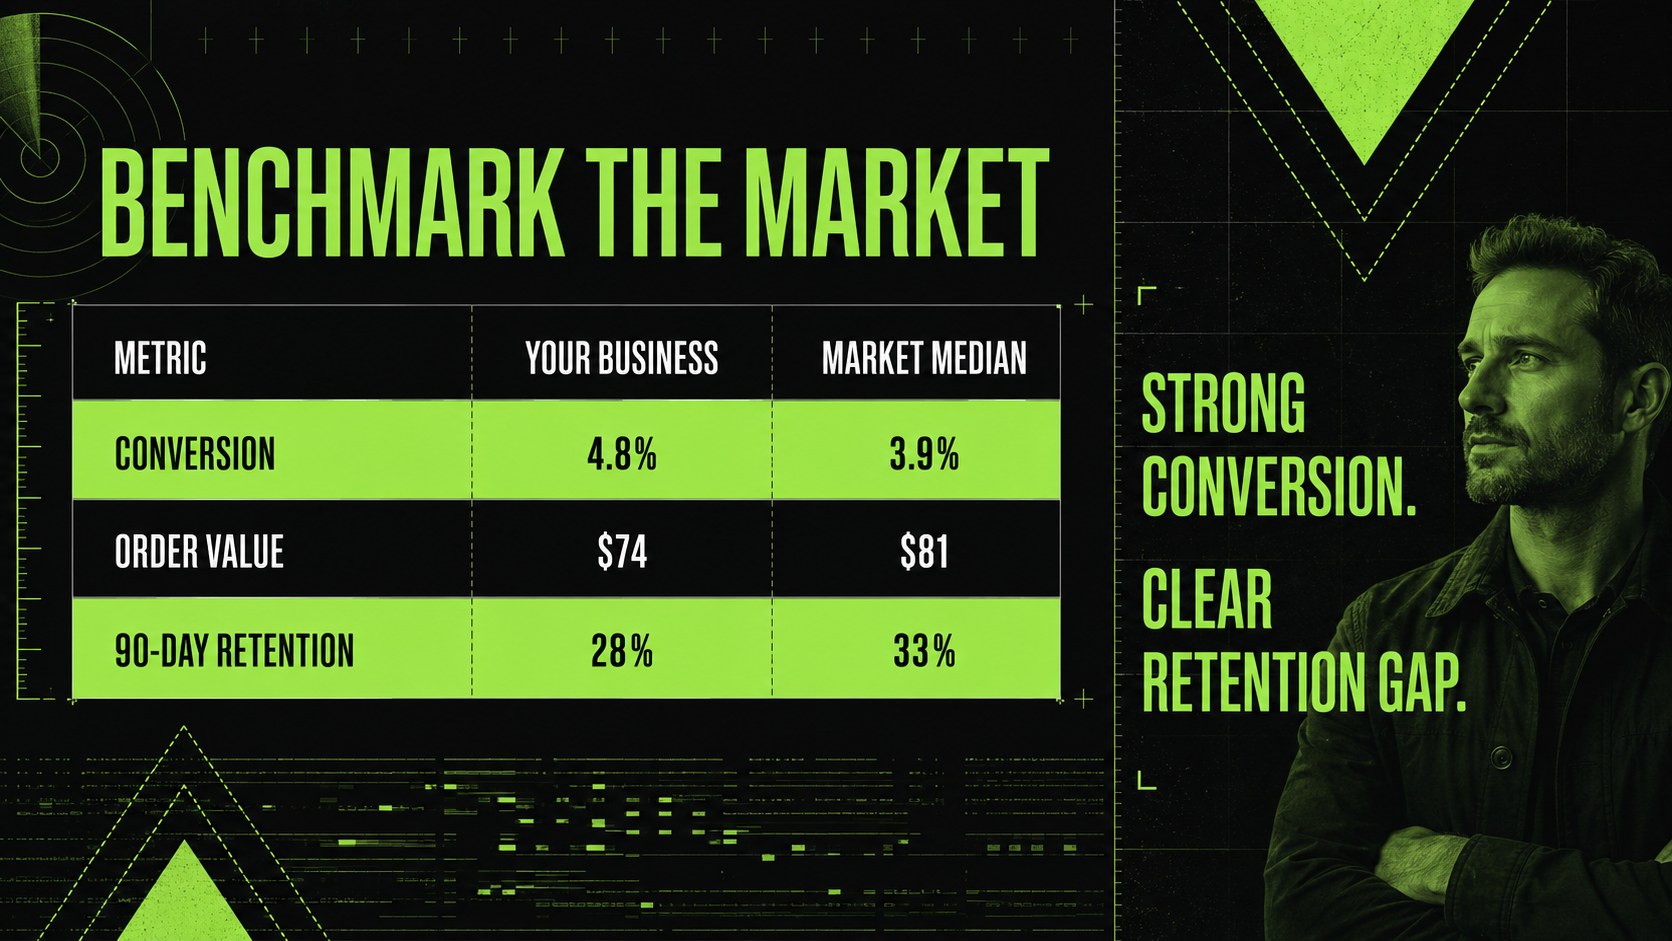
The Neon Online Business Performance Audit Deck helps consultants, founders and marketing teams turn scattered digital data into a compelling webinar narrative. Its black-and-neon-green palette, acid-brutalist typography and energetic graphic treatments give performance findings a bold visual identity without sacrificing clarity. Use it for a live website conversion audit webinar, a recorded strategy session or an internal review of online operations.
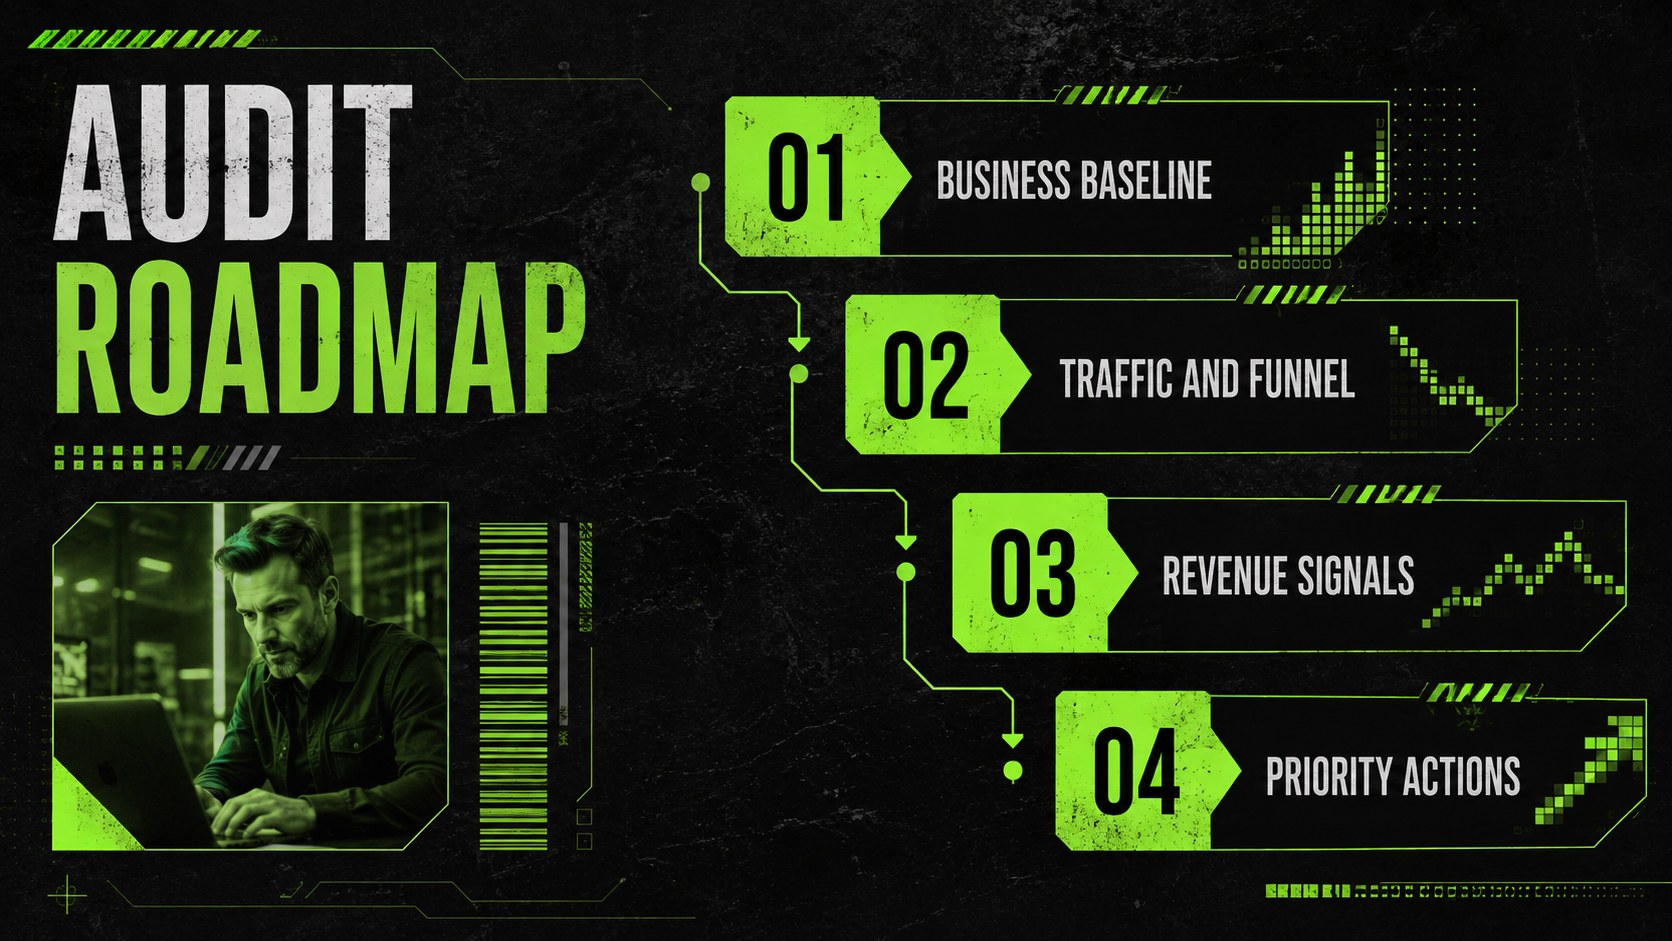
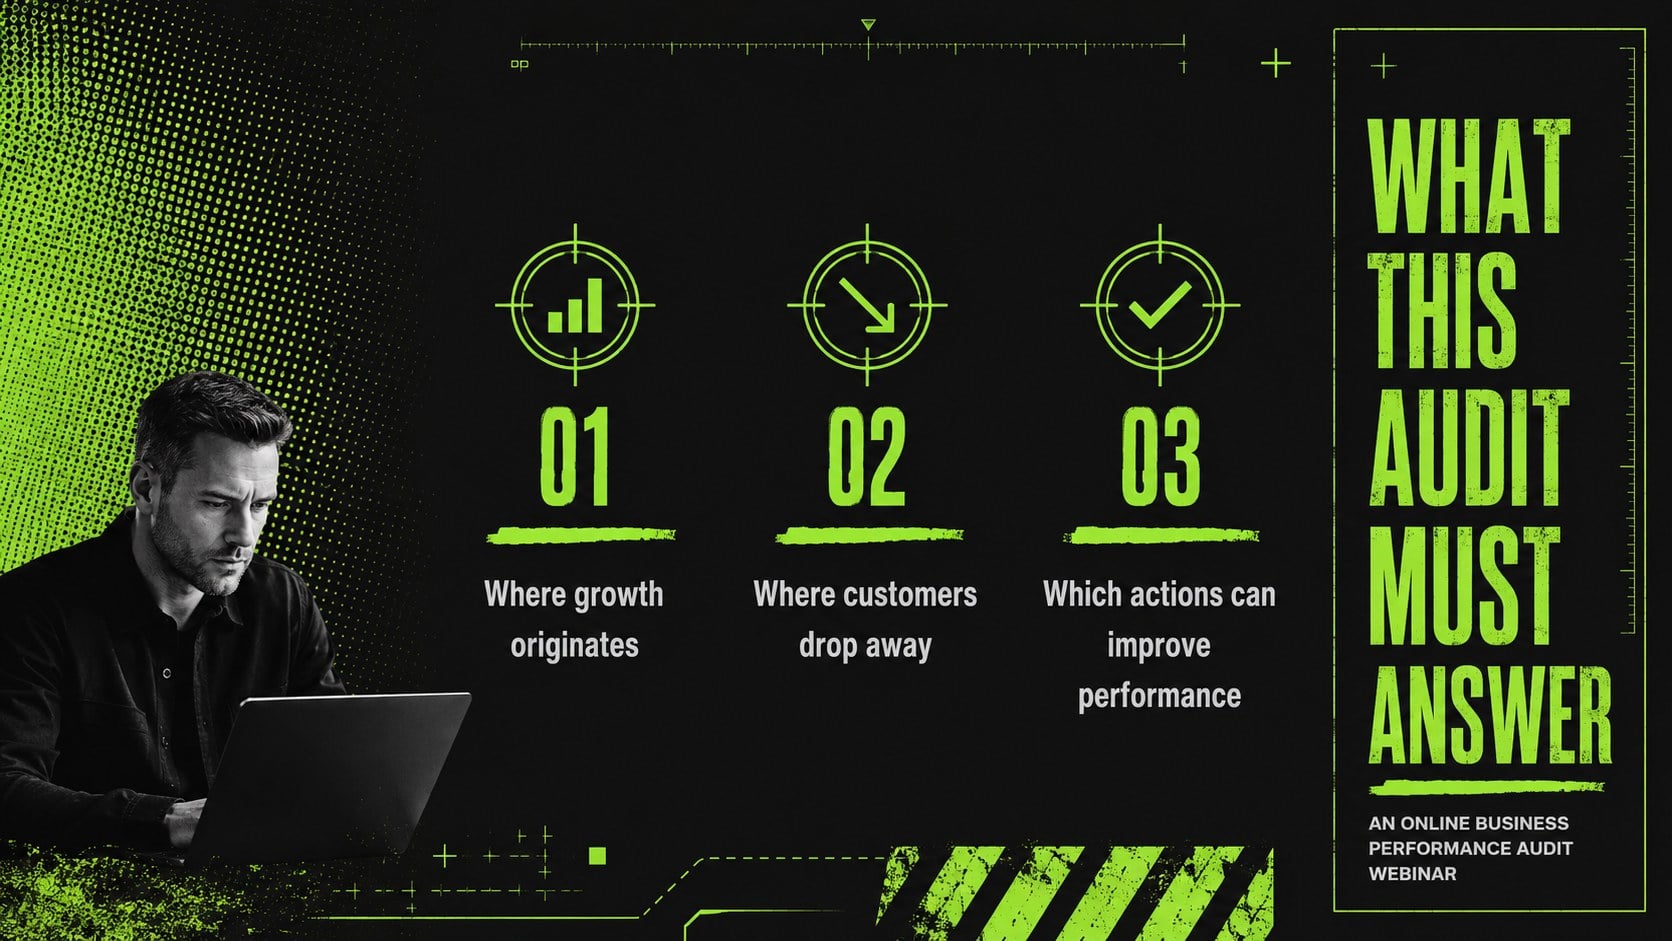
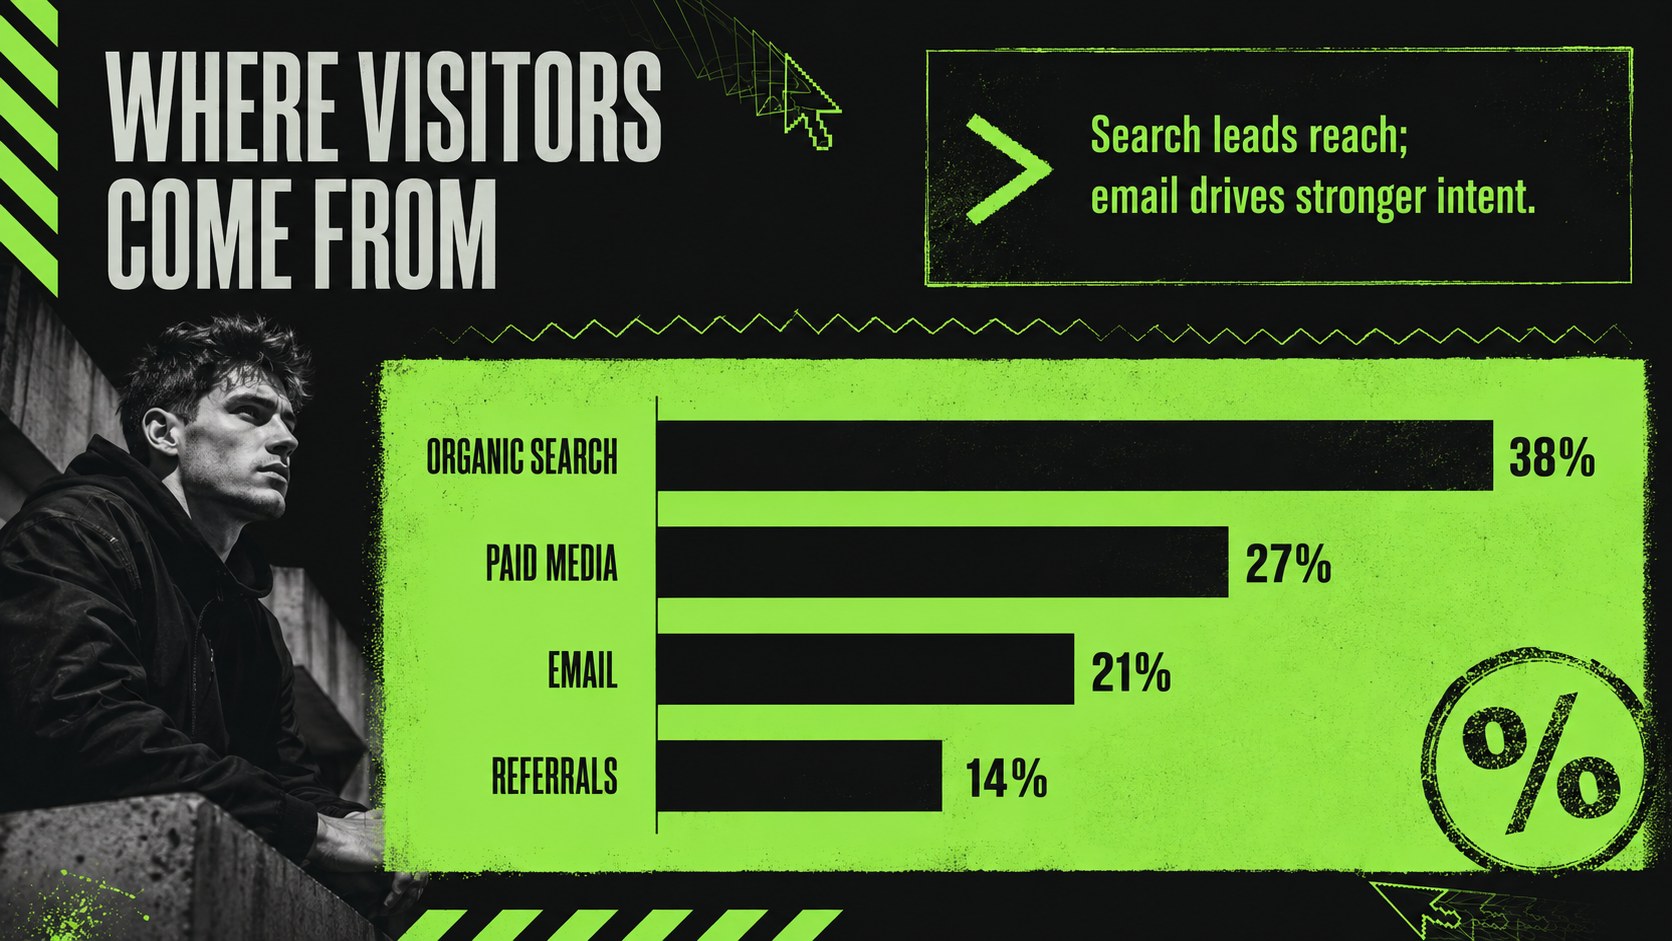
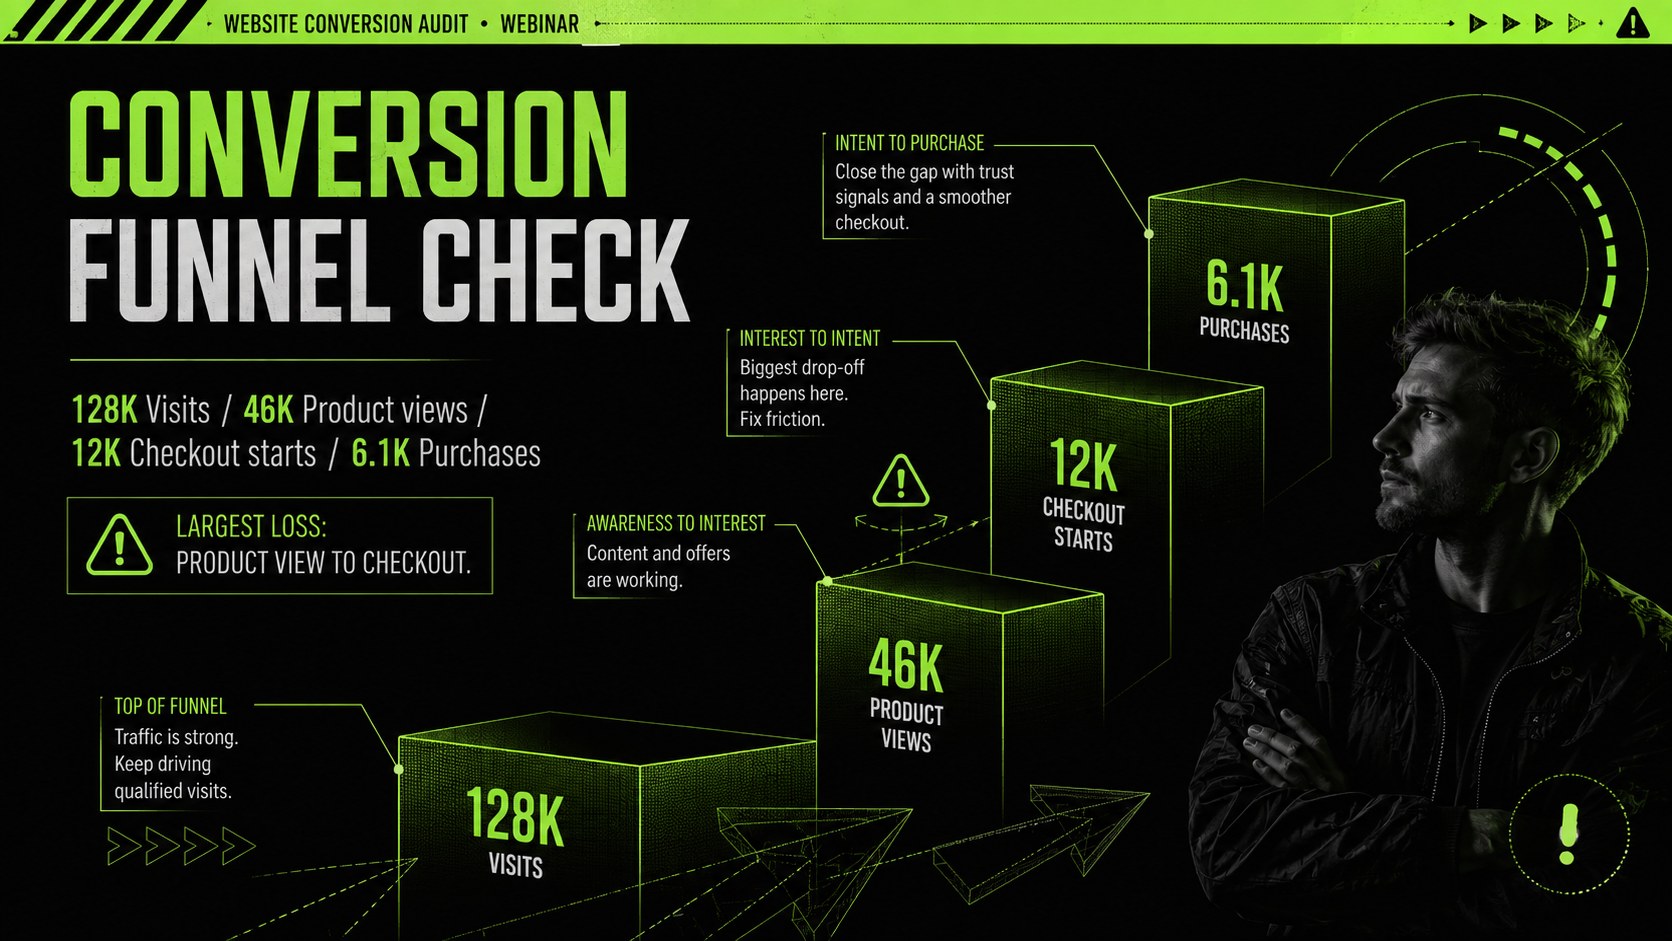
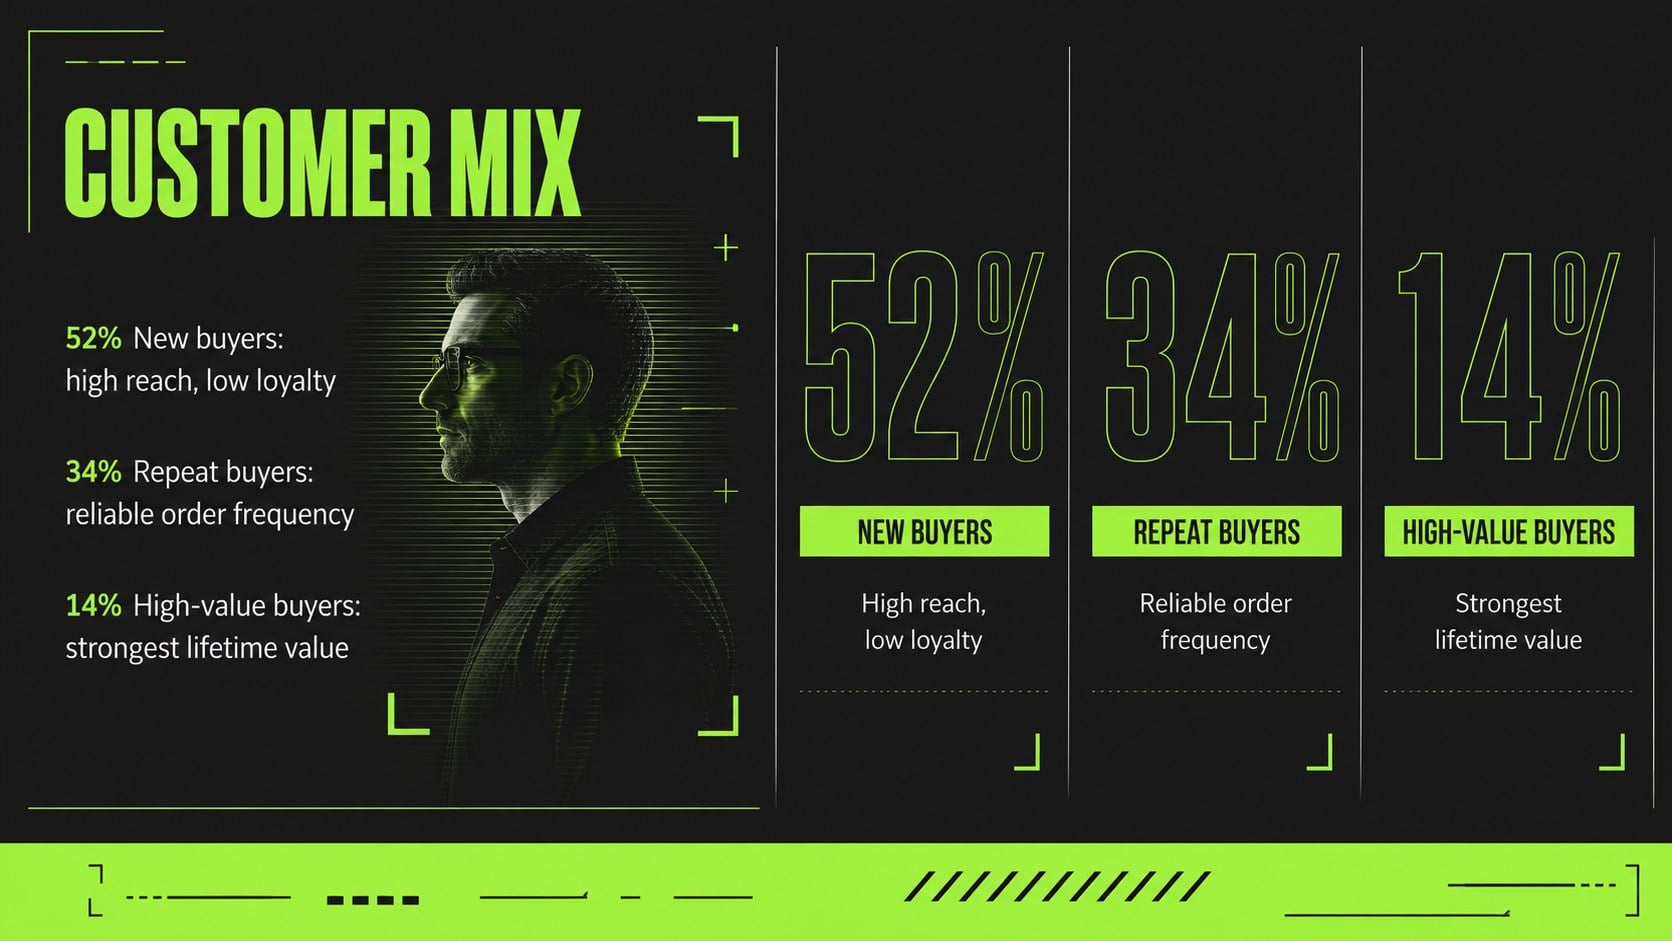
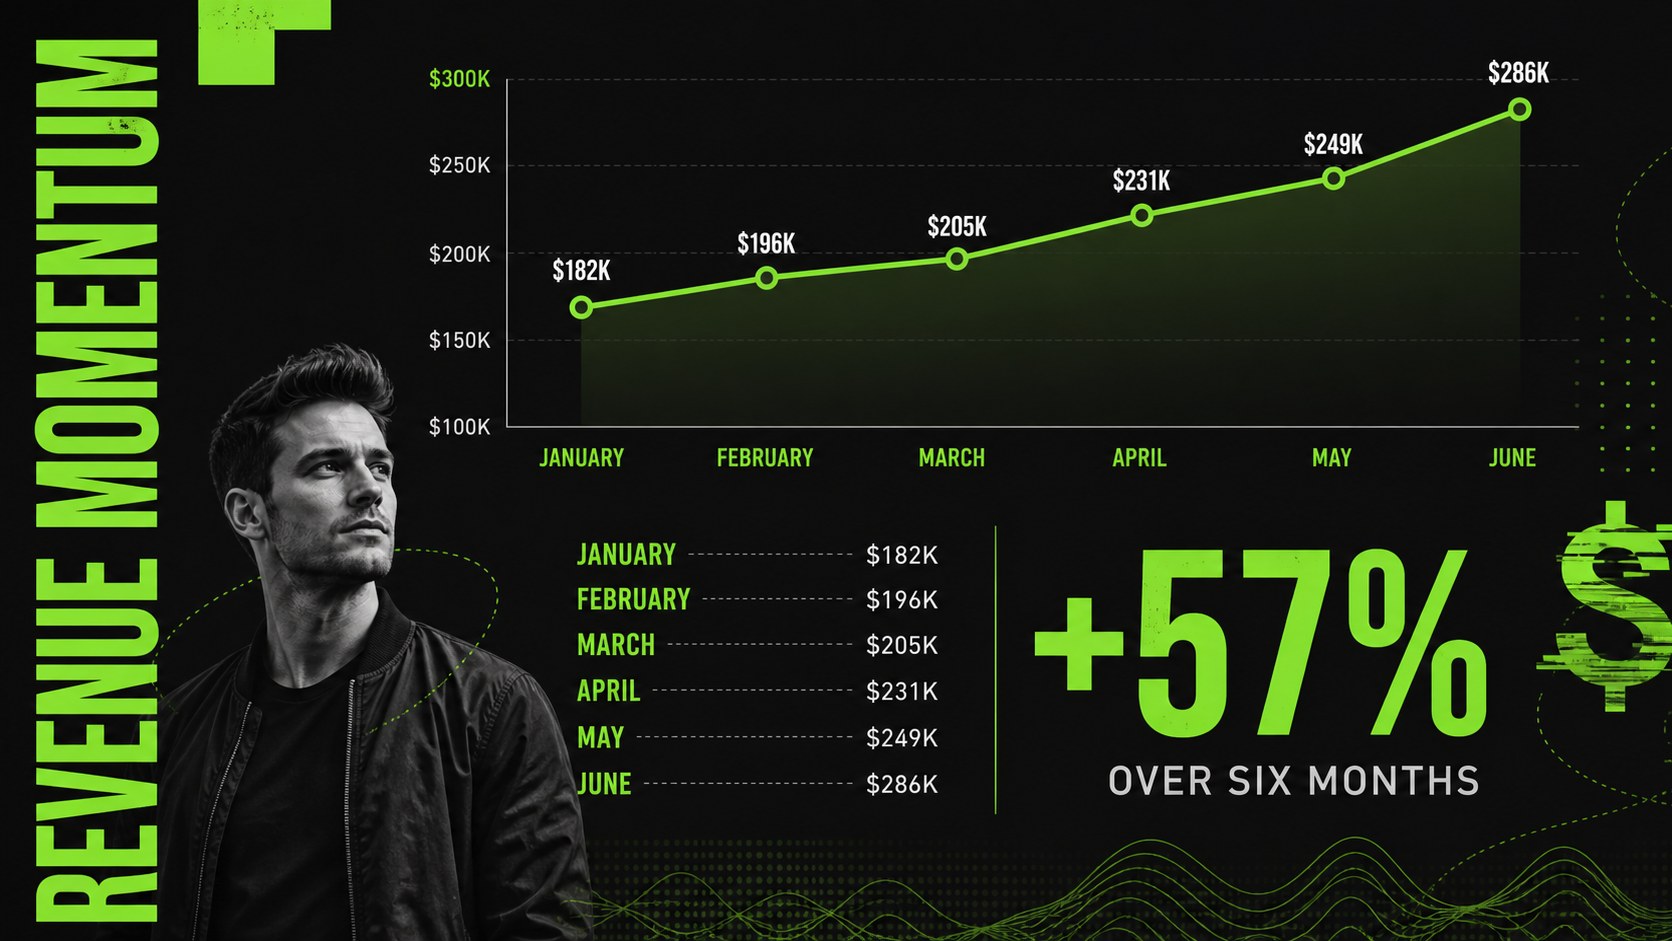
The presentation includes layouts for objectives, business snapshots, traffic sources, conversion funnels, customer segments, revenue trends, competitor comparisons and recommended actions. Flexible KPI panels, charts, tables and process diagrams make it suitable as a bold KPI dashboard presentation or an online revenue analysis template. Every slide can be adapted to match the metrics, terminology and reporting periods used by your organization.
Built for PowerPoint and Google Slides, the deck is easy to edit, present and share with remote audiences. Replace the sample figures, adjust the chart labels and reorganize sections to suit an agency audit, e-commerce review or executive briefing. Bebas Neue and Lato support the design's contrast between expressive headlines and readable detail, while the focused black and green palette maintains its acid-brutalist character throughout. It is an effective choice for analysts, growth marketers, digital strategists, business owners and webinar hosts who want a distinctive alternative to conventional corporate reporting slides.
Perfect for: website conversion audit webinar; e-commerce performance review; digital marketing KPI briefing; online revenue analysis; agency client strategy session.
Frequently asked questions
Can I edit the charts and performance figures? Yes. Replace the sample values, labels and categories with your own business data, then adjust chart colors or emphasis as needed. The layouts are structured to support common traffic, conversion and revenue metrics.
Practical details
Yes. Replace the sample values, labels and categories with your own business data, then adjust chart colors or emphasis as needed. The layouts are structured to support common traffic, conversion and revenue metrics.
The template is designed for PowerPoint and Google Slides. Upload or open the appropriate file, then edit the text, charts, colors and images using the platform's standard tools.
Yes. You can replace the sample content, add your logo, update fonts and introduce secondary brand colors. Retaining the black background and neon green accents will preserve the original acid-brutalist mood.
Yes. The large headlines, concise data panels and high-contrast visuals are designed to remain legible during screen sharing. Speaker notes can be added in PowerPoint or Google Slides for prompts and supporting detail.
Keep exploring
15Use this astrology audience insights deck to present zodiac-based segments, behaviors, and campaign findings in polished black-and-gold slides.
 14
Plan a memorable Lunar New Year campaign with the 2036 Dragon Year Celebration Theme, featuring bold red-and-yellow slides for lessons and events.
 15
Build eerie lessons, campaigns, and story pitches with an undead survival scenario theme featuring editable slides for PowerPoint and Google Slides.
 15
Build a clear breast cancer awareness bulletin with bold pink-and-red slides for campaign news, screening reminders, impact data, and community updates.
 15
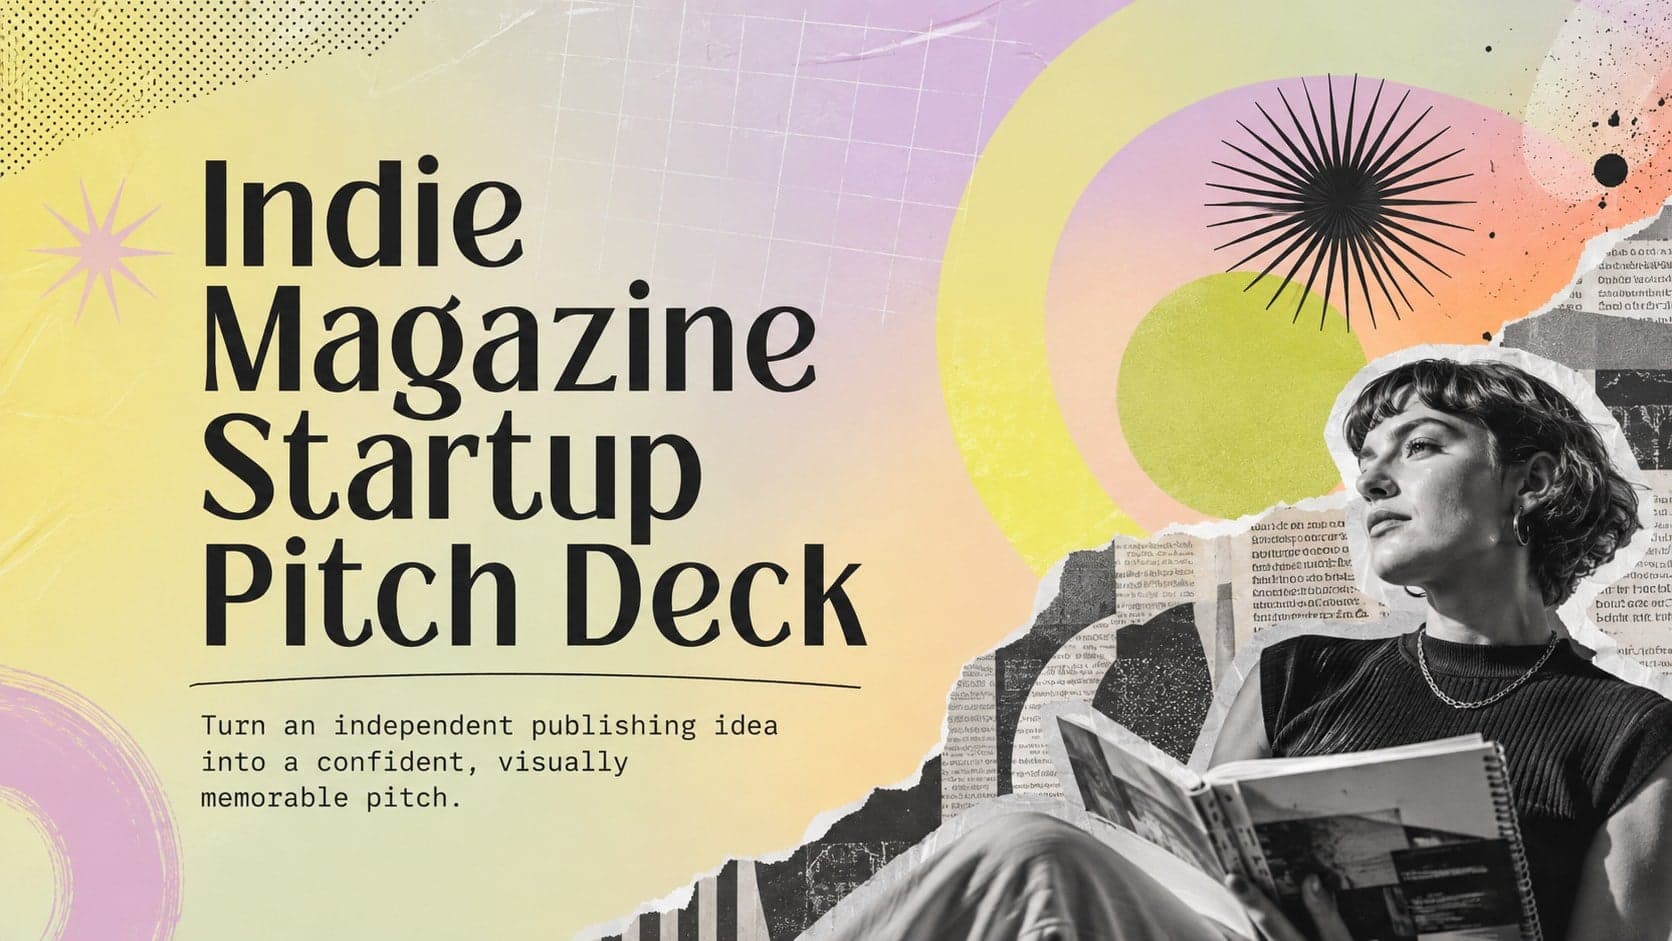
Shape your publishing concept with an indie magazine startup pitch deck featuring pastel gradients, bold collage layouts, and editable planning slides.
 15
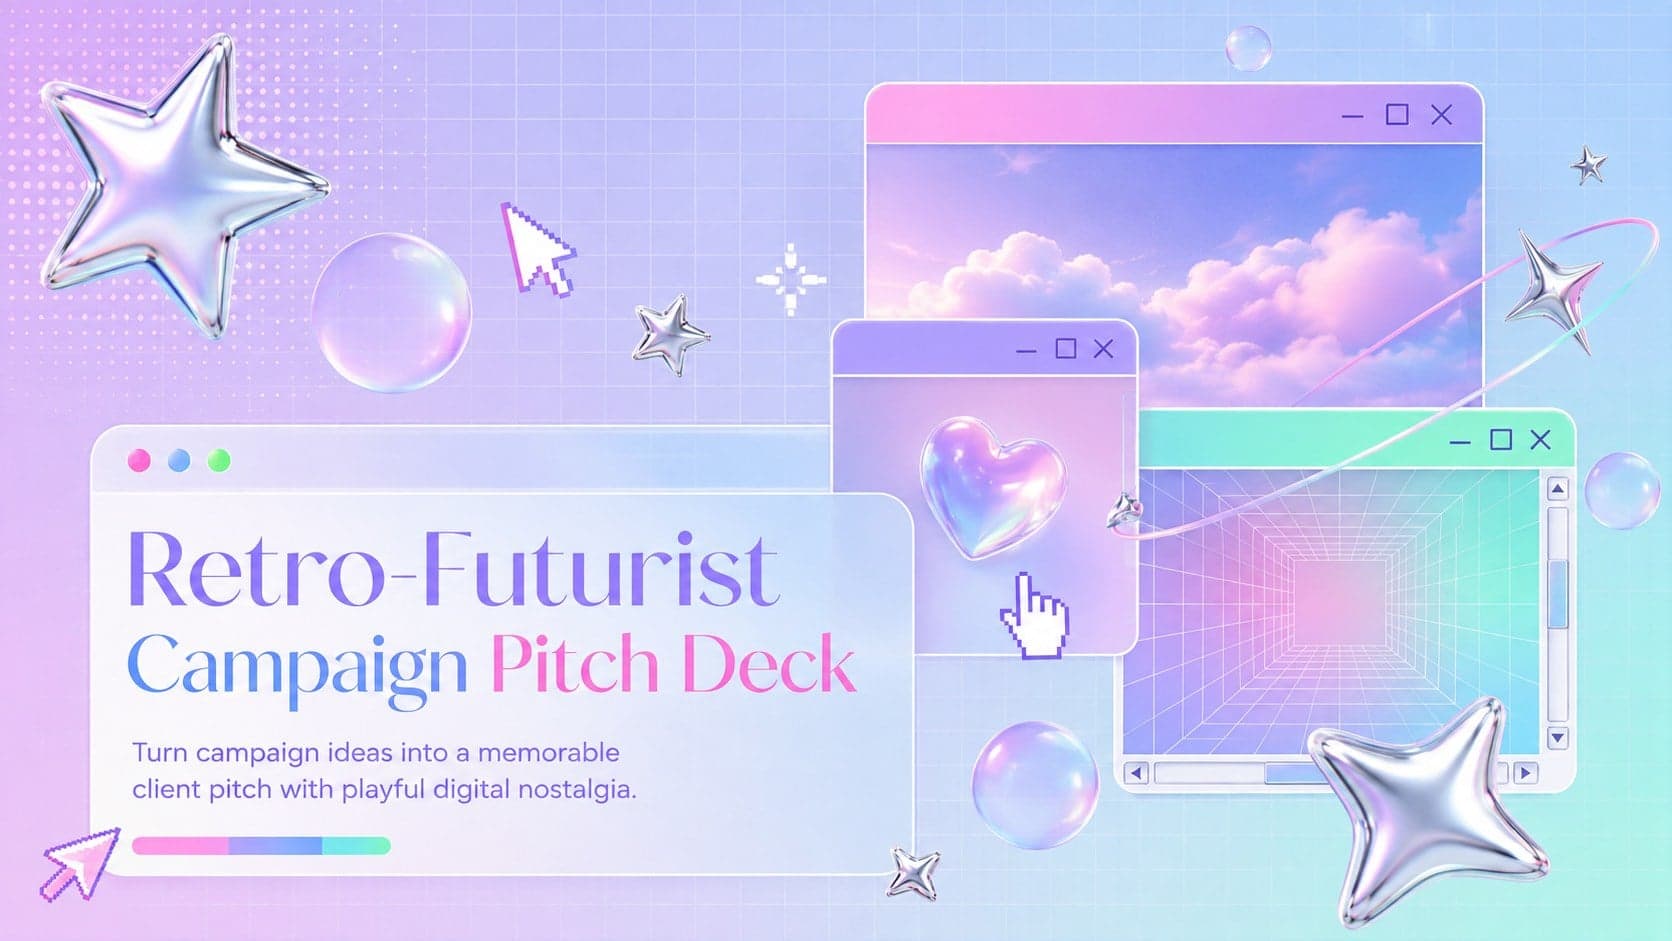
Build a bold retro-futurist campaign pitch deck for client meetings, with editable strategy layouts and playful pastel Y2K-inspired visuals.
 16
Build a consistent presence with a social channel identity playbook covering voice, visuals, content formats, publishing rules, and approvals.
 15
Celebrate online learners with webinar completion certificate slides, featuring editable violet artwork for university events in PowerPoint and Google Slides.