
 15
presentation
Indie Magazine Startup Pitch Deck
Shape your publishing concept with an indie magazine startup pitch deck featuring pastel gradients, bold collage layouts, and editable planning slides.
Google SlidesPowerPoint
presentation · English
Turn onboarding data into clear decisions with a customer activation metrics deck featuring editable green geometric layouts for PowerPoint and Google Slides.

Design notes
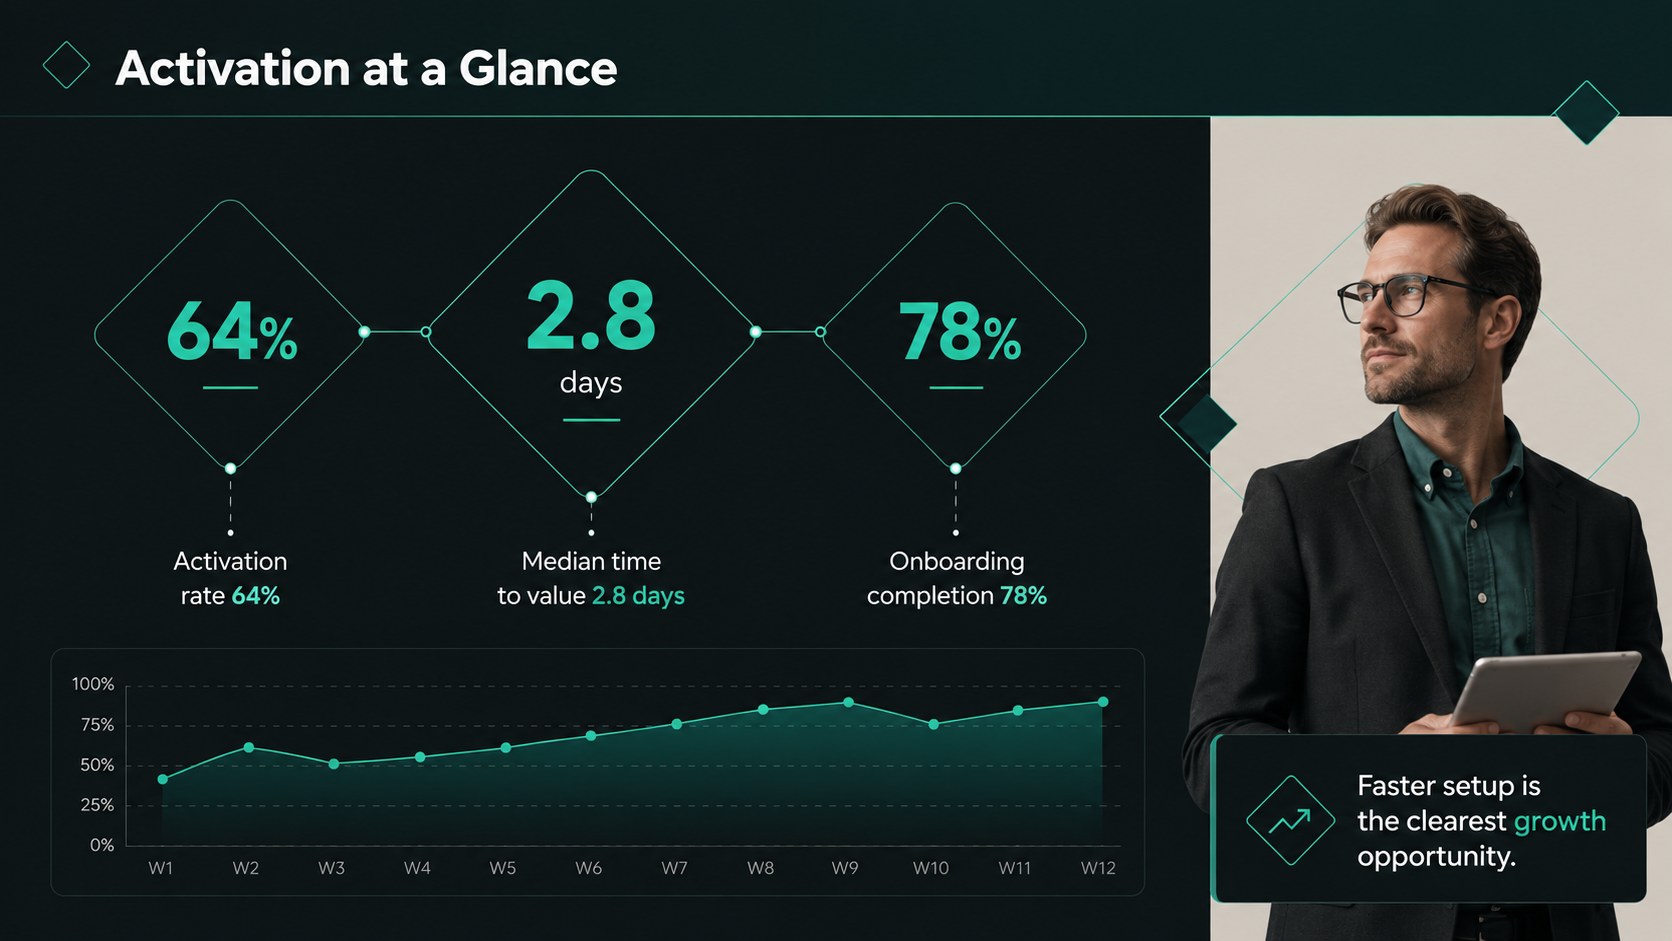
Make early customer behavior easier to understand with this customer activation metrics deck. Designed for business, product, and customer success teams, its dark green palette, crisp geometric shapes, and minimal layouts give onboarding data a polished, modern setting. Use it to connect key figures with a clear narrative rather than presenting disconnected charts.
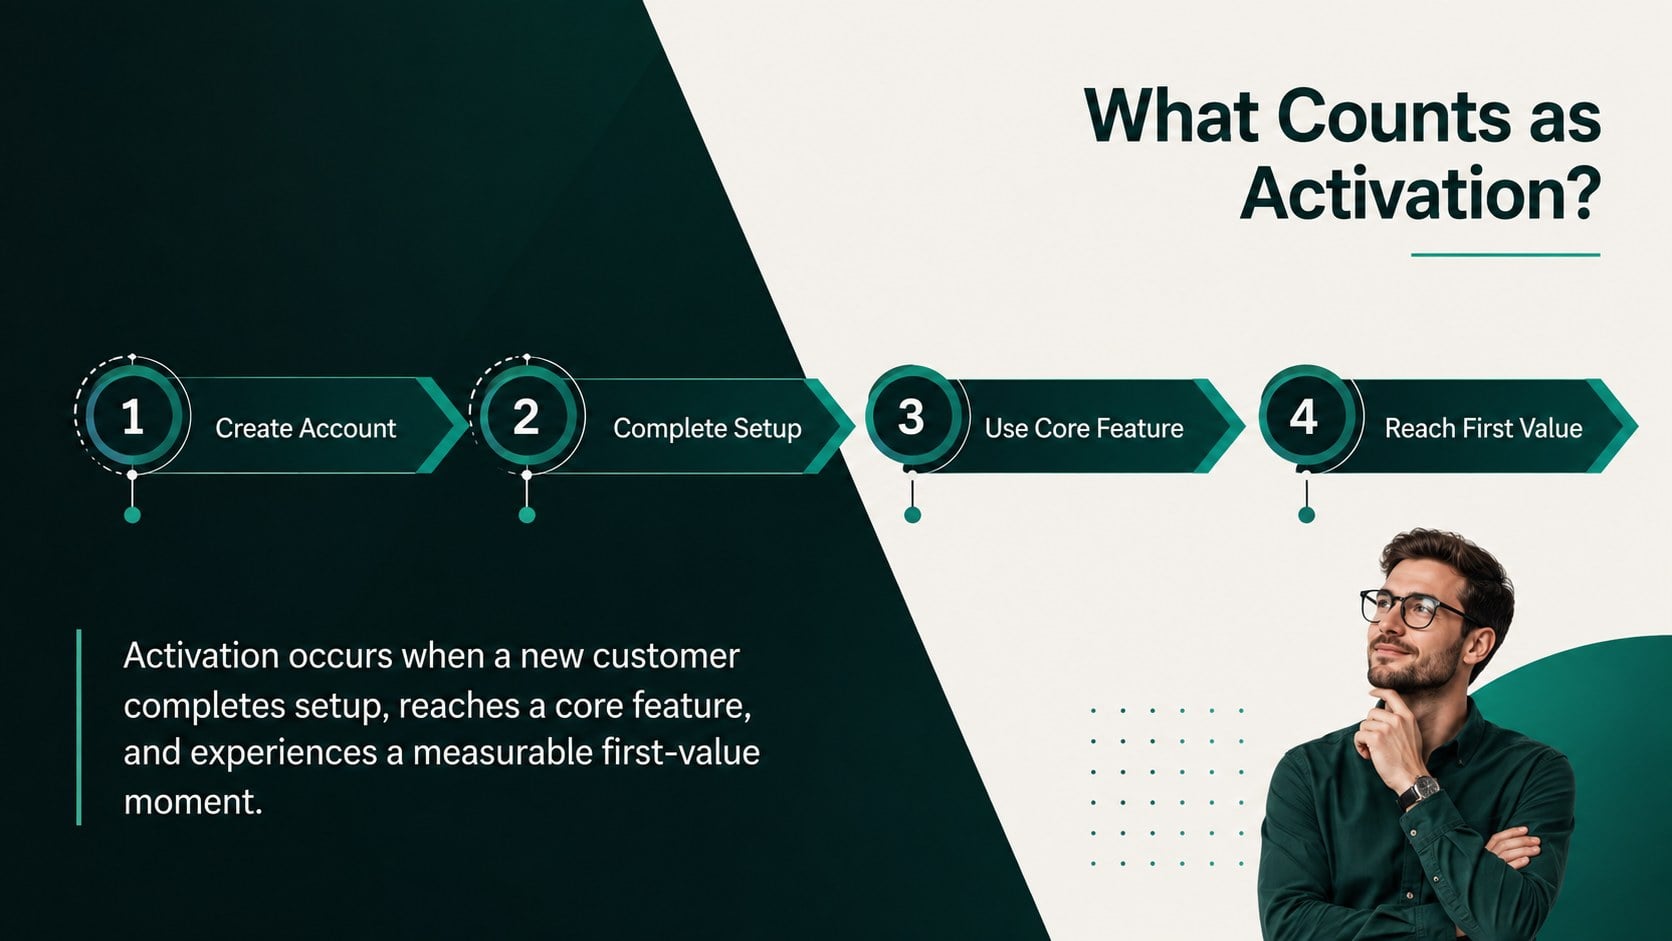
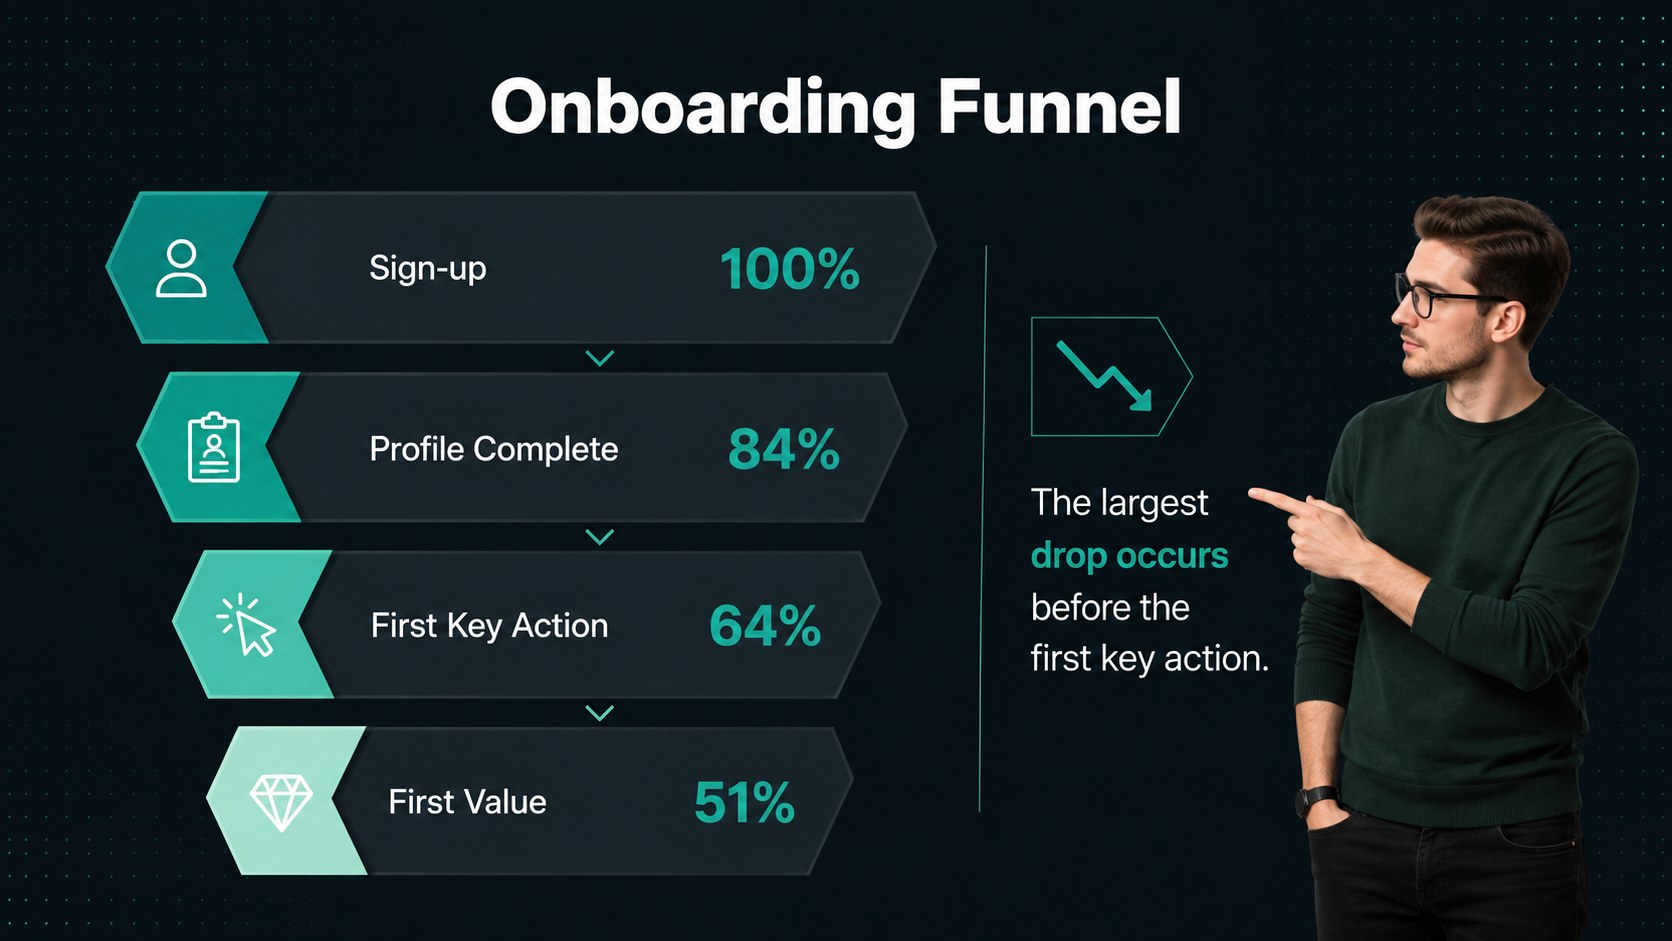
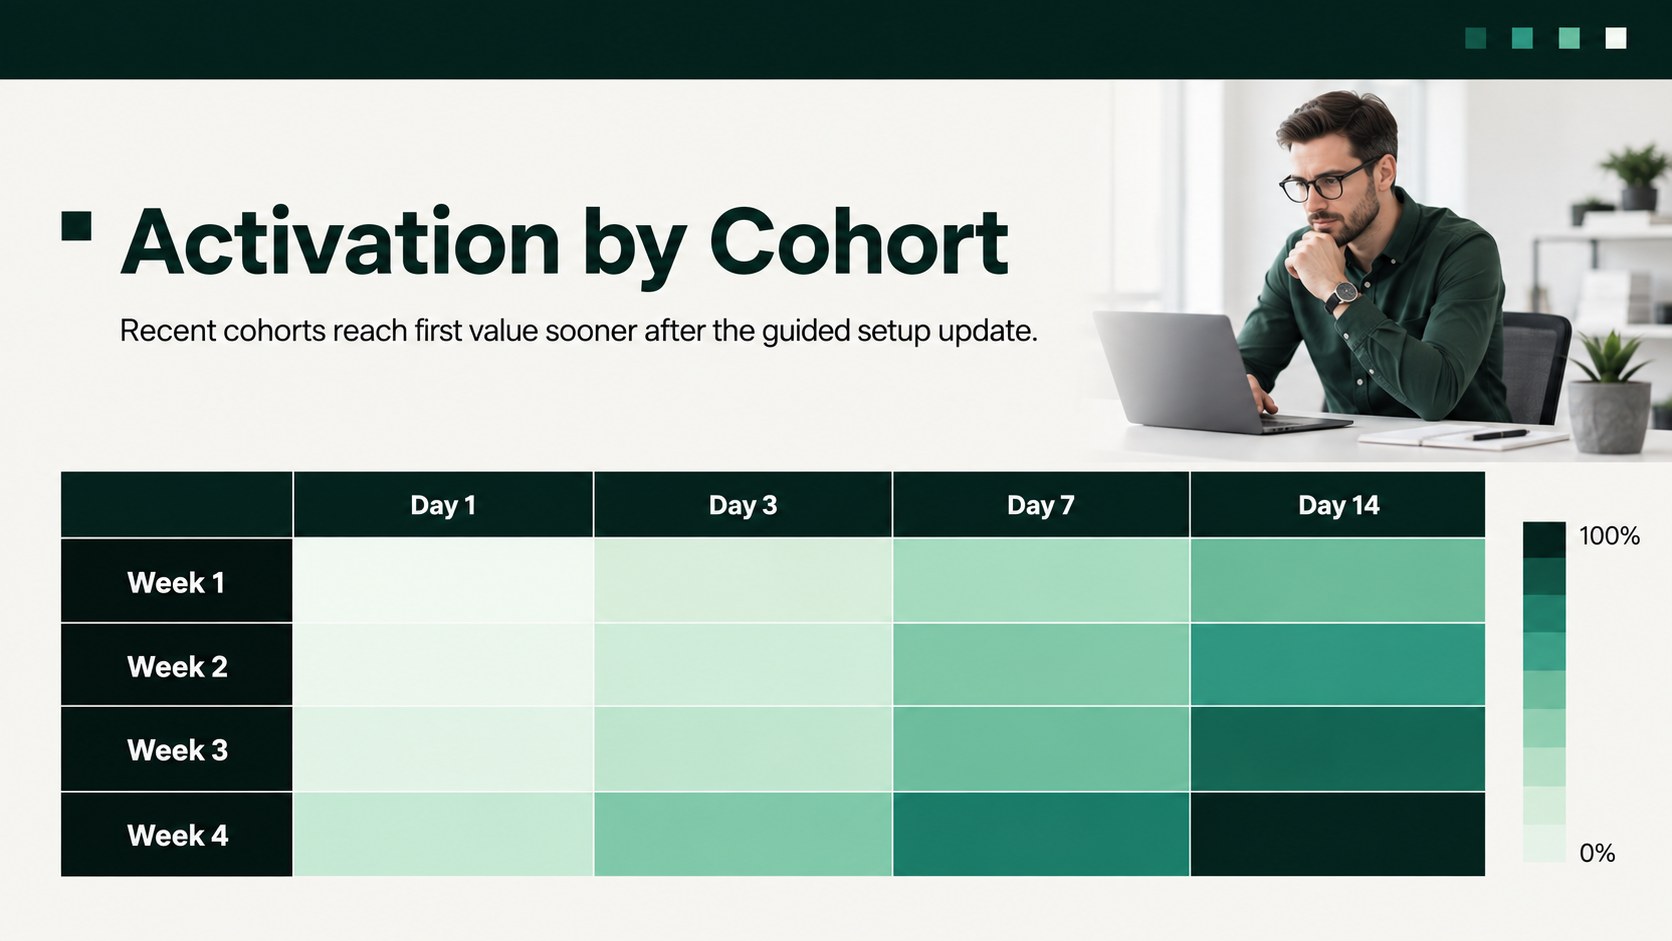
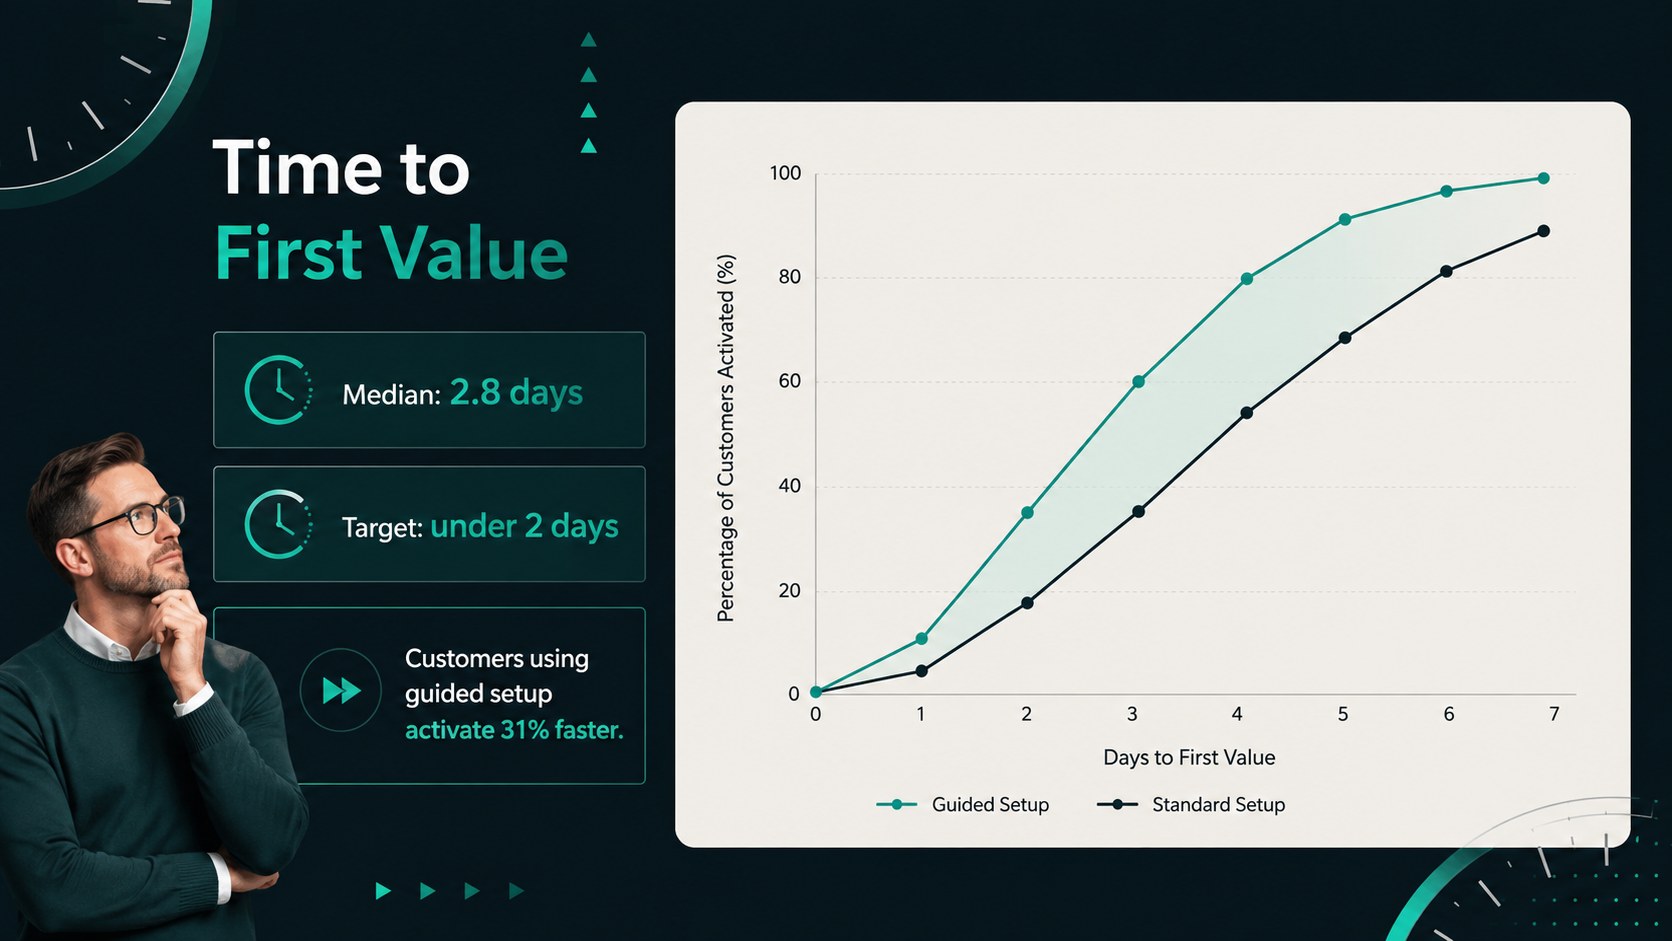
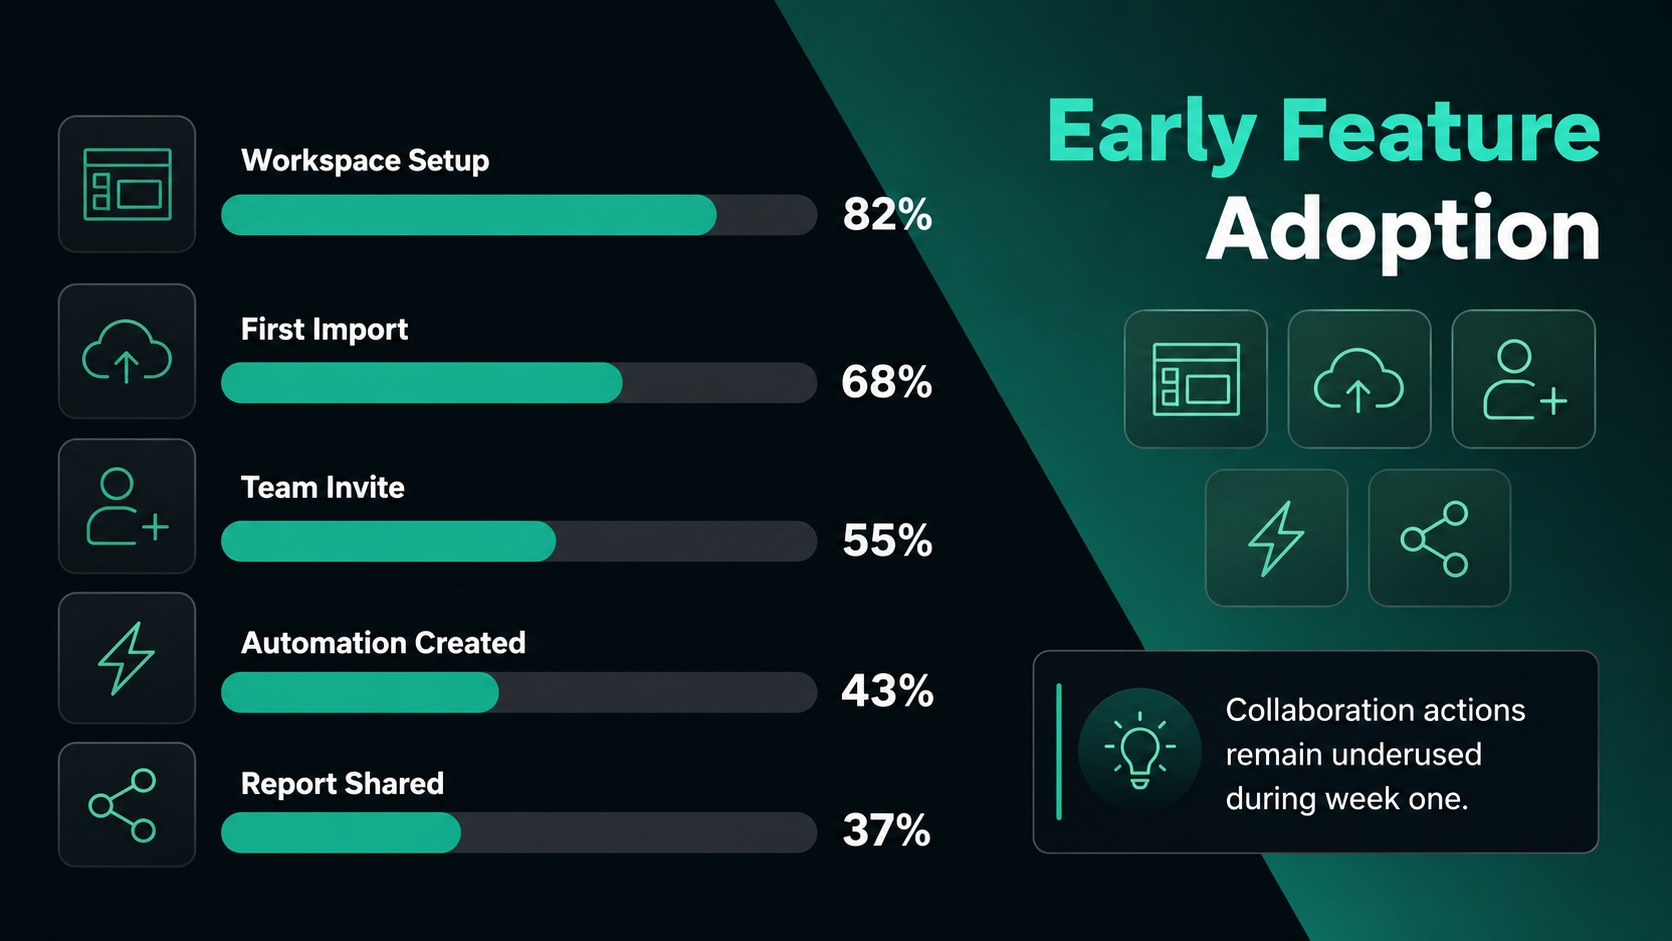
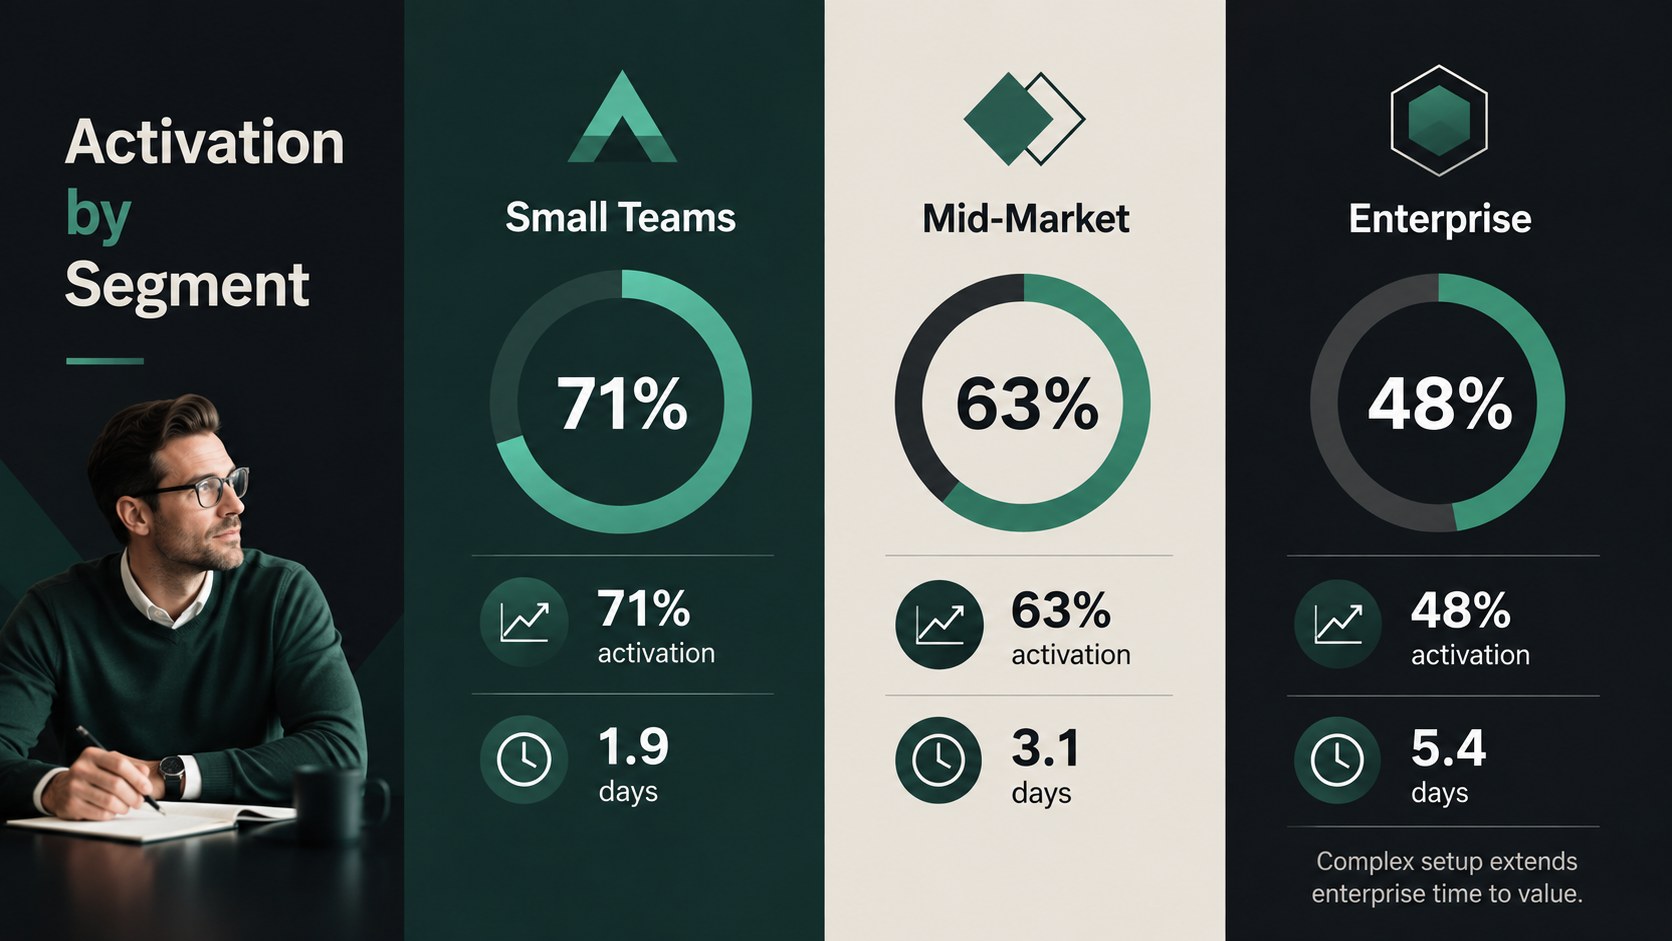
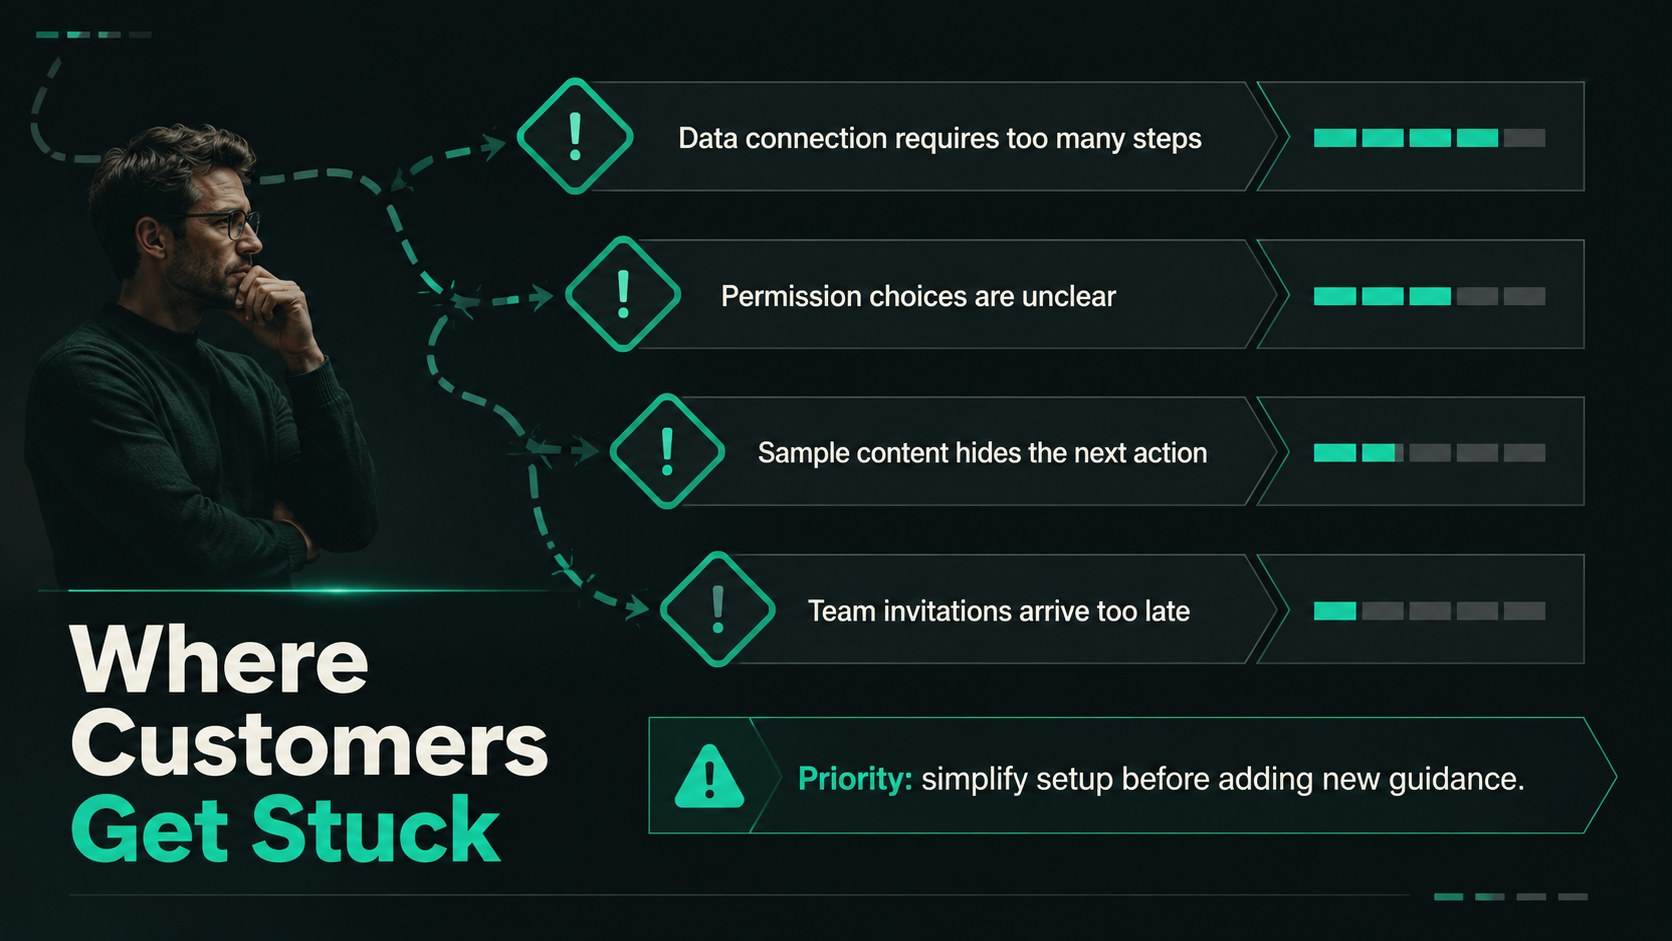
The deck includes layouts for an executive summary, activation funnel, cohort comparison, time-to-value analysis, feature adoption, customer feedback, friction signals, and improvement priorities. It can serve as a customer onboarding KPI presentation for recurring reviews or as an onboarding funnel analysis deck for a focused optimization project. Editable charts, timelines, tables, process diagrams, and callout areas help you adapt the story to your own product and measurement framework.
Product managers can use the slides to assess first-session behavior, while customer success leaders can summarize onboarding health for stakeholders. Growth teams, consultants, SaaS operators, and implementation managers can also shape it into a product adoption metrics presentation for experiments, quarterly reviews, or client reporting. Every slide can be customized in PowerPoint or Google Slides, including colors, type, labels, data, and section order. The result is a flexible reporting toolkit for identifying where customers gain value, where they hesitate, and which actions deserve attention next.
Perfect for: monthly onboarding performance review; SaaS activation funnel analysis; customer success leadership update; product adoption experiment report; client onboarding strategy workshop.
Frequently asked questions
Can I edit the activation metrics and charts? Yes. Replace the sample figures, labels, chart series, and KPI definitions with your own onboarding data. You can also reorder sections to match your reporting workflow.
Practical details
Yes. Replace the sample figures, labels, chart series, and KPI definitions with your own onboarding data. You can also reorder sections to match your reporting workflow.
The deck is designed for PowerPoint and Google Slides. Standard text, shape, table, and chart elements can be adjusted directly in either platform.
Yes. Change the green accents, dark backgrounds, typography, and geometric elements to fit your organization. Maintain strong contrast between labels and backgrounds when applying a different palette.
Common measures include activation rate, onboarding completion, time to first value, feature adoption, drop-off rate, and support volume. Select only the metrics tied to meaningful customer outcomes.
Keep exploring
15Shape your publishing concept with an indie magazine startup pitch deck featuring pastel gradients, bold collage layouts, and editable planning slides.
 16
Build clear project stories with the Icon Grid Teamwork Theme, a flexible blue illustrated deck for proposals, strategy updates, and team meetings.
 3
Turn priorities into an actionable plan with an annual goals roadmap infographic, featuring editable orange and teal layouts for PowerPoint and Google Slides.